
Kinetics of hip joint
hip joint kinetics biomechanics forces diagram
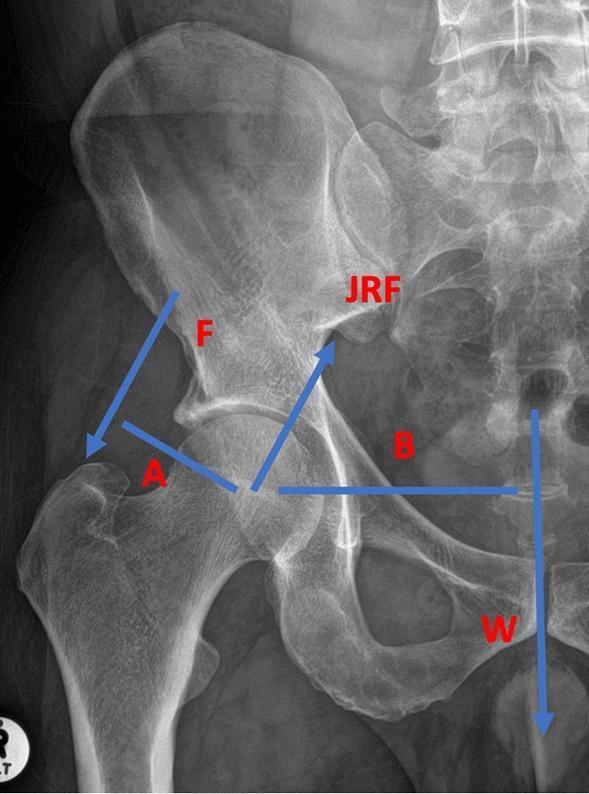
This diagnostic image is an anteroposterior (AP) X-ray of the human right hip joint integrated with a biomechanical free body diagram. Anatomical structures clearly visible include the proximal femur (head, neck, and greater trochanter), the acetabulum of the pelvis, the ilium, and the lower lumbar spine. The diagram overlays several vectors and moment arms to illustrate hip joint loading. The arrow labeled 'F' represents the abductor muscle force acting from the ilium toward the greater trochanter. 'W' denotes the downward force of body weight. 'JRF' indicates the Joint Reaction Force acting across the femoral head and acetabulum. Two blue lines, 'A' and 'B', represent the moment arms for the abductor muscles and body weight, respectively, calculated from the center of rotation of the femoral head. This educational visual is used in orthopedic biomechanics to explain how muscle forces and body weight interact to determine joint stress, which is critical for understanding the pathophysiology of osteoarthritis or the mechanical consequences of corrective osteotomies.
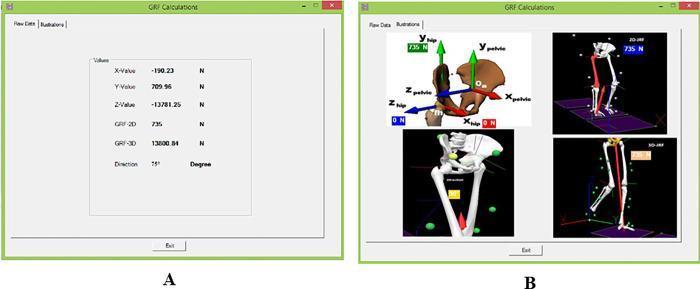
This composite image illustrates the biomechanical analysis of Ground Reaction Forces (GRF) at the hip joint using specialized AQHF software. Panel A displays a 'Raw Data' window showing numerical outputs for force components including X, Y, and Z values in Newtons (N), alongside 2D and 3D GRF resultants and a vector direction of 75 degrees. Panel B provides a graphical representation of this data through anatomical diagrams of the pelvis and femur. It highlights two distinct coordinate systems: the pelvic frame (x_pelvic, y_pelvic, z_pelvic) and the hip frame (x_hip, y_hip, z_hip), with force vectors (735 N and 0 N) mapped onto these axes. Additional panels in B show 2D and 3D JRF (Joint Reaction Force) visualizations on a skeletal model during a simulated gait phase. This material is designed for orthopedic biomechanics education, focusing on hip joint kinetics, prosthetic design considerations, and gait analysis during single-limb support.
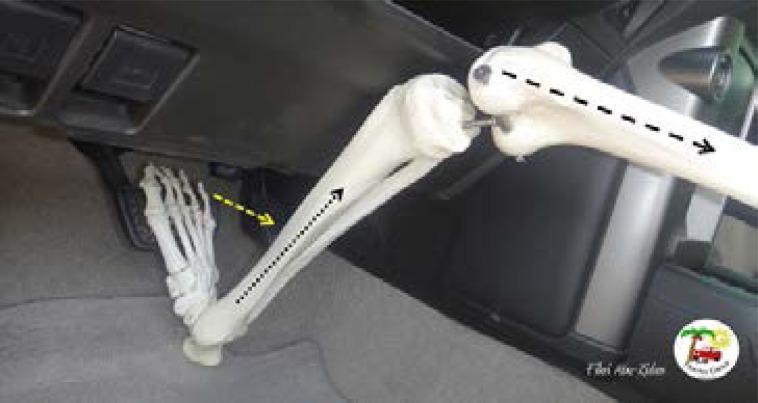
A clinical educational diagram illustrating the biomechanics of lower limb trauma during a frontal-impact motor vehicle collision. The image features a skeletal model of a human lower limb—comprising the femur, tibia, fibula, and foot bones—superimposed within a vehicle's interior. A dashed black arrow indicates the primary mechanism of 'dashboard injury,' where the patella or proximal tibia impacts the dashboard, transmitting axial forces through the femur toward the hip joint, potentially leading to acetabular fractures or posterior hip dislocations. A second dashed yellow arrow highlights the abrupt dorsiflexion and axial loading of the ankle joint caused by forceful application of the brake pedal during impact, a mechanism associated with pilon, talar, and calcaneal fractures. A third dotted black arrow follows the longitudinal axis of the tibia, representing the transmission of energy through the lower leg. The visual serves to educate healthcare professionals on the relationship between occupant posture, vehicle component interface, and specific orthopedic injury patterns in automotive accidents.
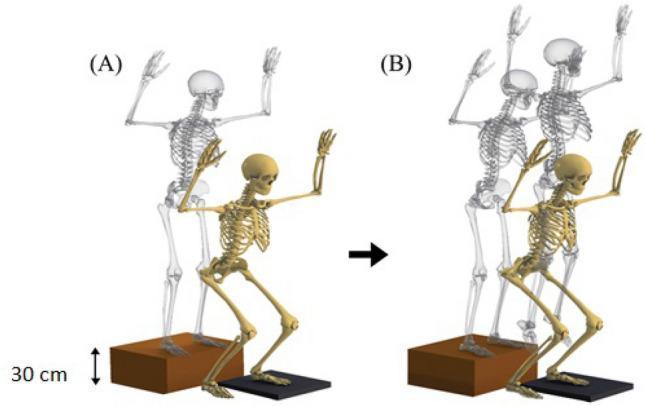
This medical illustration depicts the biomechanics of a vertical drop jump (VDJ) using skeletal models to demonstrate musculoskeletal kinetics. Figure (A) illustrates the 'drop phase,' where the skeleton transitions from a 30 cm box to a landing platform. The model shows significant hip flexion, knee flexion, and ankle dorsiflexion, representing the eccentric loading phase upon initial contact. Figure (B) depicts the subsequent 'vertical jump phase' after landing. It shows the transition to an explosive concentric movement, characterized by rapid extension of the spine, hips, and knees, along with plantar flexion of the ankles. In both phases, the upper limbs are abducted and raised, a technique used to avoid obstructing anatomical markers during motion analysis. Translucent ghost images provide a visual timeline of the skeletal trajectory. This diagram is utilized in sports medicine and physiotherapy to analyze dynamic knee valgus (DKV), joint moments, and injury risk factors like ACL strain during high-impact athletic maneuvers.
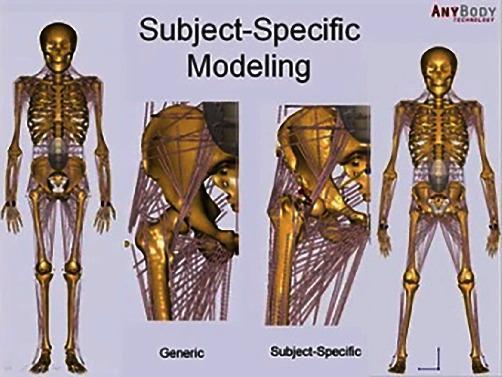
This Comparison Chart illustrates musculoskeletal modeling from the AnyBody simulation system, highlighting the differences between 'Generic' and 'Subject-Specific' anatomical representations. The central focus is a comparison of the hip region. The 'Generic' model depicts a standardized hip joint with simplified muscle fiber paths, shown as thin purple lines connecting the pelvis and femur. In contrast, the 'Subject-Specific' model features more complex and dense muscle fiber arrangements, reflecting individualized anatomy and biomechanical detail. On the far left and right, full-body musculoskeletal diagrams display the human skeletal frame—including the skull, thoracic cage, vertebral column, and appendicular skeleton—overlaid with an integrated muscular network. This visual material is used in biomechanics and physical therapy for kinematic analysis and gait simulation, specifically for studying joint reaction forces in the hip, knee, and ankle. The diagram serves as an educational tool for understanding musculoskeletal modeling and its clinical application in orthopedic research and personalized medicine.
Kinetics of the Hip Joint
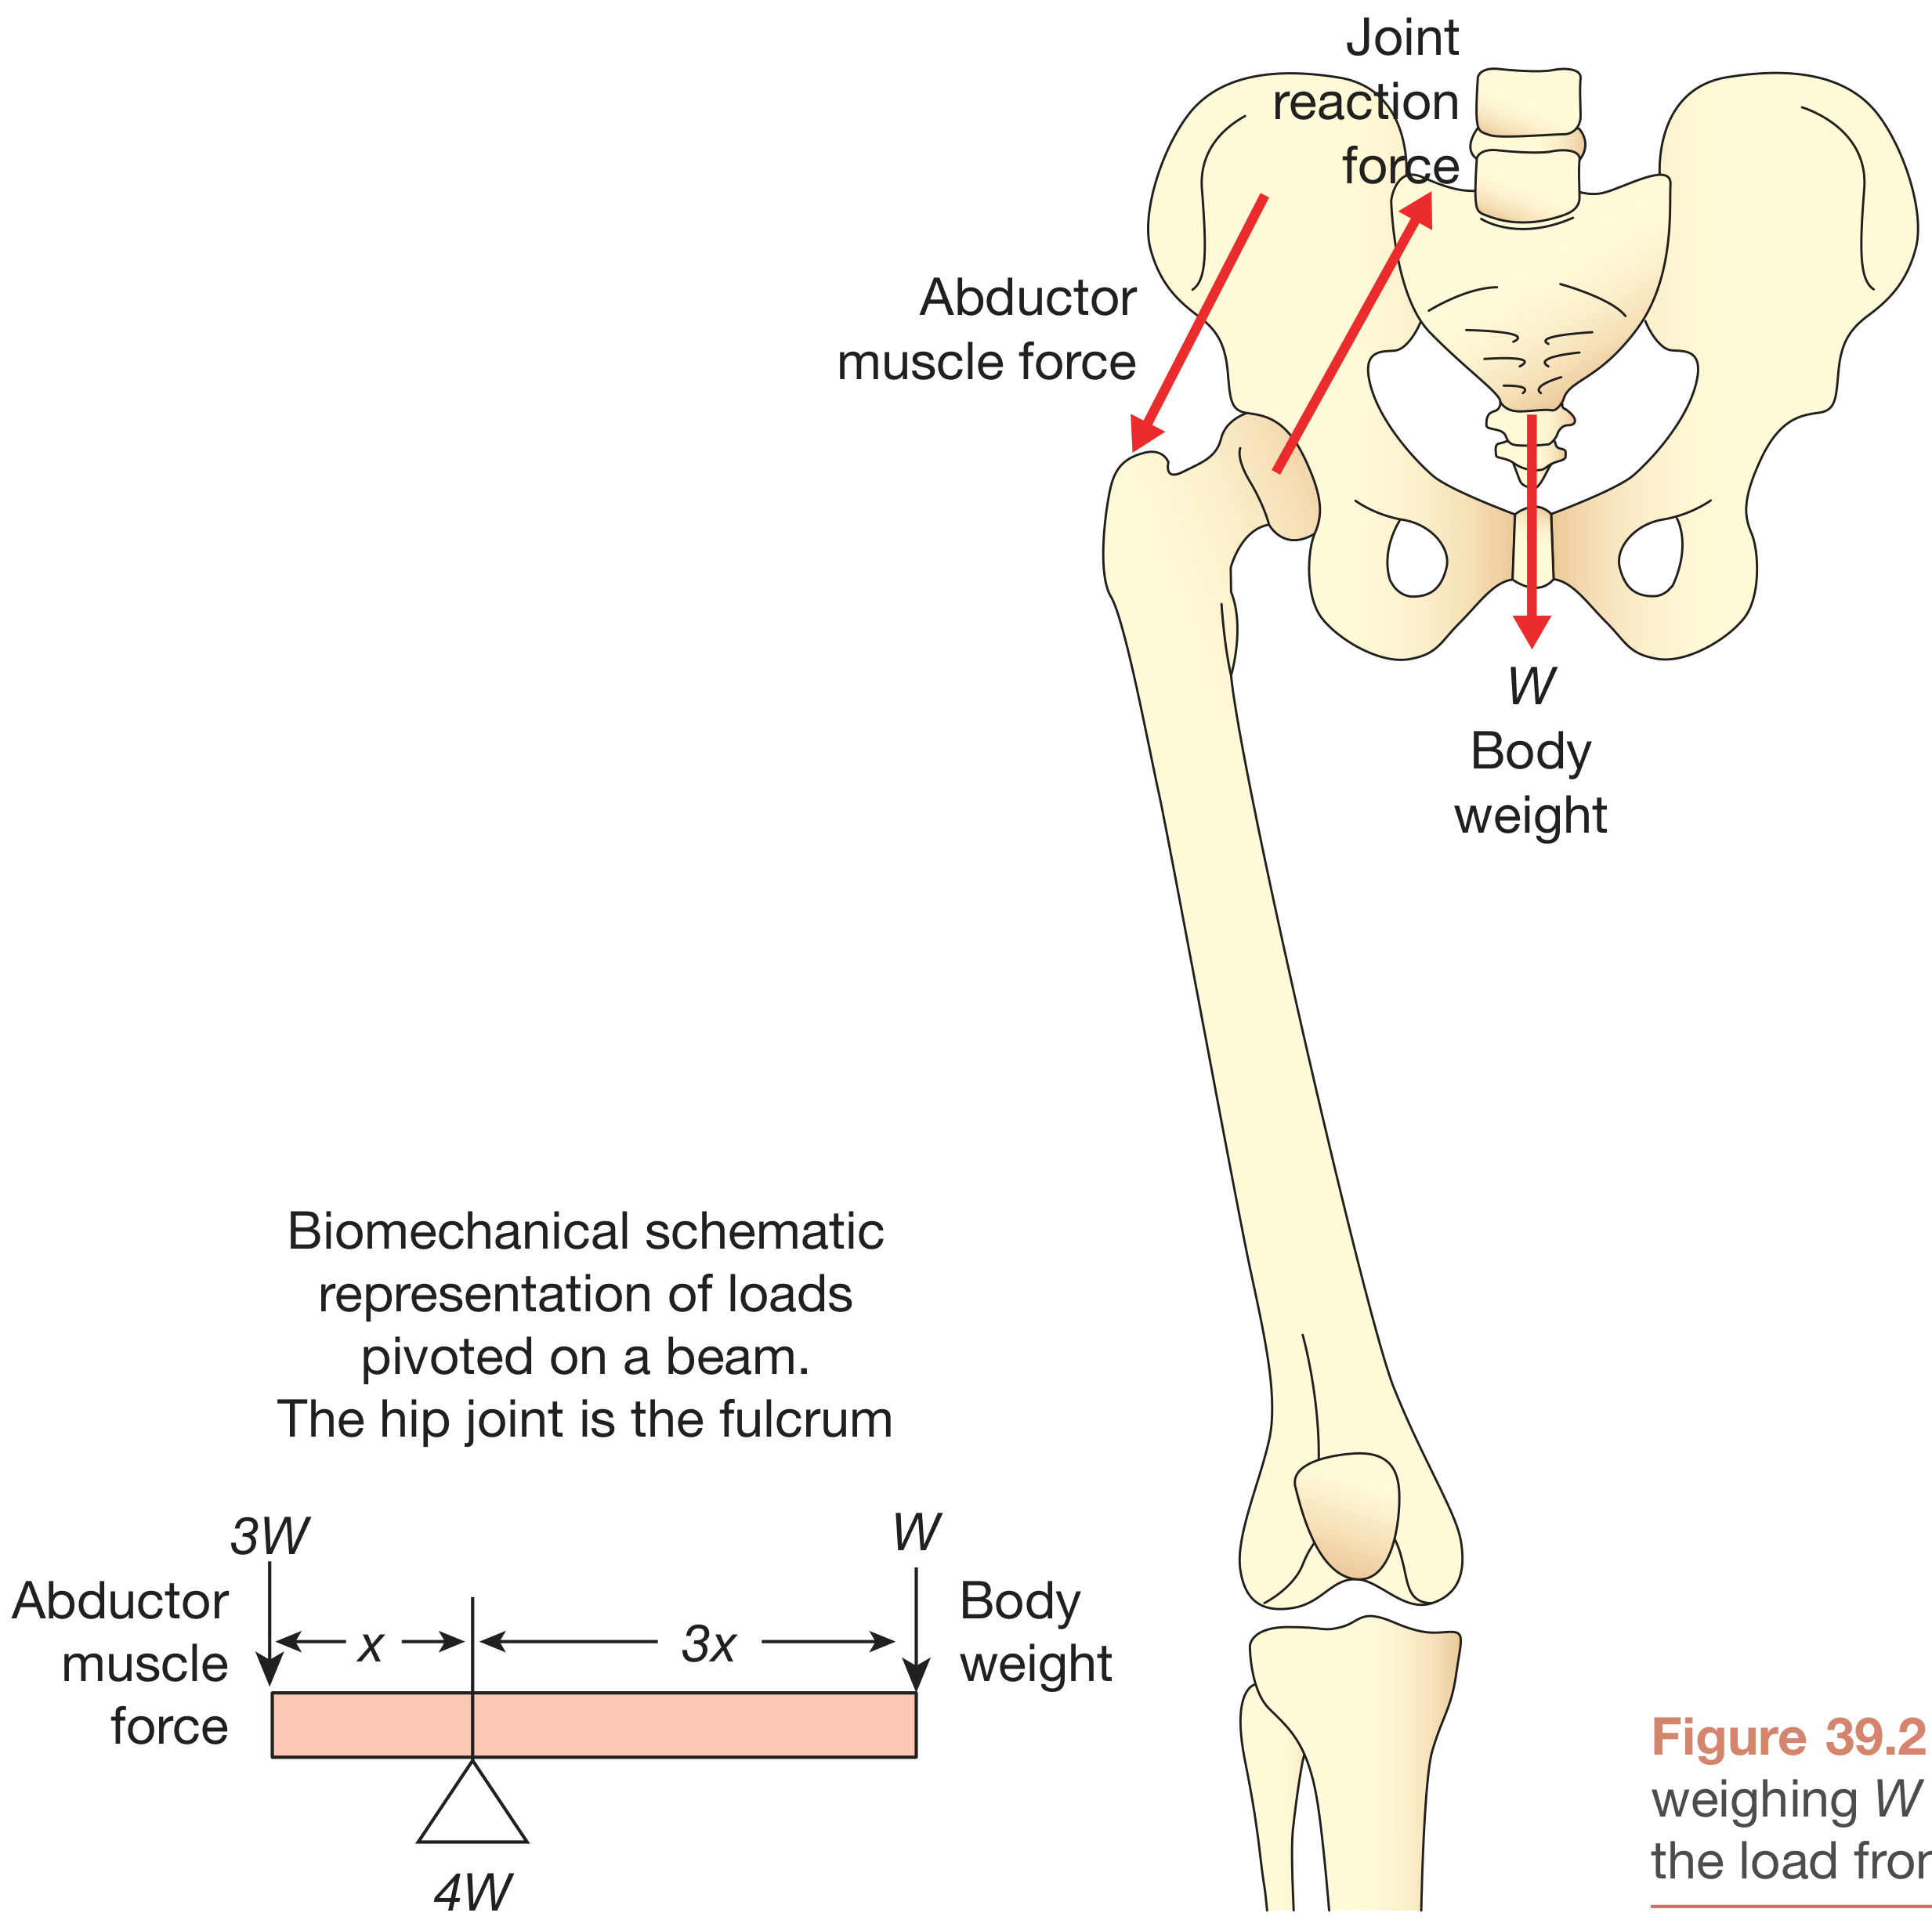
The Lever-Arm Principle
- Body weight (W) - the partial body weight (everything above the stance hip) acting downward through the center of mass
- Abductor muscle force (M) - acting at the greater trochanter
- Joint reaction force (R) - the resultant force transmitted through the femoral head into the acetabulum
Joint Reaction Force (JRF)
| Activity | Joint Reaction Force |
|---|---|
| Lifting leg from bed | ~1.5× body weight |
| Standing on one leg | ~3× body weight |
| Normal walking | ~3-4× body weight |
| Running / jumping | up to 8-10× body weight |
Statics of Single-Limb Stance: The Abductor Moment
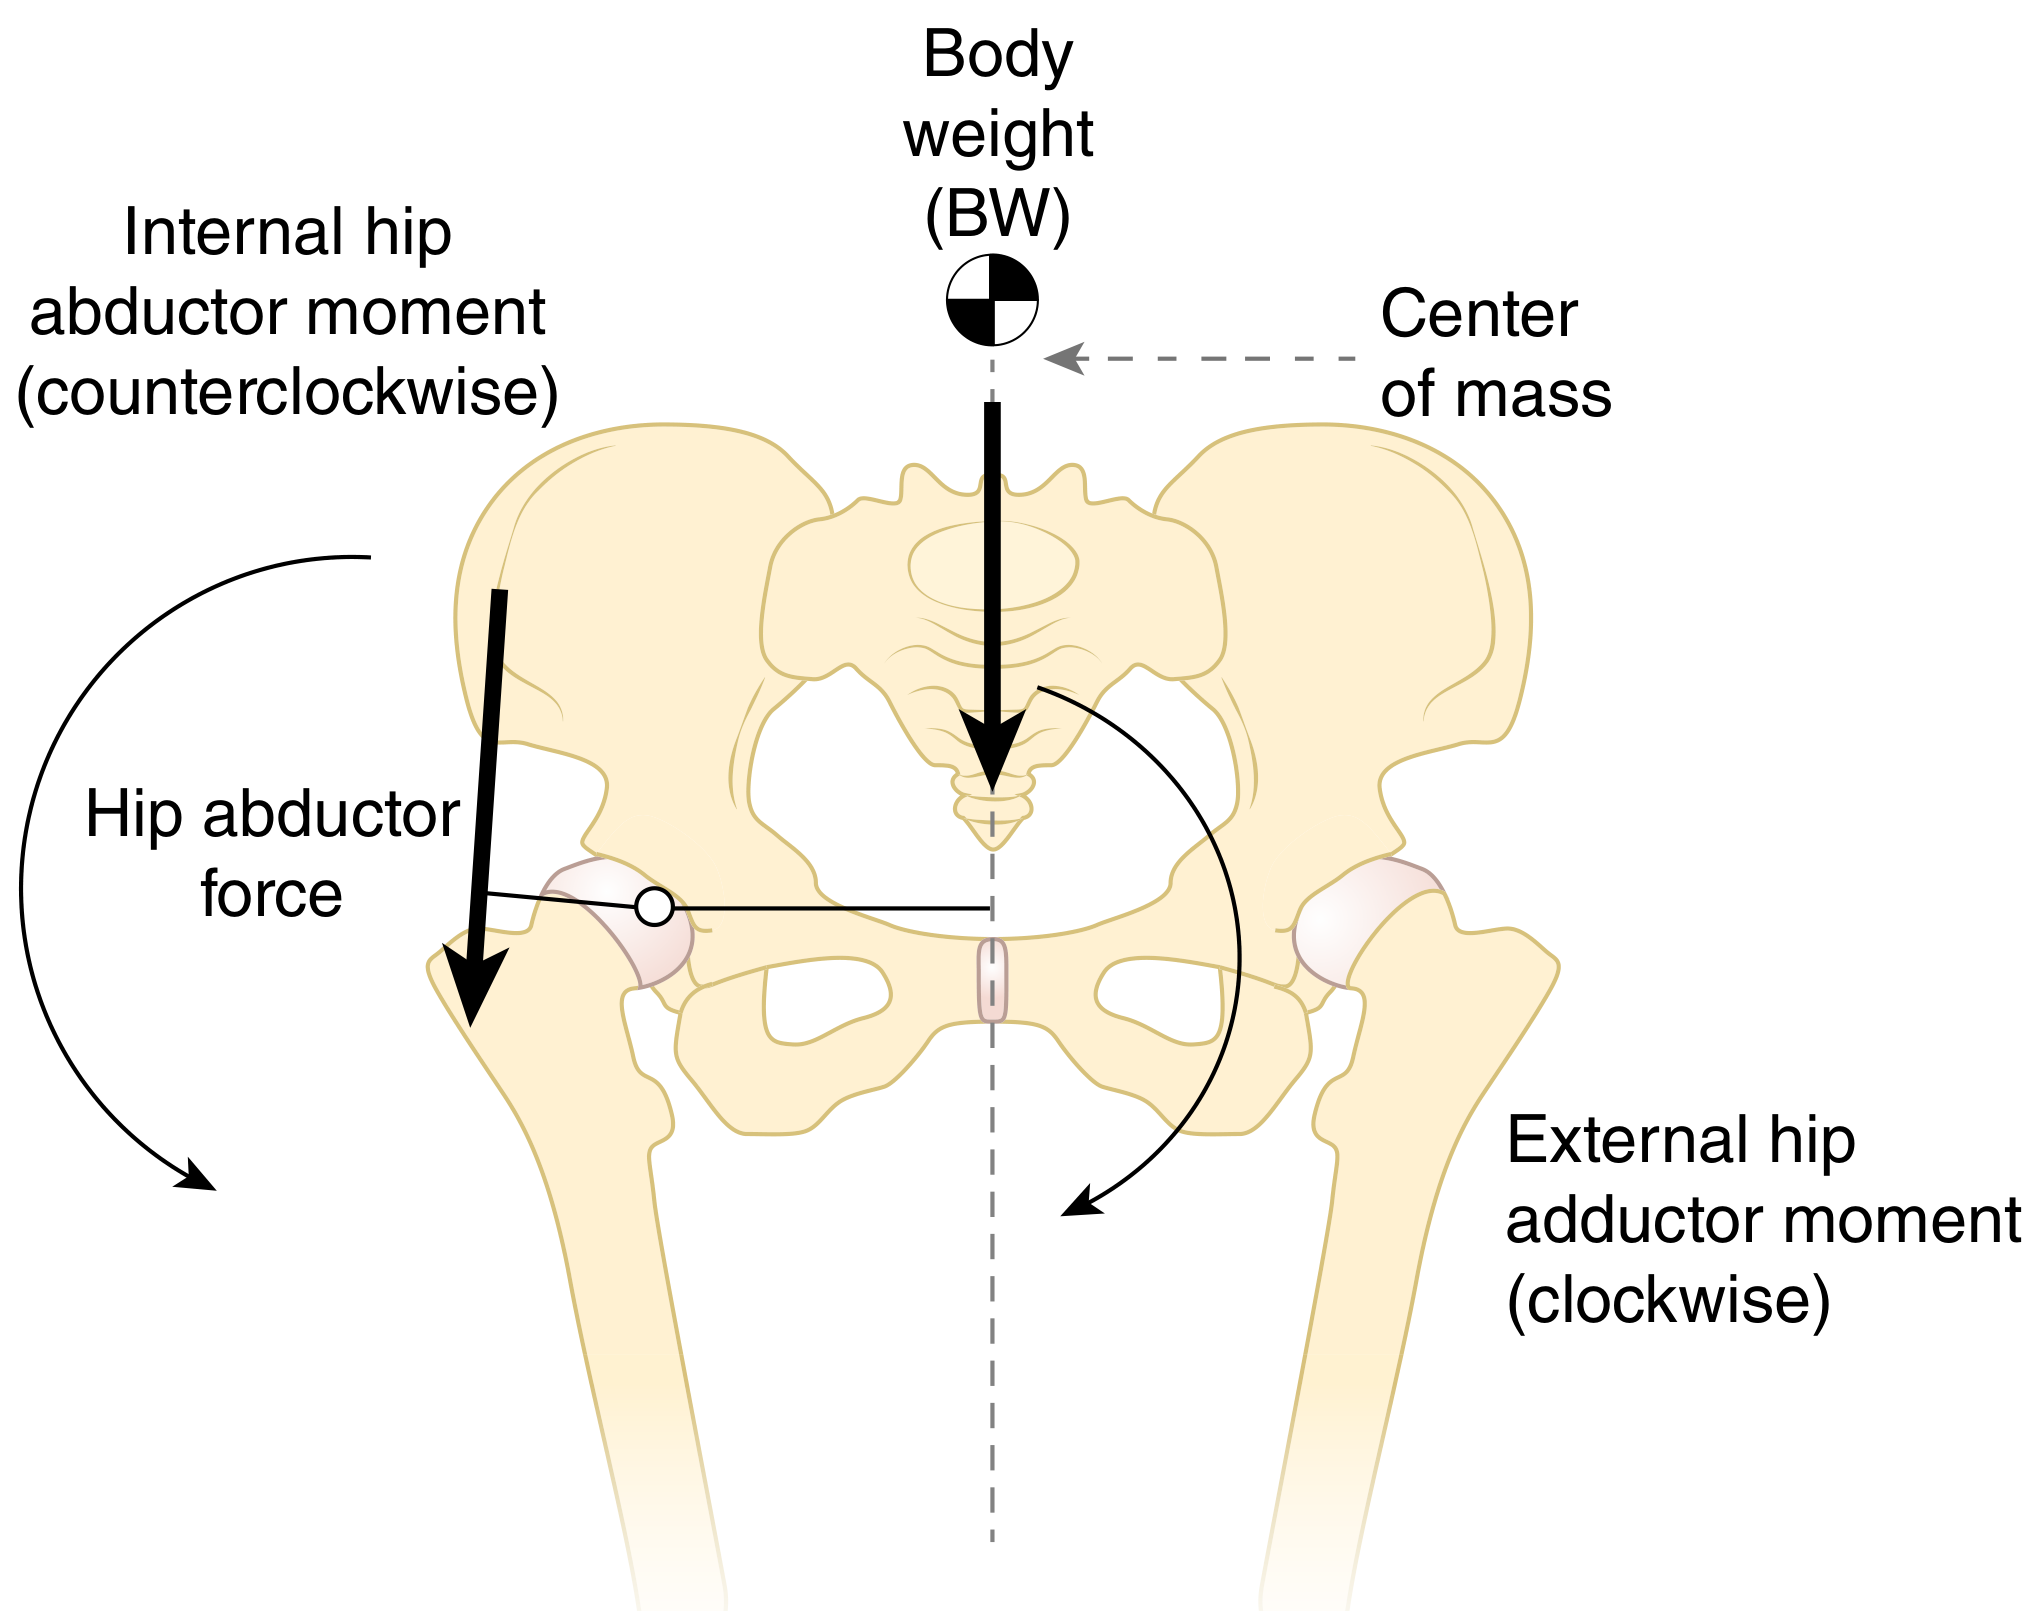
- If the abductor moment is insufficient - the contralateral pelvis drops = Trendelenburg sign / gait
- If the abductor moment equals the adduction moment - static equilibrium, pelvis remains level
- Firestein & Kelley's Textbook of Rheumatology
Effect of Femoral Neck Angle (CCD Angle) on Hip Load
| Condition | CCD Angle | Abductor Lever Arm | Joint Reaction Force |
|---|---|---|---|
| Normal | ~126° | Normal | ~4× body weight (R = 4K) |
| Coxa valga | >126° | Shorter | Increased (R = 7K) |
| Coxa vara | <126° | Longer | Decreased (R = 3K) |
- The greater trochanter shifts medially, shortening the abductor moment arm
- Abductors must generate more force to produce the same moment
- More abductor force = greater joint contact force
- Coxa valga often coexists with acetabular dysplasia (reduced coverage), simultaneously increasing force AND decreasing contact area - stress (force/area) rises dramatically, accelerating cartilage damage
Moment Arms and Stress
Stress = Force / Contact Area
Strategies to Reduce Hip Joint Load
- Lean toward the affected side (Duchenne limp): Shifts the center of mass toward the hip, shortening the body weight lever arm and reducing the required abductor force and JRF
- Carry a load on the affected side: Same effect - moves center of mass toward the hip
- Use a cane on the unaffected (opposite) side: The cane provides an additional counterforce at the end of the body weight lever arm, reducing the net adduction torque and thus the required abductor force
- Weight loss: Directly reduces body weight (W) and therefore JRF
- Femoral osteotomy: Surgically alters CCD angle to optimize abductor lever arm
- THIEME General Anatomy and Musculoskeletal System, Atlas
Summary
| Concept | Key Point |
|---|---|
| Hip joint fulcrum | Acts as first-class lever; abductor lever arm ~1/3 of body weight lever arm |
| Abductor force | ~3× body weight during single-limb stance |
| Joint reaction force | ~4× body weight walking; up to 10× during running |
| Trendelenburg | Failure of abductors to generate adequate abduction moment |
| Coxa valga | Short abductor lever arm → more force needed → more JRF |
| Coxa vara | Long abductor lever arm → less force needed → less JRF |
| Cane (opposite side) | Reduces hip JRF by offsetting adduction moment |