
Give detailed notes based on the main topic "Approach to patient with oedema (nephrotic syndrome, heart failure, liver disease and CKD)". Focus on the following topic learning outcome (TLOs): 1. Explain the pathophysiology of oedema. 2. Discuss the clinical approach to patient with oedema, identify the differential diagnoses and justifiable investigations. 3. Discuss the pathophysiology of kidney injuries and their clinical features. 4. Explain the principle of management of patients with kidney injuries. Use the following references: Davidson's principles and Practice of Medicine 24th Edition, Kumar and Clark Clinical Medicine 10th Edition, MacLeod's Clinical Examination 15th Edition, Harrison's principles of internal medicine 21st Edition, Nicholas J Talley O' Conner Clinical Examination 9th Edition, Malaysia Ministry of Heath Websites, and Malaysian Clinical Practice Guidelines.
Malaysia Ministry of Health clinical practice guidelines oedema CKD nephrotic syndrome 2024
oedema pathophysiology Starling forces capillary hydrostatic oncotic pressure diagram
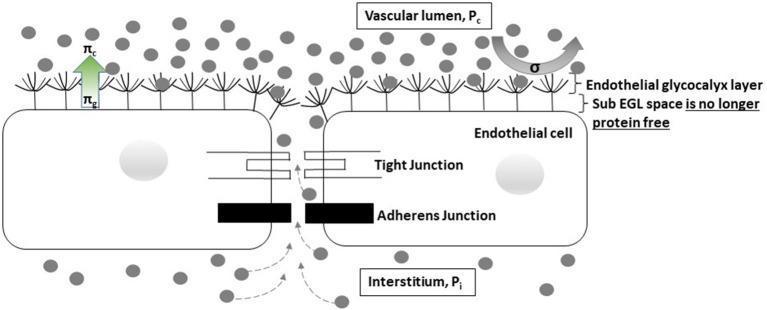
A pathophysiology diagram illustrating the Revised Starling Principle at the capillary-endothelial interface during profound shock. The illustration shows a cross-section of the vascular wall, featuring the vascular lumen (Pc), the endothelial glycocalyx layer (EGL), the sub-EGL space, and the interstitium (Pi). Key structural components include endothelial cells connected by tight and adherens junctions. The diagram highlights the loss of the protein-free status in the sub-EGL space, where proteins (represented by gray circles) diffuse from the interstitium through the inter-endothelial cleft back into the sub-EGL space. This movement indicates a transient reversal from filtration to reabsorption (autotransfusion). Pressures are annotated with arrows: πc represents capillary oncotic pressure and πg represents sub-glycocalyx oncotic pressure. The visual demonstrates how reduced hydrostatic pressure gradients (Pc ≈ Pi) in shock allow for protein accumulation in the sub-EGL, altering the effective oncotic pressure gradient that typically opposes filtration. This educational material is relevant for medical students and clinicians studying microcirculation, fluid dynamics, and critical care physiology.
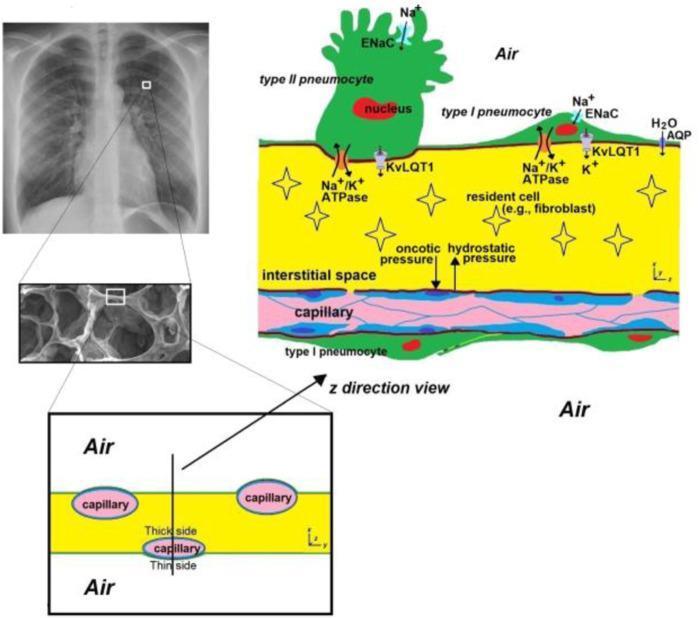
This composite educational graphic details the microanatomy of the human alveolar septa, combining a posterior-anterior chest radiograph, a microscopic view of lung parenchyma, and detailed pathophysiology schematics. The primary diagram illustrates the alveolar-capillary barrier, distinguishing between the 'thin side' optimized for gas exchange (where the epithelium and endothelium share a basal lamina) and the 'thick side' containing the interstitial space, extracellular matrix, and resident cells like fibroblasts. Key cellular components are depicted: cuboidal Type II pneumocytes with surfactant-secreting potential and thin, squamous Type I pneumocytes. The schematic identifies essential membrane proteins involved in fluid regulation and ion transport, including ENaC (sodium channels), Na+/K+ ATPase pumps, KvLQT1 (potassium channels), and AQP (aquaporins). Vectors demonstrate Starling forces, specifically oncotic and hydrostatic pressures, acting across the capillary wall. This visual is designed for advanced medical education in respiratory physiology, focusing on the structural heterogeneity of the alveolar wall and the mechanisms of fluid homeostasis and gas diffusion.
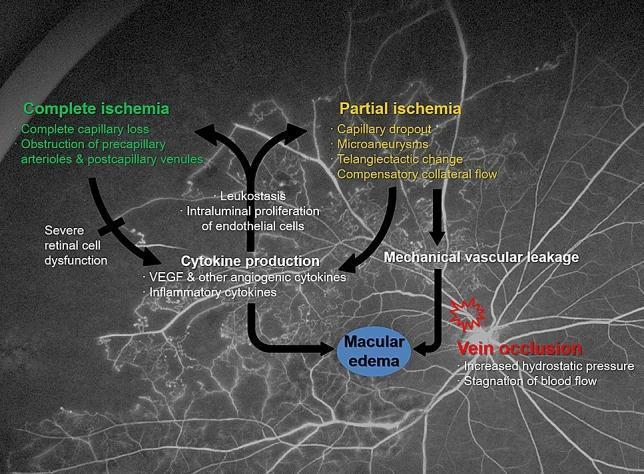
This medical schematic overlaid on an ultra-widefield fluorescein angiogram (FA) illustrates the pathophysiology of Macular Edema (ME) resulting from Branch Retinal Vein Occlusion (BRVO). The diagram categorizes the consequences of 'Vein occlusion' into mechanical and ischemic pathways. The mechanical pathway involves increased hydrostatic pressure and blood flow stagnation leading directly to 'Mechanical vascular leakage' and subsequent 'Macular edema'. The ischemic pathway distinguishes between 'Partial ischemia' (characterized by capillary dropout, microaneurysms, and telangiectactic change) and 'Complete ischemia' (characterized by complete capillary loss and vessel obstruction). Partial ischemia primarily drives 'Cytokine production'—including VEGF and inflammatory cytokines—which causes vascular hyperpermeability and ME. In contrast, complete ischemia leads to 'Severe retinal cell dysfunction', contributing less to cytokine production. A feedback loop is depicted where elevated cytokines promote 'Leukostasis' and 'Intraluminal proliferation of endothelial cells', potentially progressing partial ischemia into complete ischemia. The background FA demonstrates retinal vasculature with areas of hypofluorescence representing non-perfusion typical of occlusive retinopathy.
nephrotic syndrome pathophysiology diagram proteinuria hypoalbuminaemia
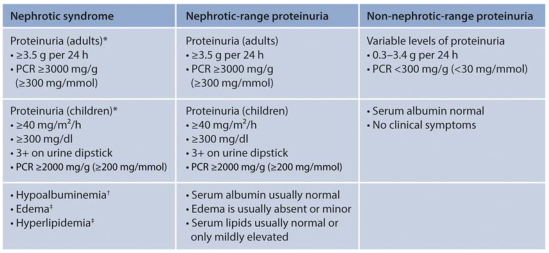
<table><thead><tr><th>Nephrotic syndrome</th><th>Nephrotic-range proteinuria</th><th>Non-nephrotic-range proteinuria</th></tr></thead><tbody><tr><td>Proteinuria (adults)*<br>• ≥3.5 g per 24 h<br>• PCR ≥3000 mg/g<br>(≥300 mg/mmol)</td><td>Proteinuria (adults)<br>• ≥3.5 g per 24 h<br>• PCR ≥3000 mg/g<br>(≥300 mg/mmol)</td><td>Variable levels of proteinuria<br>• 0.3–3.4 g per 24 h<br>• PCR <300 mg/g (<30 mg/mmol)</td></tr><tr><td>Proteinuria (children)*<br>• ≥40 mg/m²/h<br>• ≥300 mg/dl<br>• 3+ on urine dipstick<br>• PCR ≥2000 mg/g (≥200 mg/mmol)</td><td>Proteinuria (children)<br>• ≥40 mg/m²/h<br>• ≥300 mg/dl<br>• 3+ on urine dipstick<br>• PCR ≥2000 mg/g (≥200 mg/mmol)</td><td>• Serum albumin normal<br>• No clinical symptoms</td></tr><tr><td>• Hypoalbuminemia†<br>• Edema†<br>• Hyperlipidemia‡</td><td>• Serum albumin usually normal<br>• Edema is usually absent or minor<br>• Serum lipids usually normal or<br> only mildly elevated</td><td></td></tr></tbody></table>
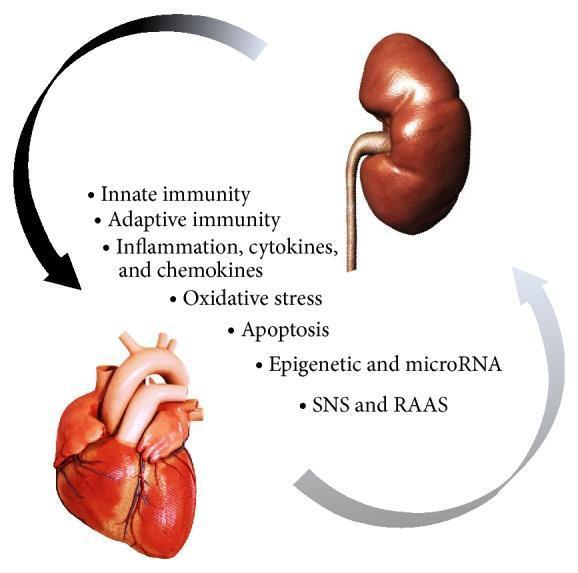
This pathophysiology diagram illustrates the bidirectional 'cardiorenal connectors' involved in cardiorenal syndrome type 3 (acute renocardiac syndrome). The visual features a human kidney positioned superiorly and a human heart positioned inferiorly. Two curved arrows create a circular flow between the organs: a primary dark arrow directed from the kidney to the heart, and a lighter return arrow from the heart to the kidney. Central to the diagram is a list of direct physiologic mechanisms that mediate organ crosstalk during acute kidney injury (AKI). These include innate and adaptive immunity; inflammation involving cytokines and chemokines; oxidative stress; cellular apoptosis; epigenetic factors and microRNA; and neurohormonal activation via the sympathetic nervous system (SNS) and the renin-angiotensin-aldosterone system (RAAS). The diagram is designed for intermediate to advanced medical education, emphasizing the multisystemic nature of renal-induced cardiac dysfunction.
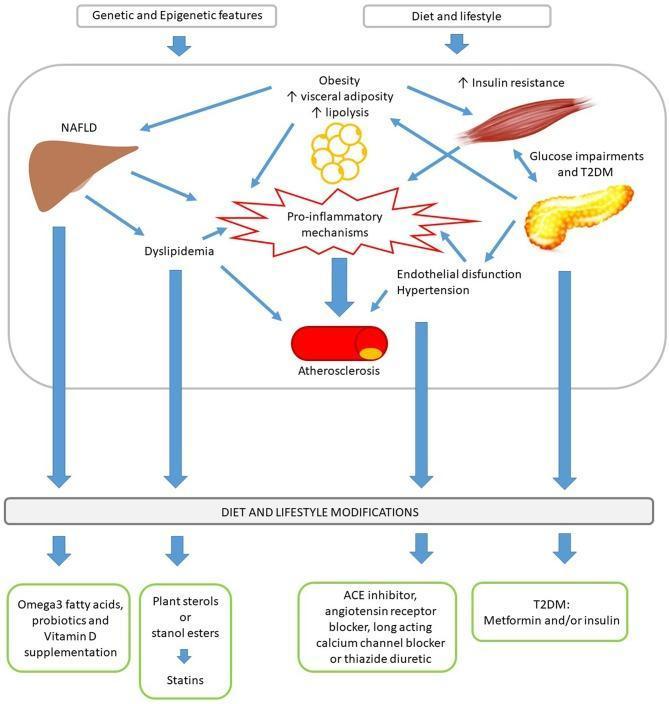
A medical pathophysiology diagram illustrating the pathomechanisms of Metabolic Syndrome (MetS) and corresponding therapeutic interventions. The upper section depicts a causal flowchart starting with 'Genetic and Epigenetic features' and 'Diet and lifestyle'. These factors lead to a complex interplay of clinical conditions including Non-alcoholic fatty liver disease (NAFLD), Obesity (increased visceral adiposity and lipolysis), Insulin resistance, Glucose impairments/Type 2 Diabetes Mellitus (T2DM), and Dyslipidemia. These conditions converge on a central 'Pro-inflammatory mechanisms' node, which triggers endothelial dysfunction, hypertension, and ultimately, atherosclerosis. The lower section of the diagram focuses on management strategies, centered on 'Diet and Lifestyle Modifications'. Targeted pharmacological and supplemental interventions are mapped to specific MetS components: Omega-3, probiotics, and Vitamin D for hepatic/metabolic support; plant sterols and statins for dyslipidemia; ACE inhibitors, ARBs, CCBs, or thiazide diuretics for hypertension; and metformin or insulin for T2DM. This educational illustration serves as a clinical algorithm for understanding cardiometabolic risk progression and multi-modal treatment approaches in pediatric and adult medicine.
acute kidney injury prerenal intrinsic postrenal categories diagram
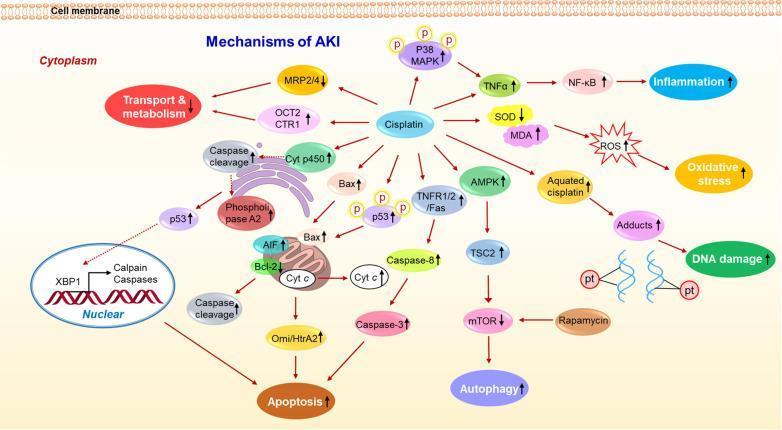
A comprehensive pathophysiology diagram detailing the molecular mechanisms of cisplatin-induced acute kidney injury (AKI) within a renal tubular cell. The schematic illustrates six primary pathological processes: Transport and Metabolism, Inflammation, Oxidative Stress, DNA Damage, Apoptosis, and Autophagy. Key entry points include cisplatin uptake via OCT2 and CTR1 transporters and its metabolic conversion to aquated cisplatin, which leads to DNA adduct formation. The inflammatory pathway shows activation of P38 MAPK, TNF-alpha, and NF-kB. Oxidative stress is represented by increased MDA and ROS alongside decreased SOD levels. Apoptosis is depicted through multiple pathways: intrinsic mitochondrial damage (Bax activation, Cytochrome c release), extrinsic signaling (TNFR1/2, Caspase-8), and nuclear damage involving p53 and XBP1. Autophagy is shown as being mediated by the AMPK/TSC2/mTOR pathway, influenced by Rapamycin. The diagram uses arrows to indicate stimulatory or inhibitory relationships and up/down icons to signify the relative change in protein expression or process activity, providing a detailed map of drug-induced nephrotoxicity.

This pathophysiology diagram consists of a mathematical graph and its corresponding equations, illustrating the relationship between kinetic Glomerular Filtration Rate (GFRK) and the rate of change in serum creatinine concentration (∂Crt/∂GFRK) during Acute Kidney Injury (AKI). The graph displays two curves, red and blue, positioned entirely in the fourth quadrant (negative y-values). This visualizes the physiological principle that creatinine concentration and GFR move in opposite directions. The x-axis represents GFRK (independent variable), and the y-axis represents the partial derivative ∂Crt/∂GFRK. The red curve reflects standard clinical parameters, while the blue curve represents more extreme clinical scenarios (e.g., higher initial creatinine of 9.0 mg/dL and altered fluid distribution volumes). Both curves demonstrate a steep negative slope at low GFRK values, which gradually flattens and approaches the x-axis as GFRK increases. This illustrates that the sensitivity of creatinine changes is significantly higher at low renal function levels, recapitulating patterns seen in chronic kidney disease within an acute clinical context.
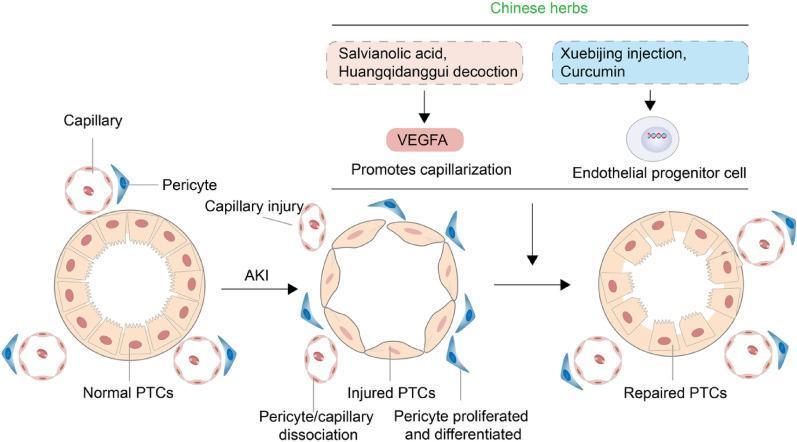
A pathophysiology diagram illustrating the progression of proximal tubular cell (PTC) morphology and vascular changes during Acute Kidney Injury (AKI) and subsequent repair mediated by Traditional Chinese Medicine (TCM). The diagram displays three states: 'Normal PTCs', 'Injured PTCs', and 'Repaired PTCs'. In the normal state, healthy cuboidal epithelial cells form the tubule, surrounded by intact capillaries and associated pericytes. Upon AKI, the PTCs flatten and thin, accompanied by capillary injury, pericyte-capillary dissociation, and pericyte proliferation/differentiation. The repair phase highlights two therapeutic pathways: 1) Salvianolic acid and Huangqidanggui decoction inducing VEGFA to promote capillarization, and 2) Xuebijing injection and Curcumin acting on endothelial progenitor cells. The final stage shows 'Repaired PTCs' where the tubular architecture is restored and capillary-pericyte density is increased. This diagram serves as an educational summary of renal vascular regeneration mechanisms and nephroprotective interventions.
pitting oedema clinical examination legs bilateral
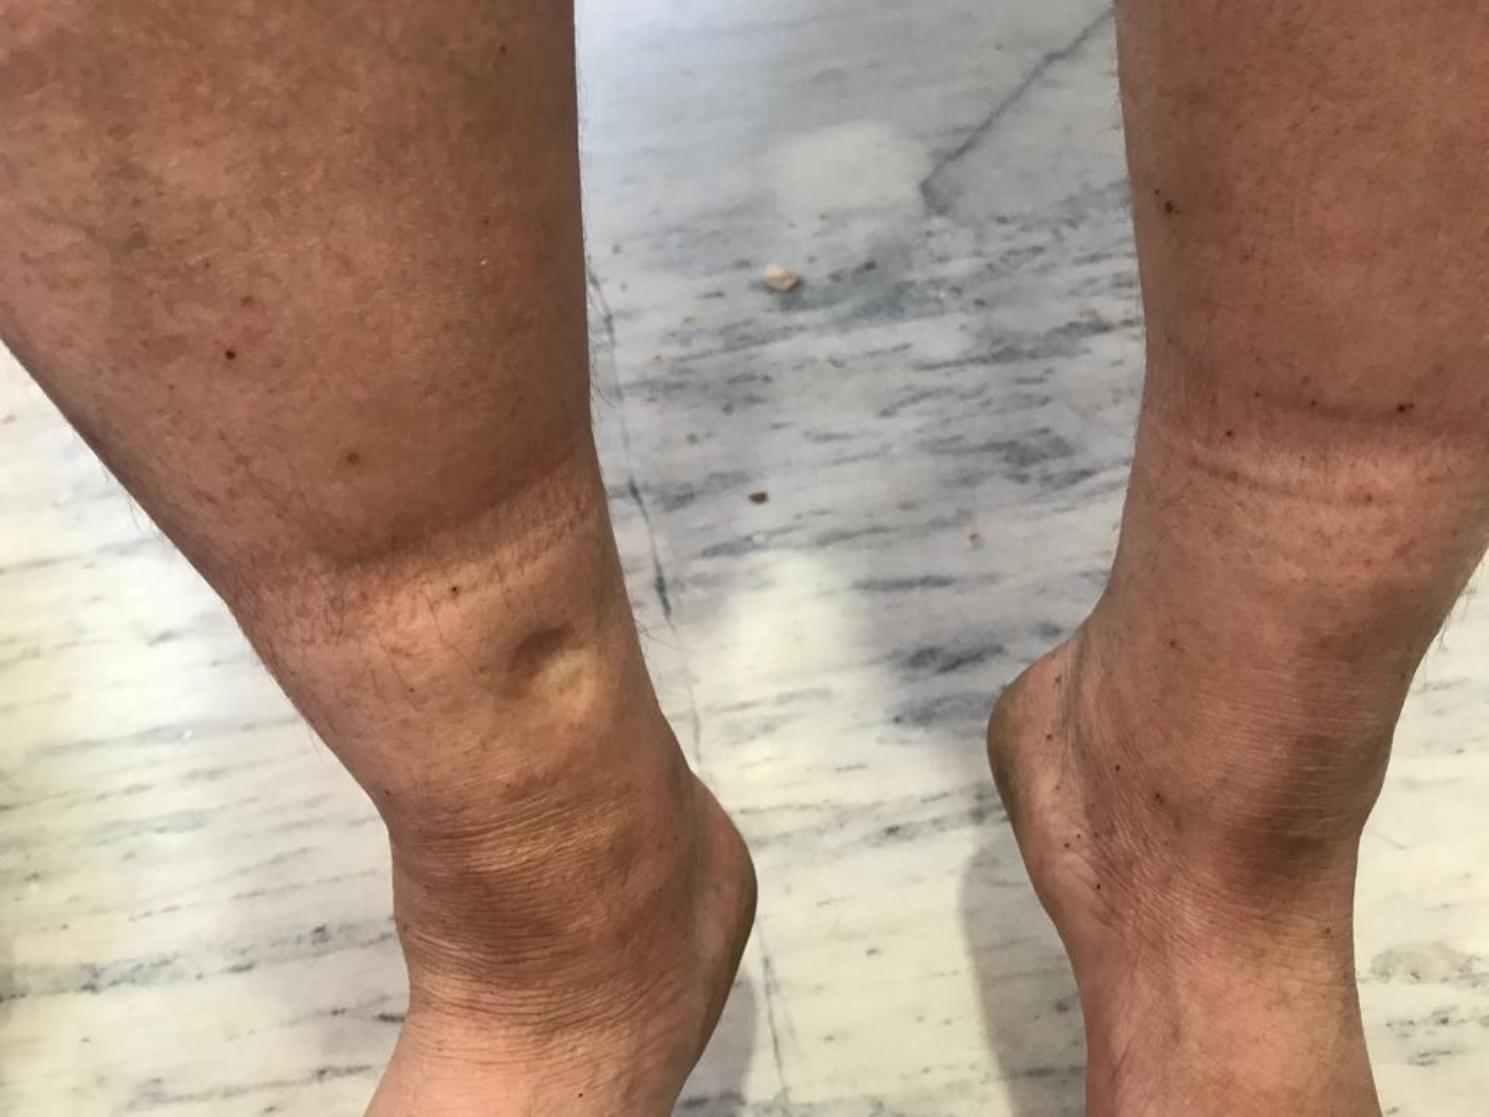
This clinical photograph displays bilateral pedal edema in the lower extremities. The image focuses on the distal legs and ankles, demonstrating significant swelling and tautness of the skin. A key diagnostic feature is visible on the anterior aspect of the lower leg, where a localized indentation or 'pit' remains after pressure was applied, characteristic of pitting edema. The skin shows slight discoloration with scattered hyperpigmented macules and a horizontal band of lighter pigmentation above the malleoli, possibly indicating chronic pressure from footwear or hosiery. The overall presentation is a classic clinical representation used in internal medicine and cardiology to illustrate fluid retention and systemic volume overload. The educational focus is on the assessment of peripheral edema and the visual identification of the 'pitting' sign in a clinical examination context.
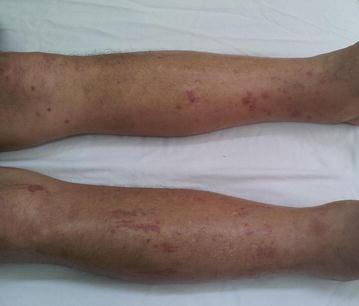
Clinical photograph of the bilateral lower limbs (shins and ankles) demonstrating prominent dermatological and systemic manifestations. The image shows significant generalized edema (oedema), characterized by increased limb girth and puffiness. Multiple cutaneous hemorrhagic lesions are visible across the anterior and lateral surfaces of both legs. These include numerous pinpoint, non-blanching red-to-purple spots consistent with petechiae, as well as larger, irregular, confluent patches of reddish-purple discoloration indicative of ecchymosis. The distribution is diffuse, extending from the ankles to the mid-calf. These clinical signs suggest vascular fragility, a coagulopathy, or systemic congestion, often associated with infectious processes such as CMV myocarditis or cardiac insufficiency. The visual evidence of petechiae and ecchymosis indicates intradermal and subcutaneous bleeding, while the limb swelling is consistent with high-grade pitting edema (++++/4+).
chronic kidney disease GFR staging KDIGO classification
![Summary : This flowchart outlines the diagnostic pathway for identifying and managing adults at risk for chronic kidney disease (CKD), including testing, staging, and follow-up actions based on glomerular filtration rate (GFR) and albumin-to-creatinine ratio (ACR) results.
flowchart:
# Nodes :
• Identify adults at risk for CKD (rounded rectangle, orange)
• Test for GFR* and ACR ± other markers of kidney damage† (rectangle, blue)
• GFR <60 ml/min per 1.73 m² or ACR ≥30 mg/g [3 mg/mmol] and/or other markers of kidney damage present (rectangle, blue)
• Test for GFR or ACR if not performed and exclude AKI/AKD (rectangle, blue)
• GFR <60 ml/min per 1.73 m² and/or ACR ≥30 mg/g [3 mg/mmol] after 3 months or earlier if evidence of chronicity (rectangle, green)
• Measure eGFRcr-cys if not performed and available (rectangle, green)
• Stage according to GFR and ACR; Establish underlying cause; Estimate risk of progression; Initiate treatment (rectangle, green)
• AKI/AKD present: follow AKI/AKD guidance (rectangle, purple)
• GFR ≥60 ml/min per 1.73 m² and ACR <30 mg/g [3 mg/mmol] and no other markers of kidney damage present (rectangle, orange)
• CKD not present; Timing of retesting based on individual characteristics such as risk of progression (rectangle, orange)
# Connectors :
• Downward arrows connect each step in the main diagnostic pathway.
• After initial testing, the flow splits into three branches:
– Left branch: If GFR <60 or ACR ≥30 after 3 months, proceed to measure eGFRcr-cys, then stage and treat.
– Middle branch: If AKI/AKD present, follow AKI/AKD guidance.
– Right branch: If GFR ≥60 and ACR <30, CKD not present; retesting timing based on risk.
• The rightmost branch loops back to the initial "Identify adults at risk for CKD" node, indicating ongoing risk assessment.
# Layout :
• Vertical flow from top to bottom, with a split into three horizontal branches after the "Test for GFR or ACR if not performed and exclude AKI/AKD" node.
• Colour coding: orange for risk identification and CKD not present, blue for testing steps, green for CKD confirmation and management, purple for AKI/AKD guidance.
# Analysis :
• The flowchart provides a clear, stepwise approach for CKD risk assessment, diagnosis, and management.
• It emphasises repeated testing and confirmation of chronicity before CKD diagnosis.
• The chart distinguishes between CKD, AKI/AKD, and non-CKD cases, guiding appropriate follow-up and treatment.
• Colour coding and branching facilitate rapid visual identification of decision points and outcomes.](https://cdn.orris.care/cdss_images/GLGCA_25092_1763331910246_51912e4f-b7fa-4ae5-8c67-18d086e7edca.png)
Summary : This flowchart outlines the diagnostic pathway for identifying and managing adults at risk for chronic kidney disease (CKD), including testing, staging, and follow-up actions based on glomerular filtration rate (GFR) and albumin-to-creatinine ratio (ACR) results. flowchart: # Nodes : • Identify adults at risk for CKD (rounded rectangle, orange) • Test for GFR* and ACR ± other markers of kidney damage† (rectangle, blue) • GFR <60 ml/min per 1.73 m² or ACR ≥30 mg/g [3 mg/mmol] and/or other markers of kidney damage present (rectangle, blue) • Test for GFR or ACR if not performed and exclude AKI/AKD (rectangle, blue) • GFR <60 ml/min per 1.73 m² and/or ACR ≥30 mg/g [3 mg/mmol] after 3 months or earlier if evidence of chronicity (rectangle, green) • Measure eGFRcr-cys if not performed and available (rectangle, green) • Stage according to GFR and ACR; Establish underlying cause; Estimate risk of progression; Initiate treatment (rectangle, green) • AKI/AKD present: follow AKI/AKD guidance (rectangle, purple) • GFR ≥60 ml/min per 1.73 m² and ACR <30 mg/g [3 mg/mmol] and no other markers of kidney damage present (rectangle, orange) • CKD not present; Timing of retesting based on individual characteristics such as risk of progression (rectangle, orange) # Connectors : • Downward arrows connect each step in the main diagnostic pathway. • After initial testing, the flow splits into three branches: – Left branch: If GFR <60 or ACR ≥30 after 3 months, proceed to measure eGFRcr-cys, then stage and treat. – Middle branch: If AKI/AKD present, follow AKI/AKD guidance. – Right branch: If GFR ≥60 and ACR <30, CKD not present; retesting timing based on risk. • The rightmost branch loops back to the initial "Identify adults at risk for CKD" node, indicating ongoing risk assessment. # Layout : • Vertical flow from top to bottom, with a split into three horizontal branches after the "Test for GFR or ACR if not performed and exclude AKI/AKD" node. • Colour coding: orange for risk identification and CKD not present, blue for testing steps, green for CKD confirmation and management, purple for AKI/AKD guidance. # Analysis : • The flowchart provides a clear, stepwise approach for CKD risk assessment, diagnosis, and management. • It emphasises repeated testing and confirmation of chronicity before CKD diagnosis. • The chart distinguishes between CKD, AKI/AKD, and non-CKD cases, guiding appropriate follow-up and treatment. • Colour coding and branching facilitate rapid visual identification of decision points and outcomes.

logo: Kidney Disease Improving Global Outcomes (KDIGO) Summary : This is the official logo for KDIGO, an organization focused on improving global outcomes for kidney disease. Logo Elements : • Central design features a stylized "K" and "DIGO" in bold blue letters. • The "K" is large and prominent, with "DIGO" integrated into its right side. • Background consists of a green globe with white latitude and longitude lines, symbolizing global reach. • Surrounding text in blue reads: "KIDNEY DISEASE IMPROVING GLOBAL OUTCOMES" in a circular arrangement. • A small blue dot precedes the top text. • Registered trademark symbol (®) appears to the right of "DIGO". Dimensions & Placement : • Circular logo with text forming the outer ring. • Central globe and lettering occupy the inner circle. Analysis : • The use of a globe and circular text emphasizes the organization's international scope and mission. • Blue and green color scheme suggests health, trust, and environmental awareness. • Bold, integrated lettering makes the acronym KDIGO highly visible and memorable.
heart failure congestive oedema mechanism RAAS renin angiotensin aldosterone
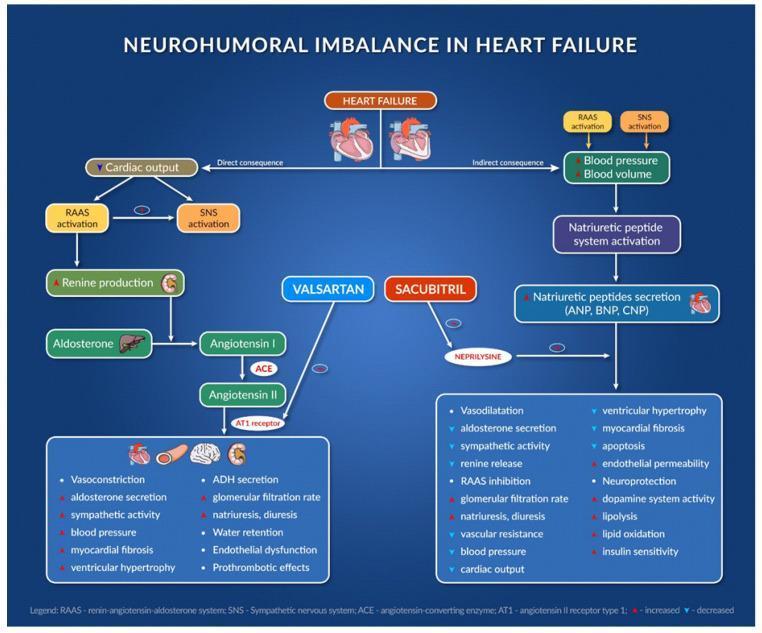
A complex pathophysiology diagram and pharmacological flowchart titled 'Neurohumoral Imbalance in Heart Failure'. It illustrates the interaction between the Renin-Angiotensin-Aldosterone System (RAAS), the Sympathetic Nervous System (SNS), and the Natriuretic Peptide (NP) system in the context of heart failure. The left side of the diagram outlines the RAAS cascade: Renin production leads to Angiotensin I, which is converted to Angiotensin II by ACE, ultimately binding to the AT1 receptor to cause deleterious effects like vasoconstriction, myocardial fibrosis, and water retention. The right side shows the NP system (ANP, BNP, CNP) which promotes diuresis and vasodilation. Centrally, the diagram depicts the pharmacological intervention of the ARNI class: Valsartan (an ARB) inhibiting the AT1 receptor, and Sacubitril (a neprilysin inhibitor) preventing the breakdown of natriuretic peptides. A comparison list at the bottom contrasts the pathological effects of uncontrolled RAAS/SNS activation against the beneficial physiological outcomes of ARNI therapy, including reduced ventricular hypertrophy, increased insulin sensitivity, and improved cardiac output. The diagram uses standard medical icons for the heart, kidneys, and liver to indicate anatomical sites of hormone production and action.
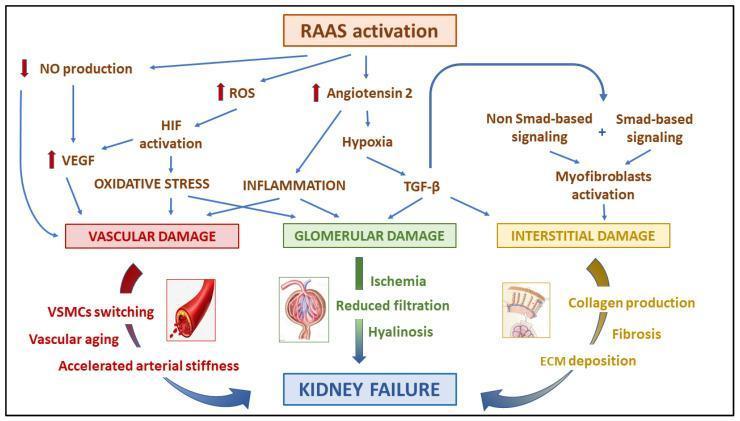
A pathophysiology diagram illustrating the non-hemodynamic pathways through which Renin-Angiotensin-Aldosterone System (RAAS) activation leads to kidney failure. The flow begins with RAAS activation triggering three primary branches: downregulation of NO production (increasing VEGF), elevation of Reactive Oxygen Species (ROS) leading to HIF activation and oxidative stress, and increased Angiotensin II causing hypoxia and inflammation. These intermediate molecular signals converge onto three distinct categories of renal injury: Vascular Damage, Glomerular Damage, and Interstitial Damage. Vascular Damage is characterized by VSMC phenotype switching, vascular aging, and accelerated arterial stiffness. Glomerular Damage results in ischemia, reduced filtration, and hyalinosis. Interstitial Damage is driven by TGF-beta signaling (both Smad and non-Smad-based), leading to myofibroblast activation, collagen production, ECM deposition, and fibrosis. Each pathway is visually represented by specific markers and simplified anatomical icons, ultimately converging at the terminal clinical outcome of 'Kidney Failure'. This diagram serves as a medical educational resource for understanding the complex molecular mechanisms of chronic kidney disease progression.
Approach to the Patient with Oedema
Nephrotic Syndrome | Heart Failure | Liver Disease | CKD
TLO 1 - Pathophysiology of Oedema
Definition
Starling Forces - The Fundamental Framework
| Force | Description | Effect on fluid movement |
|---|---|---|
| Pc - Capillary hydrostatic pressure | Pressure pushing fluid OUT of capillary | Promotes filtration |
| Pi - Interstitial hydrostatic pressure | Pressure in interstitium opposing filtration | Opposes filtration |
| πc - Capillary (plasma) oncotic pressure | Osmotic pull due to plasma proteins (mainly albumin) | Opposes filtration |
| πi - Interstitial oncotic pressure | Osmotic pull in interstitium | Promotes filtration |
| σ | Capillary reflection coefficient for proteins | Modulates oncotic gradient |
Mechanisms That Cause Oedema
1. Increased Capillary Hydrostatic Pressure (Pc ↑)
- Fluid is driven out of capillaries into the interstitium
- Causes: Heart failure (raised venous back-pressure), venous obstruction, renal sodium retention, pregnancy
- The raised hydrostatic pressure overwhelms reabsorption, leading to net filtration exceeding lymphatic drainage
2. Decreased Plasma Oncotic Pressure (πc ↓)
- Less osmotic force retaining fluid within vessels
- Causes: Hypoalbuminaemia (nephrotic syndrome, cirrhosis, malnutrition, protein-losing enteropathy)
- Albumin is the major contributor to plasma oncotic pressure (~80% of colloid osmotic pressure)
- When serum albumin falls below ~20-25 g/L, oncotic pressure is insufficient to prevent filtration
3. Increased Capillary Permeability
- Protein-rich fluid leaks out, increasing interstitial oncotic pressure (πi ↑) and reducing the effective oncotic gradient
- Causes: Inflammation, sepsis, anaphylaxis, burns, ARDS
- Results in non-pitting, protein-rich oedema (exudate)
4. Lymphatic Obstruction
- Normal lymphatics drain 2-4 litres/day from the interstitium
- When obstructed, protein-rich fluid accumulates
- Causes: Filariasis (elephantiasis), malignant infiltration of lymph nodes, post-surgical/radiation lymphoedema
- Results in lymphoedema - typically non-pitting with brawny skin changes
5. Renal Sodium and Water Retention (Primary)
- Kidney retains excess sodium independent of Starling forces
- Causes: Acute glomerulonephritis (reduced GFR + tubular sodium retention), CKD (reduced nephron mass)
- Expanded plasma volume raises capillary hydrostatic pressure
The Role of RAAS, SNS and ADH in Oedema Formation
↓ Cardiac output / ↓ Hepatic oncotic pressure / ↓ ECV
         ↓
Baroreceptor activation → ↑ Sympathetic Nervous System
         ↓
Renal afferent arteriole → ↑ Renin release
         ↓
Angiotensin I → ACE → Angiotensin II
         ↓                    ↓
  Vasoconstriction     Aldosterone release (adrenal cortex)
         ↓                    ↓
   ↑ Renal perfusion   Na⁺ retention (collecting duct)
         ↓
ADH (AVP) release → ↑ Water reabsorption (AQP2)
         ↓
Expanded extracellular volume → Oedema perpetuation
Pathophysiology in Specific Conditions
Nephrotic Syndrome
- Glomerular basement membrane damage → massive proteinuria (>3.5 g/24h in adults)
- Protein losses exceed hepatic synthesis capacity → hypoalbuminaemia (serum albumin <25 g/L)
- Reduced plasma oncotic pressure (πc ↓)
- Fluid shifts from intravascular to interstitial compartment
- Perceived ↓ ECV → activates RAAS + ADH → renal Na⁺ and water retention → worsening oedema
- Sodium retention occurs primarily at the kidney level (collecting duct), INDEPENDENT of RAAS activation
- Evidence: some nephrotic patients have expanded, not contracted, plasma volume
- Both mechanisms likely coexist
Heart Failure
- ↓ Cardiac output → ↓ renal perfusion
- Activates RAAS → aldosterone → Na⁺ retention
- ↑ Sympathetic tone → ↑ ADH → water retention
- Raised systemic venous pressure (right heart failure) → ↑ capillary hydrostatic pressure (Pc ↑)
- Fluid moves into interstitium → dependent pitting oedema (ankle/leg), ascites, pleural effusion (right > left)
- In left heart failure → raised pulmonary venous pressure → pulmonary oedema
Liver Cirrhosis (Chronic Liver Disease)
- Reduced hepatic albumin synthesis → hypoalbuminaemia → ↓ oncotic pressure
- Portal hypertension → ↑ splanchnic capillary hydrostatic pressure → ascites (dominant)
- Peripheral arterial vasodilatation (from portal hypertension) → perceived ↓ ECV → RAAS activation → Na⁺ and water retention
- Impaired aldosterone metabolism by damaged liver → hyperaldosteronism
- Raised hepatic lymph production exceeds thoracic duct capacity
CKD (Chronic Kidney Disease)
- Progressive loss of nephron mass → reduced GFR → inability to excrete Na⁺ and water
- Na⁺ and water retention directly expands extracellular volume
- Hypertension (common) further raises capillary hydrostatic pressure
- Hypoalbuminaemia may co-exist if proteinuria is significant (e.g., diabetic nephropathy)
- Anaemia (reduced erythropoietin) does not directly cause oedema but contributes to cardiac dysfunction
TLO 2 - Clinical Approach to the Patient with Oedema
History Taking (Systematic)
Onset and Distribution
- Acute vs chronic (sudden = DVT/anaphylaxis; gradual = systemic disease)
- Symmetrical/bilateral = systemic (heart failure, nephrotic, liver disease, CKD)
- Asymmetrical/unilateral = local cause (DVT, cellulitis, lymphoedema, venous insufficiency)
- Dependent oedema (worsens through the day, better in morning) = cardiac or venous
- Periorbital/facial oedema (worse in morning) = nephrotic syndrome
- Ascites + oedema = liver disease, right heart failure, nephrotic syndrome
Associated Symptoms
| Symptom | Suggests |
|---|---|
| Orthopnoea, PND, exertional dyspnoea | Heart failure |
| Frothy urine, haematuria | Nephrotic/nephritic syndrome |
| Jaundice, alcohol use, abdominal distension | Liver disease |
| Nocturia, polyuria, haematuria | CKD / glomerulonephritis |
| Pruritus, fatigue, loss of appetite | CKD (uraemia) |
| Palpitations, leg claudication | Cardiovascular disease |
| Weight gain | All systemic causes of oedema |
Past Medical History
- Diabetes mellitus, hypertension (major causes of CKD)
- Previous heart disease (IHD, rheumatic fever, cardiomyopathy)
- Liver disease (cirrhosis, hepatitis B/C - particularly relevant in Malaysia)
- Previous UTI, glomerulonephritis, kidney stones
- Malignancy (lymph node obstruction, hypoalbuminaemia)
Drug History
- Drugs causing oedema: Calcium channel blockers (amlodipine - common), NSAIDs (sodium retention), corticosteroids, thiazolidinediones, fludrocortisone, oestrogens, minoxidil
- Drugs causing renal injury: NSAIDs, aminoglycosides, contrast media, ACE inhibitors (in bilateral RAS)
Social History
- Alcohol use (liver disease)
- Diet (high salt, low protein)
- Travel history (filariasis, endemic infections - important in Malaysia)
- Occupational exposure (nephrotoxins)
Physical Examination
General Inspection
- Weight, BMI - fluid overload
- Pallor (anaemia of CKD), jaundice (liver disease), periorbital puffiness (nephrotic)
- Respiratory distress (pulmonary oedema)
Assessment of Oedema
| Grade | Description |
|---|---|
| 1+ | Mild pitting, 2mm depth, recoils in <2 seconds |
| 2+ | Moderate pitting, 4mm depth, recoils in 2-4 seconds |
| 3+ | Deep pitting, 6mm depth, recoils in 4-20 seconds |
| 4+ | Very deep pitting, 8mm depth, >20 seconds to recoil |
- Ankles/dorsum of feet (ambulant patients)
- Sacrum and posterior thighs (bed-bound patients)
- Periorbital region (nephrotic syndrome)
- Scrotum/labia (severe generalised oedema = anasarca)
- Ascites (flank dullness, shifting dullness, fluid thrill)
- Pleural effusion (stony dull percussion, reduced breath sounds at base)
- Pitting: Leaves a temporary indentation - transudate (low protein) - heart failure, hypoalbuminaemia, CKD
- Non-pitting: No indentation - lymphoedema, myxoedema (hypothyroidism), lipodema
Cardiovascular Examination
- JVP elevated (right heart failure, pericardial disease, SVC obstruction)
- Apex beat displaced (cardiomegaly in dilated cardiomyopathy)
- S3 gallop, murmurs
- Blood pressure (hypertension in CKD, heart failure)
Respiratory Examination
- Fine bibasal crackles (pulmonary oedema)
- Stony dullness at bases (pleural effusion)
Abdominal Examination
- Hepatomegaly (right heart failure, hepatic congestion)
- Splenomegaly (portal hypertension)
- Caput medusae, spider naevi, gynaecomastia, palmar erythema (liver disease)
- Ascites assessment
- Palpable kidneys (polycystic kidney disease)
Skin
- Xanthelasma, lipid deposits (nephrotic hyperlipidaemia)
- Purpura (vasculitis causing glomerulonephritis)
- Scratch marks (uraemic pruritus in CKD)
- Uraemic frost (severe CKD - rare)
Differential Diagnosis of Oedema
Generalised (Bilateral/Systemic) Oedema
| Condition | Key Features |
|---|---|
| Congestive Heart Failure | JVP ↑, S3, bibasal crackles, orthopnoea, hepatomegaly |
| Nephrotic Syndrome | Periorbital oedema, frothy urine, massive proteinuria, hypoalbuminaemia |
| Liver Cirrhosis | Ascites >oedema, jaundice, splenomegaly, portal hypertension signs |
| CKD | Hypertension, uraemic symptoms, hx of DM/HTN, ↓ urine output |
| Hypothyroidism | Non-pitting, dry skin, bradycardia, cold intolerance |
| Malnutrition | Hypoalbuminaemia, thin patient, dietary history |
| Drug-induced | Temporal relation to drug (e.g., amlodipine) |
| Pregnancy | Physiological; pathological if pre-eclampsia (HTN + proteinuria) |
| Protein-losing enteropathy | Hypoalbuminaemia, no proteinuria, GI symptoms |
Localised (Unilateral) Oedema
| Condition | Key Features |
|---|---|
| DVT | Unilateral calf swelling, warmth, tenderness, positive Homan's sign (low sensitivity) |
| Cellulitis | Erythema, warmth, tenderness, fever |
| Lymphoedema | Non-pitting, brawny, Stemmer's sign positive |
| Venous insufficiency | Varicosities, haemosiderin, lipodermatosclerosis |
| Ruptured Baker's cyst | Posterior knee pain, ecchymosis |
Investigations
Bedside / First-line
- Urine dipstick: Proteinuria (3+ = nephrotic range), haematuria (glomerulonephritis), glucose (DM)
- Urine microscopy: Red cell casts (nephritic), waxy casts (nephrotic/CKD)
- Spot urine protein:creatinine ratio (PCR): >300 mg/mmol (>3000 mg/g) = nephrotic range
- 12-lead ECG: LVH (hypertensive heart disease), ischaemia (IHD-related heart failure), arrhythmia
- Chest X-ray: Cardiomegaly, pulmonary oedema (bat-wing pattern), pleural effusion, Kerley B lines
Blood Tests
| Test | Purpose |
|---|---|
| FBC | Anaemia (CKD - normocytic normochromic; haematuria), infection |
| Urea and electrolytes (U&E) | Serum creatinine, BUN - renal function; electrolyte disturbance |
| eGFR | Staging of CKD (KDIGO stages) |
| Serum albumin | <25 g/L = severe hypoalbuminaemia (nephrotic, liver, malnutrition) |
| Serum protein electrophoresis | Multiple myeloma, amyloidosis |
| Liver function tests (LFTs) | ALT, AST, ALP, bilirubin, GGT, INR/PT (hepatic synthetic function) |
| Lipid profile | Hyperlipidaemia in nephrotic syndrome (hepatic compensation for low albumin) |
| Thyroid function (TFT) | Exclude hypothyroidism |
| Serum glucose / HbA1c | DM (major cause of CKD and nephrotic syndrome) |
| BNP / NT-proBNP | Elevated in heart failure (>400 pg/mL BNP suggests HF) |
| Complement (C3, C4) | ↓ in lupus nephritis, MPGN, post-streptococcal GN |
| ANA, anti-dsDNA, ANCA | Autoimmune GN (lupus nephritis, vasculitis) |
| HBsAg, anti-HCV | Hepatitis B/C (causes both liver disease and GN - important in Malaysia) |
| Serum iron, ferritin, TIBC | Iron deficiency in CKD, baseline before ESA |
| PTH, calcium, phosphate | CKD-MBD (mineral bone disorder in CKD) |
Imaging
| Investigation | Indication | Findings |
|---|---|---|
| Renal ultrasound | First-line for kidney imaging | CKD: small echogenic kidneys; obstruction: hydronephrosis |
| Echocardiography | Heart failure assessment | EF, wall motion, valvular disease, pericardial effusion |
| Doppler USS lower limbs | DVT | Non-compressibility of vein |
| Abdominal USS | Liver, portal hypertension | Cirrhosis, splenomegaly, ascites |
| CT abdomen/pelvis | Malignancy, lymph nodes, obstructive uropathy |
Histological
- Renal biopsy: Indicated when glomerulonephritis/nephrotic syndrome of unknown cause; minimal change disease (MCD), focal segmental glomerulosclerosis (FSGS), membranous nephropathy, IgA nephropathy
- Liver biopsy: Grading/staging of cirrhosis
TLO 3 - Pathophysiology of Kidney Injuries and Clinical Features
Acute Kidney Injury (AKI)
Definition (KDIGO 2012)
- Rise in serum creatinine ≥26.5 µmol/L (0.3 mg/dL) within 48 hours, OR
- Rise in serum creatinine to ≥1.5× baseline within 7 days, OR
- Urine output <0.5 mL/kg/h for ≥6 consecutive hours
KDIGO AKI Staging
| Stage | Serum Creatinine | Urine Output |
|---|---|---|
| 1 | 1.5-1.9× baseline OR ↑ ≥26.5 µmol/L | <0.5 mL/kg/h for 6-12h |
| 2 | 2.0-2.9× baseline | <0.5 mL/kg/h for ≥12h |
| 3 | ≥3× baseline OR ≥354 µmol/L OR RRT initiated | <0.3 mL/kg/h for ≥24h OR anuria ≥12h |
Classification of AKI: Pre-renal, Intrinsic, Post-renal
1. Pre-renal AKI (most common ~60-70%)
- Decreased renal perfusion pressure - kidney is structurally normal but underperfused
- GFR falls because of inadequate glomerular hydrostatic pressure
- Compensatory mechanisms: RAAS activation, ADH release, renal autoregulation
- Hypovolaemia: haemorrhage, vomiting, diarrhoea, burns, third-spacing
- Impaired cardiac output: heart failure, MI, pericardial tamponade, massive PE
- Vasodilatation: sepsis, anaphylaxis, antihypertensives (relative)
- Effective circulating volume depletion: hepatorenal syndrome (HRS), nephrotic syndrome
- Renin → angiotensin II → efferent arteriole constriction → maintains GFR
- Natriuresis stops → urinary Na⁺ <20 mmol/L (avid Na⁺ conservation)
- Urine osmolality >500 mOsm/kg (concentrated urine)
- BUN:creatinine ratio >20:1
| Parameter | Pre-renal | ATN (Intrinsic) |
|---|---|---|
| Urine Na⁺ | <20 mmol/L | >40 mmol/L |
| Fractional excretion of Na⁺ (FENa) | <1% | >2% |
| Urine osmolality | >500 mOsm/kg | <350 mOsm/kg |
| Urine:plasma creatinine ratio | >40 | <20 |
| BUN:Cr ratio | >20 | 10-15 |
| Urine sediment | Normal/hyaline casts | Granular/muddy brown casts (ATN) |
2. Intrinsic (Renal) AKI
- Ischaemic ATN: Prolonged prerenal → ischaemia of tubular cells (especially proximal tubule and thick ascending limb - highly metabolically active, poorly perfused)
- Nephrotoxic ATN: Direct tubular cell toxicity
- Exogenous: aminoglycosides (gentamicin), amphotericin B, cisplatin, IV contrast agents, NSAIDs
- Endogenous: myoglobin (rhabdomyolysis), haemoglobin (haemolysis), uric acid (tumour lysis), myeloma light chains
- Loss of tubular cell polarity and brush border
- Disruption of tubular epithelial integrity - cells slough into lumen
- Obstruction of tubular lumen by casts (debris)
- Back-leak of glomerular filtrate through damaged tubular epithelium
- Reduced GFR + impaired tubular concentration ability
| Phase | Duration | Features |
|---|---|---|
| Initiation | Hours-1 day | Injury begins, GFR falling |
| Maintenance (oliguric) | 1-3 weeks | Oliguria/anuria, uraemia, hyperkalaemia, metabolic acidosis |
| Recovery (diuretic) | Days-weeks | Polyuria (tubular function recovers slowly), risk of hypovolaemia/electrolyte loss |
- Rapidly progressive (crescentic) glomerulonephritis (RPGN)
- Anti-GBM disease (Goodpasture syndrome)
- ANCA-associated vasculitis (GPA, MPA)
- Lupus nephritis (class III/IV)
- Post-streptococcal GN (common in Malaysian children)
- Haematuria (red cell casts - pathognomonic)
- Proteinuria (sub-nephrotic, <3.5g/24h usually)
- Hypertension
- Oliguria
- Oedema (sodium retention)
- Thrombotic microangiopathy (HUS, TTP)
- Renal artery thrombosis/embolism
- Malignant hypertension
- Scleroderma renal crisis
- Most commonly drug-induced (NSAIDs, penicillins, cephalosporins, proton pump inhibitors, allopurinol)
- Immune-mediated inflammation of tubules and interstitium
- Features: fever, rash, eosinophilia (classic triad present in only 10-15%)
- Urine: sterile pyuria, eosinophiluria, WBC casts
3. Post-renal AKI (Obstructive - ~5-10%)
- Obstruction anywhere from renal pelvis to urethra
- Back-pressure transmitted to Bowman's space → opposes filtration → ↓ GFR
- Must be bilateral (or unilateral in a single functioning kidney) to cause AKI
| Level | Cause |
|---|---|
| Urethra | Stricture, meatal stenosis |
| Bladder neck | Benign prostatic hyperplasia (BPH) - MOST COMMON in elderly men |
| Bladder | Carcinoma, blood clot |
| Ureter (bilateral) | Retroperitoneal fibrosis, pelvic malignancy, bilateral stones |
| Renal pelvis (bilateral) | Bilateral PUJ obstruction, bilateral calculi |
Chronic Kidney Disease (CKD)
Definition
- eGFR <60 mL/min/1.73 m²
- Albuminuria/proteinuria
- Urine sediment abnormalities
- Electrolyte abnormalities due to tubular disorders
- Structural abnormalities on imaging
- History of kidney transplantation
Staging (KDIGO 2012 - GFR Categories)
| Stage | GFR (mL/min/1.73m²) | Description |
|---|---|---|
| G1 | ≥90 | Normal or high GFR with kidney damage markers |
| G2 | 60-89 | Mildly decreased |
| G3a | 45-59 | Mildly to moderately decreased |
| G3b | 30-44 | Moderately to severely decreased |
| G4 | 15-29 | Severely decreased |
| G5 | <15 | Kidney failure (dialysis or transplant) |
- A1: <30 mg/g (normal to mildly increased)
- A2: 30-300 mg/g (moderately increased)
- A3: >300 mg/g (severely increased)
Causes of CKD (Malaysian context)
- Diabetic nephropathy - #1 cause worldwide and in Malaysia (~35-40%)
- Hypertensive nephrosclerosis - #2 cause (~25%)
- Glomerulonephritis (primary: IgA nephropathy, FSGS; secondary: lupus)
- Polycystic kidney disease (ADPKD)
- Chronic pyelonephritis / reflux nephropathy
- Obstructive nephropathy (BPH, calculi)
- Renovascular disease
Pathophysiology of CKD Progression
- Surviving nephrons undergo adaptive hyperfiltration and hypertrophy to compensate for nephron loss
- Initially maintains GFR near normal
- Over time: hyperfiltration damages remaining nephrons → further nephron loss → progressive decline
- Intraglomerular hypertension → mesangial expansion → glomerulosclerosis (FSGS pattern)
- TGF-β activation → profibrotic signalling → interstitial fibrosis → tubular atrophy
- Proteinuria itself is nephrotoxic → proximal tubular endocytosis → lysosomal rupture → inflammation
- RAAS activation → angiotensin II → fibrosis, hypertension, progressive damage
- Oxidative stress and chronic inflammation perpetuate injury
Clinical Features of CKD (by system)
Uraemic Syndrome (GFR <15-20%)
| System | Features |
|---|---|
| General | Fatigue, malaise, anorexia, weight loss, nocturia |
| CNS | Lethargy, confusion, seizures (uraemic encephalopathy), peripheral neuropathy (glove-stocking) |
| CVS | Hypertension (fluid overload + RAAS), pericarditis (fibrinous - "friction rub"), accelerated atherosclerosis, LVH |
| Haematological | Normocytic normochromic anaemia (↓ EPO production), bleeding tendency (platelet dysfunction), easy bruising |
| GIT | Anorexia, nausea, vomiting, uraemic fetor (urea → ammonia), hiccough, peptic ulcers (↑ gastrin) |
| Skin | Sallow/yellow-grey complexion (uraemic pigmentation), pruritus (phosphate deposits), uraemic frost (severe), purpura |
| Musculoskeletal | Renal osteodystrophy (see CKD-MBD below), muscle weakness, restless legs |
| Metabolic | Metabolic acidosis (↓ acid excretion), hyperkalaemia, hyponatraemia, hyperphosphataemia, hypocalcaemia |
| Endocrine | Impaired glucose tolerance, hypogonadism, amenorrhoea |
| Fluid | Oedema, hypertension, fluid overload |
CKD-Mineral Bone Disorder (CKD-MBD)
- ↓ GFR → ↓ phosphate excretion → hyperphosphataemia
- ↓ renal 1α-hydroxylase → ↓ active vitamin D (calcitriol) → ↓ calcium absorption → hypocalcaemia
- Hypocalcaemia + hyperphosphataemia → stimulates PTH release → secondary hyperparathyroidism
- PTH: mobilises Ca from bone → renal osteodystrophy (osteitis fibrosa cystica, osteomalacia, mixed)
- Vascular calcification (phosphate + Ca deposits) → cardiovascular mortality
CKD Anaemia
- Reduced renal EPO production (peritubular fibroblasts in renal cortex)
- Reduced RBC survival
- Iron deficiency (reduced absorption, blood loss from dialysis)
- Target: Hb 100-120 g/L with ESA (erythropoiesis-stimulating agents) therapy
TLO 4 - Principles of Management
Management of AKI
General Principles
- Full history + examination
- Urine output monitoring (catheterise if anuric/oliguric)
- Identify prerenal, intrinsic, or obstructive
- Identify nephrotoxins - STOP NSAIDs, ACE inhibitors, ARBs, diuretics, aminoglycosides, contrast
- Daily U&E, creatinine, eGFR
- Electrolytes: K⁺ (hyperkalaemia), bicarbonate (acidosis), calcium, phosphate
- Urine microscopy and PCR
- Regular fluid balance charts, weight, BP
- Prerenal: IV fluid resuscitation (0.9% NaCl or Hartmann's), treat underlying cause (sepsis, haemorrhage)
- Postrenal: Urinary catheterisation (bladder outlet obstruction), nephrostomy or ureteric stent (ureteric obstruction)
- Sepsis-related AKI: IV antibiotics, fluid resuscitation, source control
| Letter | Indication |
|---|---|
| A | Acidosis (severe metabolic acidosis pH <7.1 not responsive to treatment) |
| E | Electrolyte: hyperkalaemia refractory to medical treatment |
| I | Intoxication (dialysable drugs/toxins - aspirin, methanol, lithium) |
| O | Overload (fluid overload resistant to diuretics) |
| U | Uraemia (uraemic symptoms: pericarditis, encephalopathy, bleeding >300 µmol/L) |
- CRRT (Continuous RRT): Haemofiltration - preferred in haemodynamically unstable ICU patients
- IHD (Intermittent haemodialysis): Haemodynamically stable patients
- Peritoneal dialysis: Less common for AKI
- Cardiac protection: IV calcium gluconate 10% 10 mL over 5-10 min (stabilises myocardial membrane) - immediate
- Drive K⁺ into cells: IV insulin (10 units actrapid) + 50 mL 50% dextrose; IV sodium bicarbonate (if acidosis); salbutamol nebuliser
- Remove K⁺ from body: Furosemide (if urine output); calcium resonium (resin); dialysis (definitive)
- Monitor ECG: Peaked T waves → widened QRS → sine wave → VF
Management of Nephrotic Syndrome
General Measures
- Low-salt diet (<2g Na/day) - reduces oedema
- Fluid restriction in hyponatraemia
- Regular weight monitoring
- Avoid nephrotoxins (NSAIDs)
Treatment of Oedema
- Diuretics: Loop diuretics (furosemide) - first-line; combination with thiazide (metolazone) in resistant oedema
- Note: In severe hypoalbuminaemia, drug binding to albumin is reduced; IV furosemide may be needed
- Salt-poor albumin infusions + furosemide (controversial, short-lived benefit)
Specific Treatment (by cause)
| Cause | Treatment |
|---|---|
| Minimal Change Disease (MCD) | Prednisolone 1 mg/kg/day × 8 weeks then taper (>90% remission in children) |
| FSGS | Prednisolone ± calcineurin inhibitors (ciclosporin, tacrolimus) |
| Membranous Nephropathy | Watch & wait (if low risk); steroids + chlorambucil/cyclophosphamide (Ponticelli) or rituximab |
| Lupus Nephritis (class III/IV) | High-dose steroids + MMF or cyclophosphamide (induction); MMF (maintenance) |
| Diabetic Nephropathy | SGLT-2 inhibitors (empagliflozin, dapagliflozin), ACE/ARB, tight glycaemic control |
Complications Management
- Thromboembolism: Prophylactic anticoagulation if albumin <20 g/L or high-risk features (antithrombin III lost in urine)
- Hyperlipidaemia: Statins (cardiovascular risk reduction)
- Infection: Pneumococcal vaccine (loss of immunoglobulins), avoid live vaccines on immunosuppression; treat infections promptly (peritonitis risk)
- ACE inhibitor/ARB: Reduces proteinuria (reducing intraglomerular pressure), even without hypertension
Management of Heart Failure-related Oedema
Principles
- Treat underlying cause (ischaemia, valve disease, arrhythmia)
- Reduce fluid overload
- Improve cardiac output
- Prevent neurohormonal remodelling
Drug Treatment (HFrEF - EF <40%)
| Drug | Mechanism | Evidence |
|---|---|---|
| ACE inhibitor/ARB | Blocks angiotensin II → ↓ vasoconstriction, ↓ aldosterone, ↓ remodelling | Reduces mortality |
| Beta-blocker (carvedilol, bisoprolol) | ↓ SNS activity, ↓ HR, anti-remodelling | Reduces mortality |
| Spironolactone/eplerenone | Aldosterone antagonist → ↓ Na⁺ retention, anti-fibrotic | Reduces mortality |
| SGLT-2 inhibitors (dapagliflozin, empagliflozin) | Osmotic diuresis, reduces preload, cardioprotective | Reduces hospitalisation + mortality |
| ARNI (sacubitril/valsartan) | ↑ natriuretic peptides + blocks AT1R | Superior to ACE inhibitor alone (PARADIGM-HF) |
| Furosemide (loop diuretic) | Symptom relief, reduces congestion | Symptom control (no mortality benefit) |
| Digoxin | ↑ contractility, rate control in AF | Reduces hospitalisation |
Management of Liver Disease Oedema (Ascites)
Stepwise Approach (EASL Guidelines)
- Salt restriction (<2g/day) - important first step
- Spironolactone 100 mg/day (↑ to 400 mg) - anti-aldosterone, effective in hepatic ascites
- Furosemide 40 mg/day (↑ to 160 mg) - add-on; maintain spironolactone:furosemide ratio 100:40
- Therapeutic paracentesis (large-volume): for tense ascites - drain 5-6L, give albumin 8g/L ascites removed (prevents circulatory dysfunction)
- TIPS (Transjugular intrahepatic portosystemic shunt): For refractory ascites
- Liver transplantation: Definitive treatment for end-stage liver disease
Spontaneous Bacterial Peritonitis (SBP)
- Common life-threatening complication in cirrhotic ascites
- PMN >250 cells/mm³ in ascitic fluid = diagnostic
- Treatment: Cefotaxime 2g IV 8-hourly × 5 days + IV albumin (1.5g/kg day 1, 1g/kg day 3 - reduces HRS risk)
Management of CKD
Slowing CKD Progression
| Intervention | Target / Drug | Evidence |
|---|---|---|
| BP control | Target <130/80 mmHg | Reduces progression |
| Proteinuria reduction | ACE inhibitor or ARB (first-line) | Reduces intraglomerular pressure, anti-fibrotic |
| SGLT-2 inhibitors | Dapagliflozin, empagliflozin | Reduces GFR decline and cardiovascular events (DAPA-CKD, CREDENCE trials) |
| Glycaemic control in DM | HbA1c <53 mmol/mol (~7%) | Prevents progression |
| Lifestyle | Low-salt diet, avoid NSAIDs, smoking cessation, weight loss | |
| Avoid nephrotoxins | NSAIDs, nephrotoxic antibiotics, IV contrast (with pre-hydration) |
Managing CKD Complications
| Complication | Management |
|---|---|
| Hypertension | ACE inhibitor/ARB; amlodipine; furosemide (if fluid overload) |
| Anaemia | Iron supplementation (IV iron if ferritin <500); ESA (EPO analogues - darbepoetin alfa); target Hb 100-120 g/L |
| CKD-MBD | Low-phosphate diet; phosphate binders (sevelamer, calcium carbonate); calcitriol/alfacalcidol (active Vit D); cinacalcet (calcimimetic) for secondary HPT |
| Metabolic acidosis | Oral sodium bicarbonate (target HCO₃ >22 mmol/L); slows progression |
| Hyperkalaemia | Dietary K⁺ restriction (<2g/day); avoid NSAIDs/RAAS in severe CKD; patiromer/sodium zirconium cyclosilicate (newer K⁺ binders); dialysis |
| Fluid overload | Salt and fluid restriction; diuretics; dialysis (GFR <10) |
| Cardiovascular risk | Statins, BP control, antiplatelet therapy, lifestyle modification |
Renal Replacement Therapy (RRT) for CKD Stage 5
- Haemodialysis (HD): 3×/week, 4 hours; arteriovenous fistula preferred access (formed early - allow 3-6 months to mature)
- Peritoneal Dialysis (PD): CAPD (continuous ambulatory) or APD (automated overnight); home-based; preferred in diabetics, young patients, remote areas
- Kidney Transplantation: Best long-term outcome; pre-emptive transplant (before dialysis) is ideal; live donor preferred
- Conservative management: Supportive care without dialysis for elderly/co-morbid patients who choose not to dialyse
- Malaysia has a high CKD burden, with diabetes being the leading cause
- Malaysian Society of Nephrology (MSN) Guidelines and MOH Malaysia CPG on CKD provide local guidance
- End-stage renal disease (ESRD) registry (Malaysian National Renal Registry) tracks outcomes
- High rates of Hepatitis B-related glomerulonephritis; universal HBV vaccination programme in place
Quick Reference: Distinguishing the Four Major Causes of Oedema
| Feature | Heart Failure | Nephrotic Syndrome | Liver Cirrhosis | CKD |
|---|---|---|---|---|
| Distribution | Dependent (ankle, leg) | Periorbital + dependent | Ascites predominant | Dependent |
| JVP | ↑ | Normal or ↓ | Normal or ↓ | ↑ (if fluid overloaded) |
| BP | Variable | Normal or ↑ | Low-normal | ↑ (usually) |
| Proteinuria | Minimal | Massive (≥3.5g/24h) | Absent | Variable |
| Serum albumin | Normal or ↓ mild | ↓ (<25 g/L) | ↓ (<25 g/L) | Normal/mildly ↓ |
| LFTs | ↑ ALT (passive congestion) | Normal | Markedly abnormal | Normal |
| BNP/NT-proBNP | ↑↑↑ | Normal/mildly ↑ | May be ↑ | ↑ (due to fluid) |
| Creatinine/eGFR | Normal to ↓ | Normal initially | May ↓ (HRS) | ↓↓ (defining feature) |
| Urine | Normal | Frothy, 3+ protein, lipid casts | Normal | Variable |
| CXR | Cardiomegaly, pulmonary oedema | Normal or effusion | Normal | Normal to enlarged heart |
| ECG | LVH, ischaemia, AF | Normal | Normal | LVH |
Summary of Key Points
-
Oedema results from disrupted Starling forces: raised hydrostatic pressure, reduced oncotic pressure, increased permeability, lymphatic obstruction, or primary renal sodium retention.
-
Clinical approach must distinguish localised from generalised causes; history (frothy urine = nephrotic; breathlessness = cardiac), examination (JVP, ascites, skin signs) and targeted investigations (urine PCR, albumin, BNP, renal function, LFTs) guide the diagnosis.
-
AKI is classified as prerenal (hypoperfusion - most common), intrinsic (tubular, glomerular, vascular, interstitial), or postrenal (obstruction). ATN from ischaemia or nephrotoxins is the most common intrinsic cause. KDIGO staging (creatinine rise or oliguria) guides severity and management.
-
CKD progresses through hyperfiltration injury, RAAS/TGF-β-mediated fibrosis, and results in multisystemic uraemia. Management focuses on slowing progression (RAAS blockade, SGLT-2 inhibitors, BP control), managing complications (anaemia, CKD-MBD, hyperkalaemia, acidosis), and timely preparation for RRT when GFR approaches 15 mL/min/1.73m².