
Critical care unit Scores
critical care ICU severity scoring systems APACHE SOFA SAPS MODS 2024 2025
https://www.merckmanuals.com/professional/critical-care-medi…
APACHE II score critical care ICU severity scoring system table
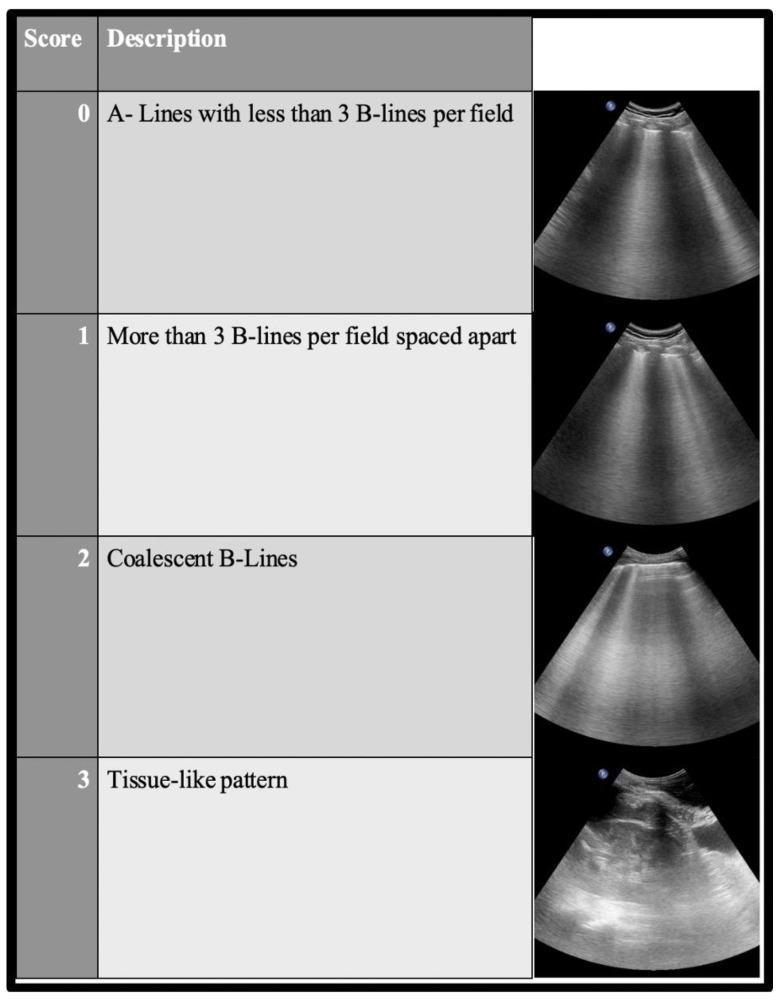
This diagnostic comparison chart illustrates the Lung Ultrasound (LUS) scoring system used to quantify the loss of lung aeration, particularly in critical care and COVID-19 settings. The chart is organized into four levels of increasing severity from Score 0 to 3. Score 0 (Normal) depicts horizontal A-lines with fewer than three vertical B-lines, indicating normal aeration. Score 1 (Moderate Aeration Loss) shows more than three B-lines per intercostal field, which remain distinct and spaced apart. Score 2 (Severe Aeration Loss) demonstrates coalescent B-lines that merge together, creating a 'white lung' appearance. Score 3 (Complete Aeration Loss) shows a tissue-like pattern, representing lung consolidation where the organ resembles solid parenchyma (hepatization). Each score is accompanied by a representative B-mode ultrasound image obtained using a convex probe, showing the transition from reverberation artifacts to structural visualization. This tool is essential for point-of-care ultrasound (POCUS) assessment of interstitial syndrome and pneumonia progression.
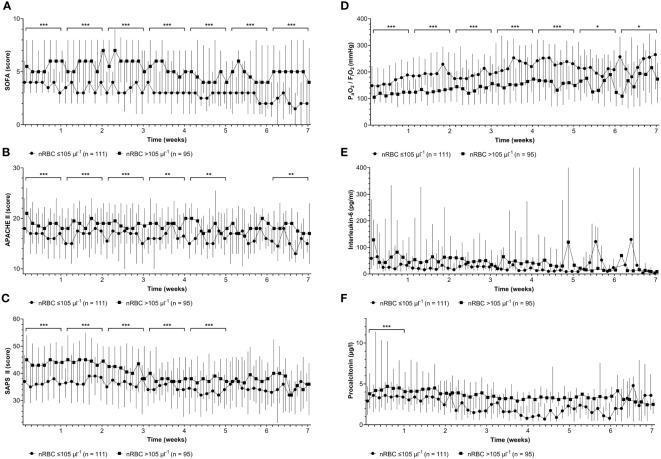
A multi-panel comparison chart comprising six line graphs (A-F) tracking clinical severity scores and inflammatory biomarkers in ICU patients over a seven-week period. The data is stratified into two groups based on maximum nucleated red blood cell (nRBC) counts: >105 µl-1 (indicated by circles) and ≤105 µl-1 (indicated by squares). Graphs A, B, and C demonstrate that patients with higher nRBC counts consistently exhibit significantly higher disease severity scores, including the Sepsis-related Organ Failure Assessment (SOFA), Acute Physiology and Chronic Health Evaluation (APACHE) II, and Simplified Acute Physiology Score (SAPS) II. Graph D shows a significantly lower PaO2/FiO2 ratio (indicating worse pulmonary function) in the high nRBC group. Graphs E and F track Interleukin-6 and Procalcitonin levels, respectively; significant differences are primarily noted in the early ICU stay for Procalcitonin. Statistical significance is indicated by asterisks (*p < 0.05, **p < 0.01, ***p < 0.001) above weekly brackets. Vertical error bars represent data variability.
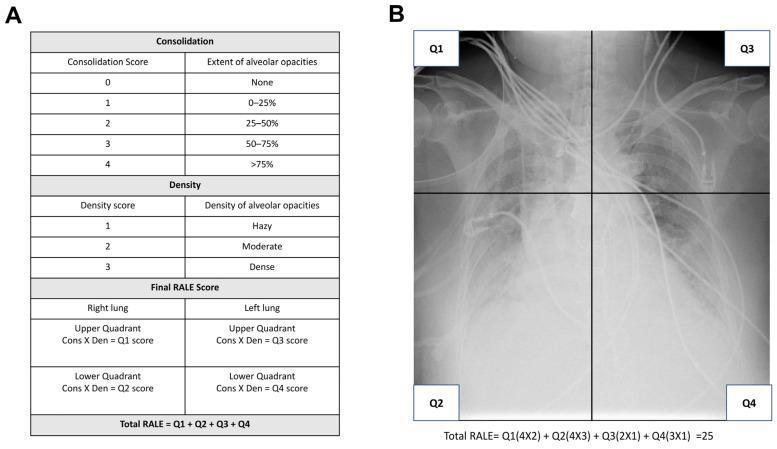
This medical infographic and diagnostic image set illustrates the Radiographic Assessment of Lung Edema (RALE) scoring system used in the context of Acute Respiratory Distress Syndrome (ARDS). Panel A provides a structured reference table for calculating scores based on two criteria: Consolidation and Density. Consolidation is scored from 0 to 4 based on the percentage of lung area involved (none to >75%), while Density is scored from 1 to 3 (hazy, moderate, or dense). The final RALE score is the sum of products (Consolidation × Density) across four quadrants. Panel B demonstrates the practical application of this system on a bedside chest X-ray (CXR) showing bilateral alveolar opacities and medical lines/tubes. The CXR is divided into four quadrants (Q1-Q4) by a vertical midline and a horizontal line at the level of the first branch of the left main bronchus. An example calculation shows a total RALE score of 25, derived from specific quadrant scores. This content is intended for critical care and radiology training to standardize the semi-quantitative assessment of pulmonary edema and inflammation severity.
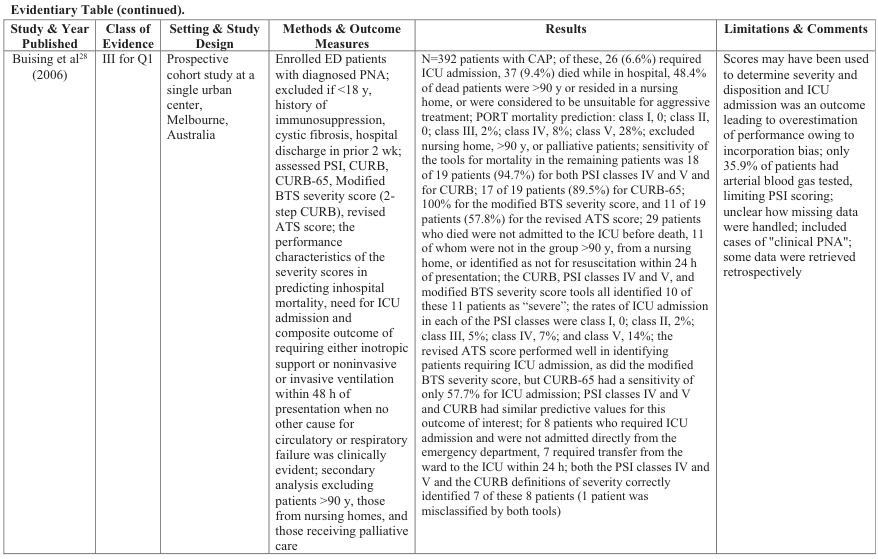
Evidentiary Table (continued). <table><thead><tr><th>Study & Year Published</th><th>Class of Evidence</th><th>Setting & Study Design</th><th>Methods & Outcome Measure</th><th>Results</th><th>Limitations & Comments</th></tr></thead><tbody><tr><td>Buising et al<sup>28</sup> (2006)</td><td>III for Q1</td><td>Prospective cohort study at a single urban center, Melbourne, Australia</td><td>Enrolled ED patients with diagnosed PNA; excluded if <18 y, history of immunosuppression, cystic fibrosis, hospital discharge in prior 2 wk; assessed PSI, CURB, CURB-65, Modified BTS severity score (2-step CURB), revised ATS score; the performance characteristics of the severity scores in predicting inhospital mortality, need for ICU admission and composite outcome of requiring either inotropic support or noninvasive or invasive ventilation within 48 h of presentation when no other cause for circulatory or respiratory failure was clinically evident; secondary analysis excluding patients >90 y, those from nursing homes, and those receiving palliative care</td><td>N=392 patients with CAP; of these, 26 (6.6%) required ICU admission, 37 (9.4%) died while in hospital, 48.4% of dead patients were >90 y or resided in a nursing home, or were considered to be unsuitable for aggressive treatment; PORT mortality prediction: class I, 0; class II, 0; class III, 2%; class IV, 8%; class V, 28%; excluded nursing home, >90 y, or palliative patients; sensitivity of the tools for mortality in the remaining patients was 18 of 19 patients (94.7%) for both PSI classes IV and V and for CURB; 17 of 19 patients (89.5%) for CURB-65; 100% for the modified BTS severity score, and 11 of 19 patients (57.8%) for the revised ATS score; 29 patients who died were not admitted to the ICU before death, 11 of whom were not in the group >90 y, from a nursing home, or identified as not for resuscitation within 24 h of presentation; the CURB, PSI classes IV and V, and modified BTS severity score tools all identified 10 of these 11 patients as "severe"; the rates of ICU admission in each of the PSI classes were class I, 0; class II, 2%; class III, 5%; class IV, 7%; and class V, 14%; the revised ATS score performed well in identifying patients requiring ICU admission, as did the modified BTS severity score, but CURB-65 had a sensitivity of only 57.7% for ICU admission; PSI classes IV and V and CURB had similar predictive values for this outcome of interest; for 8 patients who required ICU admission and were not admitted directly from the emergency department, 7 required transfer from the ward to the ICU within 24 h; both the PSI classes IV and V and the CURB definitions of severity correctly identified 7 of these 8 patients (1 patient was misclassified by both tools)</td><td>Scores may have been used to determine severity and disposition and ICU admission was an outcome leading to overestimation of performance owing to incorporation bias; only 35.9% of patients had arterial blood gas tested, limiting PSI scoring; unclear how missing data were handled; included cases of "clinical PNA"; some data were retrieved retrospectively</td></tr></tbody></table>
SOFA score organ failure assessment ICU critical care
A multi-panel comparison chart comprising six line graphs (A-F) tracking clinical severity scores and inflammatory biomarkers in ICU patients over a seven-week period. The data is stratified into two groups based on maximum nucleated red blood cell (nRBC) counts: >105 µl-1 (indicated by circles) and ≤105 µl-1 (indicated by squares). Graphs A, B, and C demonstrate that patients with higher nRBC counts consistently exhibit significantly higher disease severity scores, including the Sepsis-related Organ Failure Assessment (SOFA), Acute Physiology and Chronic Health Evaluation (APACHE) II, and Simplified Acute Physiology Score (SAPS) II. Graph D shows a significantly lower PaO2/FiO2 ratio (indicating worse pulmonary function) in the high nRBC group. Graphs E and F track Interleukin-6 and Procalcitonin levels, respectively; significant differences are primarily noted in the early ICU stay for Procalcitonin. Statistical significance is indicated by asterisks (*p < 0.05, **p < 0.01, ***p < 0.001) above weekly brackets. Vertical error bars represent data variability.
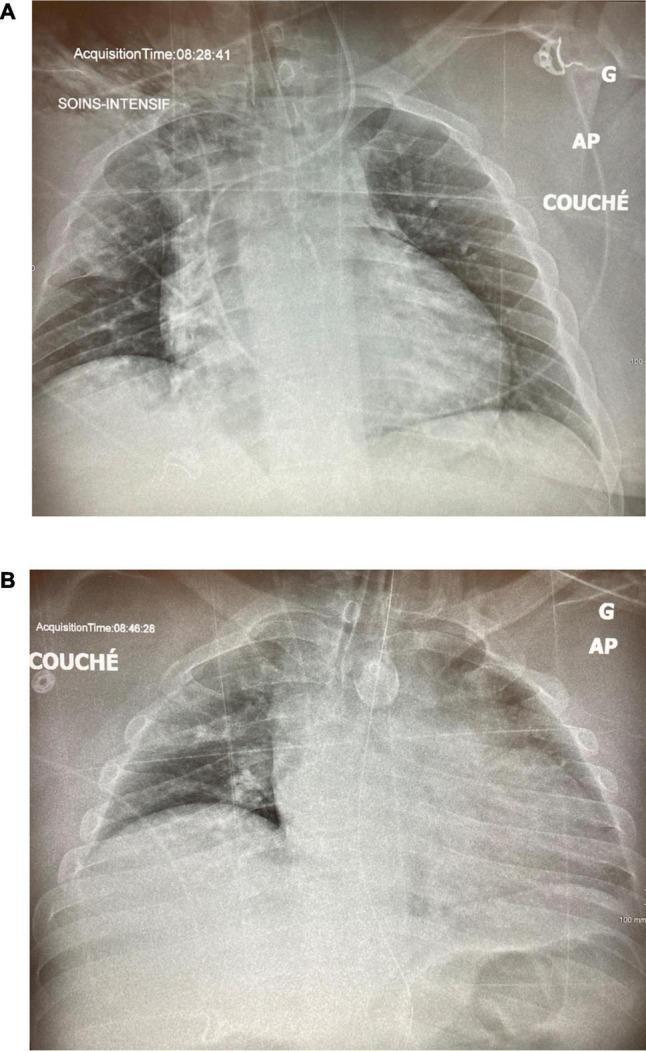
This comparison chart displays two anteroposterior (AP) chest X-rays in the supine (COUCHÉ) position, highlighting the progression of pulmonary pathology in a critical care setting. Image A, taken on ICU Day 5, demonstrates extensive bilateral pulmonary opacities, particularly prominent in the left lung field where they partially obscure the cardiac silhouette and hemidiaphragm, consistent with severe pneumonia or ARDS. Image B, from ICU Day 13, shows a interval decrease in lung volumes and a subsequent increase in bilateral opacification, particularly in the lower zones, suggesting derecruitment or disease progression. Both images show medical support devices including an endotracheal tube with an inflated cuff visible in the mid-trachea and various external monitoring leads. Educational focus is on the radiological assessment of alveolar recruitment and the visual changes associated with mechanical ventilation strategies in patients with severe respiratory failure. The images serve as a comparison of lung aeration over time during intensive care management.
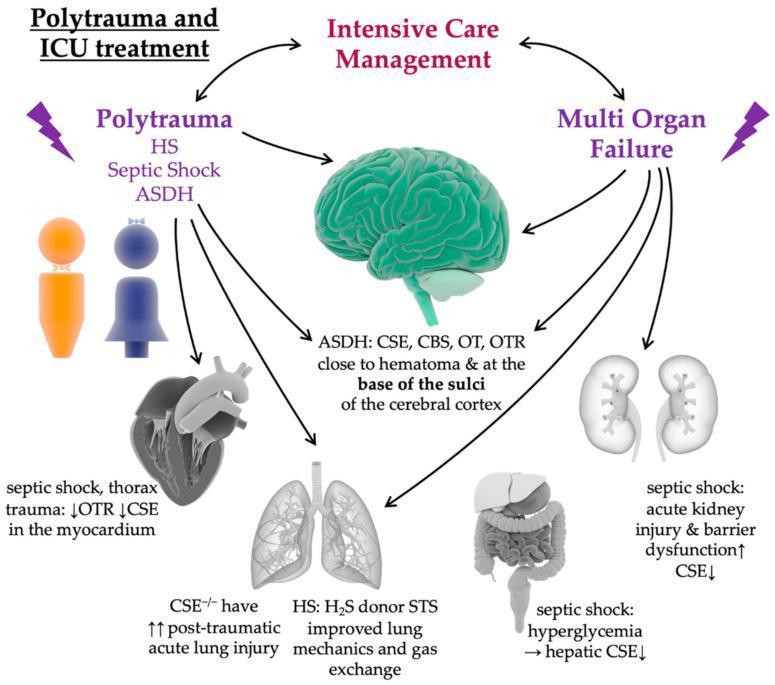
This medical infographic illustrates the pathophysiology of polytrauma and its progression to multi-organ failure, specifically focusing on the dysregulation of the oxytocin/oxytocin receptor (OT/OTR) and hydrogen sulfide (H2S) systems. The diagram outlines a clinical cycle between 'Polytrauma and ICU Treatment' and 'Intensive Care Management.' Primary trauma categories shown include hemorrhagic shock (HS), septic shock, and acute subdural hematoma (ASDH). Organ-specific effects are detailed: the brain shows localization of CSE, CBS, OT, and OTR near hematomas and cortical sulci; the myocardium exhibits decreased OTR and CSE during septic shock/thorax trauma; the lungs show increased acute lung injury (ALI) in CSE-/- models, potentially mitigated by H2S donors like sodium thiosulfate (STS); the kidneys experience acute kidney injury and barrier dysfunction with decreased CSE; and the liver shows decreased CSE linked to septic shock and hyperglycemia. The illustration serves as a pedagogical tool for understanding the neuroendocrine and gaseous mediator response in critical care medicine and the systemic impact of major trauma.
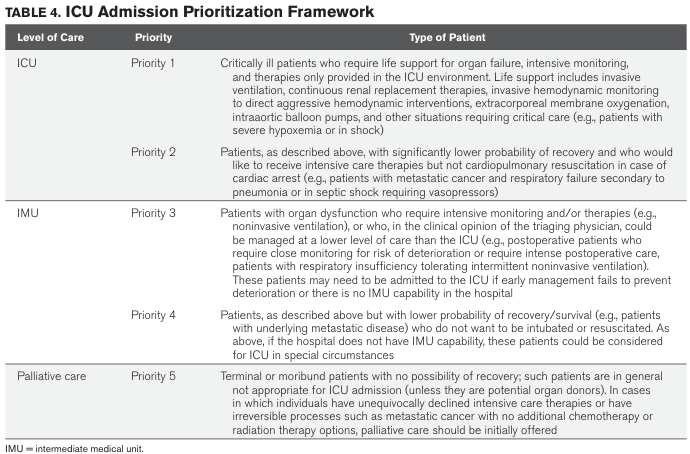
TABLE 4. ICU Admission Prioritization Framework <table><thead><tr><th>Level of Care</th><th>Priority</th><th>Type of Patient</th></tr></thead><tbody><tr><td rowspan="2">ICU</td><td>Priority 1</td><td>Critically ill patients who require life support for organ failure, intensive monitoring, and therapies only provided in the ICU environment. Life support includes invasive ventilation, continuous renal replacement therapies, invasive hemodynamic monitoring to direct aggressive hemodynamic interventions, extracorporeal membrane oxygenation, intraaortic balloon pumps, and other situations requiring critical care (e.g., patients with severe hypoxemia or in shock)</td></tr><tr><td>Priority 2</td><td>Patients, as described above, with significantly lower probability of recovery and who would like to receive intensive care therapies but not cardiopulmonary resuscitation in case of cardiac arrest (e.g., patients with metastatic cancer and respiratory failure secondary to pneumonia or in septic shock requiring vasopressors)</td></tr><tr><td rowspan="2">IMU</td><td>Priority 3</td><td>Patients with organ dysfunction who require intensive monitoring and/or therapies (e.g., noninvasive ventilation), or who, in the clinical opinion of the triaging physician, could be managed at a lower level of care than the ICU (e.g., postoperative patients who require close monitoring for risk of deterioration or require intense postoperative care, patients with respiratory insufficiency tolerating intermittent noninvasive ventilation). These patients may need to be admitted to the ICU if early management fails to prevent deterioration or there is no IMU capability in the hospital</td></tr><tr><td>Priority 4</td><td>Patients, as described above but with lower probability of recovery/survival (e.g., patients with underlying metastatic disease) who do not want to be intubated or resuscitated. As above, if the hospital does not have IMU capability, these patients could be considered for ICU in special circumstances</td></tr><tr><td>Palliative care</td><td>Priority 5</td><td>Terminal or moribund patients with no possibility of recovery; such patients are in general not appropriate for ICU admission (unless they are potential organ donors). In cases in which individuals have unequivocally declined intensive care therapies or have irreversible processes such as metastatic cancer with no additional chemotherapy or radiation therapy options, palliative care should be initially offered</td></tr></tbody></table> IMU = intermediate medical unit.
Critical Care Unit Scoring Systems
- Scott-Brown's Otorhinolaryngology Head & Neck Surgery Vol 1, p. 399
- Maingot's Abdominal Operations, p. 1160
Classification of Scoring Systems
| Category | Examples | Purpose |
|---|---|---|
| Disease severity at admission | APACHE II/III/IV, SAPS II/III, MPM | Predict mortality; benchmark units |
| Organ dysfunction | SOFA, MODS, LODS | Track daily organ failure progression |
| Nursing workload | TISS (Therapeutic Intervention Scoring System) | Resource and staffing allocation |
1. APACHE II (Acute Physiology and Chronic Health Evaluation II)
- Introduced by Knaus et al. in 1985
- Score range: 0 to 71
- Based on the worst value in the first 24 hours of ICU admission
Components:
| Variable | Points (0-4 each) |
|---|---|
| Temperature (core, °C) | ≥41°C or ≤29.9°C = +4 |
| Mean arterial pressure (mmHg) | ≥160 or ≤49 = +4 |
| Heart rate | ≥180 or ≤39 = +4 |
| Respiratory rate | ≥50 or ≤5 = +4 |
| Oxygenation (A-aDO₂ or PaO₂) | Based on FiO₂ |
| Arterial pH | ≥7.7 or ≤7.15 = +4 |
| Serum sodium | ≥180 or ≤111 = +4 |
| Serum potassium | ≥7.0 or ≤2.5 = +4 |
| Serum creatinine | ≥3.5 = +4 |
| Hematocrit | ≥60 or ≤20 = +4 |
| WBC (×10³/mm³) | ≥40 or ≤1 = +4 |
| GCS | Points = 15 minus actual GCS |
- <44 yrs: 0 | 45-54: +2 | 55-64: +3 | 65-74: +5 | ≥75: +6
- +2 for elective post-op with severe organ insufficiency/immunocompromise
- +5 for non-operative or emergency post-op with same
Interpretation:
- Higher scores = higher predicted hospital mortality
- Combined with admission diagnosis to generate predicted mortality %
- Limitation: poor individual prediction (ICU survival is binary); best for population-level comparisons
APACHE III and IV:
- APACHE III (1991) and APACHE IV (2006) add more physiologic variables and improved accuracy, but are more complex and less widely adopted due to proprietary restrictions.
2. SOFA (Sequential Organ Failure Assessment)
- Measured daily throughout ICU stay
- Assesses 6 organ systems, each scored 0-4
- Maximum score: 24
SOFA Components:
| Organ System | Parameter | Score 0 | Score 1 | Score 2 | Score 3 | Score 4 |
|---|---|---|---|---|---|---|
| Respiration | PaO₂/FiO₂ (mmHg) | ≥400 | 300-399 | 200-299 | 100-199 + ventilation | <100 + ventilation |
| Coagulation | Platelets (×10³/µL) | ≥150 | 100-149 | 50-99 | 20-49 | <20 |
| Liver | Bilirubin (µmol/L) | <20 | 20-32 | 33-101 | 102-204 | >204 |
| Cardiovascular | MAP / vasopressors | MAP ≥70 | MAP <70 | Dopamine ≤5 or Dobutamine | Dopamine 5-15 or Epi/Norepi ≤0.1 | Dopamine >15 or Epi/Norepi >0.1 |
| Neurological | GCS | 15 | 13-14 | 10-12 | 6-9 | <6 |
| Renal | Creatinine (µmol/L) or urine output | <110 | 110-170 | 171-299 | 300-440 or <500 mL/day | >440 or <200 mL/day |
Uses of SOFA:
- qSOFA (quick SOFA): 3-item bedside tool for sepsis screening outside the ICU - altered mental status (GCS <15), RR ≥22/min, SBP ≤100 mmHg (score ≥2 = high risk)
- Delta-SOFA (change over time) predicts prognosis better than single admission score
- Studies show SOFA 7-day is among the best calibrated predictors of ICU mortality
3. SAPS II (Simplified Acute Physiology Score II)
- Developed in 1993 (Le Gall et al.)
- Uses 17 variables: 12 physiologic, age, type of admission (scheduled surgical, unscheduled surgical, medical), and 3 underlying disease variables (AIDS, metastatic cancer, hematologic malignancy)
- Score range: 0-163
- Higher scores = higher predicted in-hospital mortality
- Validated across European and North American ICUs
- SAPS III (2005) incorporates pre-ICU information and has better calibration across different regions
4. MPM (Mortality Prediction Model)
- Assesses in-hospital mortality based on chronic medical conditions and acute diagnosis/physiologic variables
- MPM₀ (admission score): 15 variables
- MPM₂₄ (24-hour score): 5 admission + 8 additional variables; for patients remaining >24 hours in ICU
- Can be updated daily: MPM₂₄, MPM₄₈, MPM₇₂
- Studies show MPM II 7-day has the best discriminatory power and calibration for predicting ICU mortality
5. MODS (Multiple Organ Dysfunction Score)
- Developed by Bernard et al.
- Tracks 6 organ systems, each graded 0-4 (similar to SOFA)
- Score range: 0-24
- Strongly correlated with ICU and hospital mortality
- MODS correlates well with SOFA but was designed primarily as a clinical outcome descriptor for MODS research
Organ Systems Scored in MODS:
- Respiratory (PaO₂/FiO₂)
- Renal (creatinine)
- Hepatic (bilirubin)
- Cardiovascular (pressure-adjusted HR)
- Hematologic (platelet count)
- Neurologic (GCS)
6. GCS (Glasgow Coma Scale)
- Component of APACHE II and SOFA, but also used independently in ICU neurological assessment
- Scores: Eye opening (1-4) + Verbal response (1-5) + Motor response (1-6)
- Range: 3 (worst) to 15 (normal)
- Score ≤8 generally indicates need for airway protection
7. TISS (Therapeutic Intervention Scoring System)
- Measures nursing workload and resource utilization
- Scores interventions performed (e.g., mechanical ventilation, arterial line, TPN)
- Used for staffing planning and cost analysis, not mortality prediction
- TISS-28 is the simplified version with 28 items
8. LODS (Logistic Organ Dysfunction System)
- Uses logistic regression weighting for 6 organ systems
- Designed for admission assessment (not serial monitoring)
- Less widely used than SOFA/MODS
9. Disease-Specific Scores Commonly Used in ICU
| Score | Condition | Key Variables |
|---|---|---|
| CURB-65 | Community-acquired pneumonia | Confusion, Urea, RR, BP, Age ≥65 |
| PSI (PORT Score) | Pneumonia | 20 variables; class I-V |
| MELD | Liver failure | Bilirubin, INR, creatinine |
| Ranson's Criteria | Pancreatitis | 11 variables at 0 and 48 h |
| Child-Pugh | Cirrhosis | Bilirubin, albumin, PT, ascites, encephalopathy |
| RIFLE/AKIN/KDIGO | Acute kidney injury | Creatinine rise and urine output |
| Murray Lung Injury Score | ARDS | CXR, PaO₂/FiO₂, PEEP, compliance |
Comparison of Major General ICU Scores
| Feature | APACHE II | SOFA | SAPS II | MPM |
|---|---|---|---|---|
| Year | 1985 | 1994 | 1993 | 1993 |
| Variables | 12 physio + age + chronic health | 6 organ domains | 17 variables | 15-17 variables |
| Timing | First 24 h (worst value) | Daily | First 24 h (worst value) | Admission + 24 h |
| Range | 0-71 | 0-24 | 0-163 | % mortality |
| Primary use | Mortality prediction, benchmarking | Organ dysfunction, sepsis | Mortality prediction | Mortality prediction |
| Serial monitoring | No | Yes (daily) | No | Yes (daily) |
| Proprietary? | APACHE III/IV - yes | No | No | No |
Key Concepts
- No single score is superior for all purposes -- composite use is recommended.
- These scores cannot predict individual outcomes reliably; they are best for group-level comparisons and ICU benchmarking.
- Scores do not tell clinicians when organ dysfunction is reversible or irreversible (Maingot's Abdominal Operations).
- Delta scores (change over 48 hours) are often more prognostically useful than a single admission score.
- A 2025 study (Critical Care and Shock) found modified SOFA (MSOFA) performs best for short-term mortality (≤1 day), while APACHE II is most accurate for long-term mortality prediction.