
Menstrual cycle
menstrual cycle phases hormones diagram
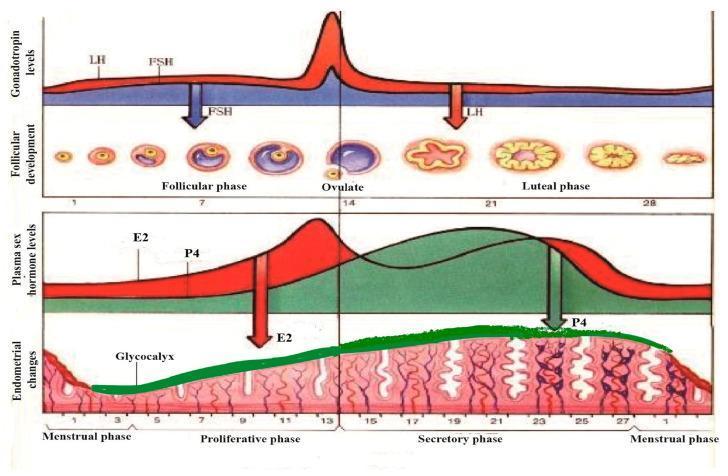
A multi-panel pathophysiology diagram illustrating the synchronous physiological changes during a standard 28-day human menstrual cycle. The top panel graphs gonadotropin levels, showing a sharp surge in Luteinizing Hormone (LH) and a moderate rise in Follicle-Stimulating Hormone (FSH) at day 14, correlating with the follicular phase, ovulation, and luteal phase stages. The corresponding follicular development shows the maturation of a primary follicle into a Graafian follicle, ovulation, and the formation of the corpus luteum and corpus albicans. The middle panel tracks plasma sex hormone levels, highlighting the mid-cycle peak of Estradiol (E2) and the post-ovulatory rise of Progesterone (P4). The bottom panel depicts endometrial morphology, transitioning from the menstrual phase to the proliferative and secretory phases. A green-shaded layer highlights the glycocalyx development, which thickens and becomes most prominent during the secretory phase under the influence of P4, before thinning during menstruation. The diagram demonstrates the hormonal regulation of the ovary and uterine lining for medical educational purposes.
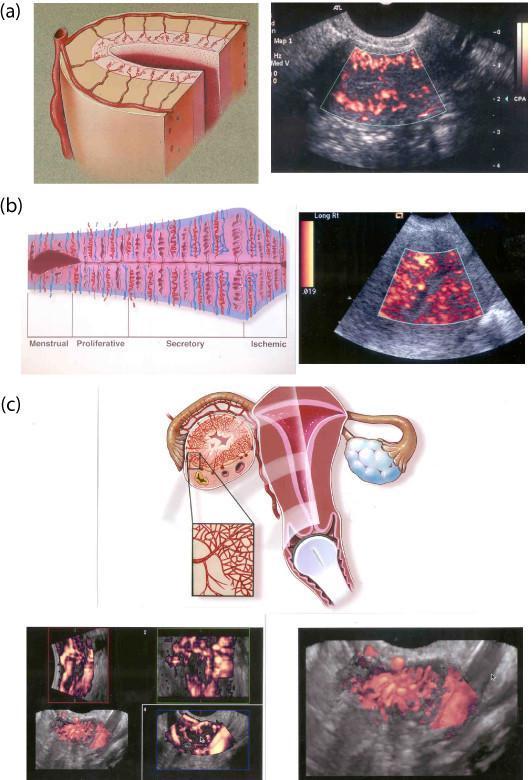
This composite educational resource compares 2D and 3D transvaginal color Doppler sonography (TV-CDS) for evaluating pelvic vascularity. (a) A cross-sectional anatomical diagram and 2D TV-CDS image highlight the uterine vascular hierarchy during the follicular phase, depicting arcuate, radial, and spiral vessels. (b) A timeline diagram illustrates endometrial vascular changes across the menstrual cycle phases: Menstrual, Proliferative, Secretory, and Ischemic. This is paired with a 2D TV-CDS showing the characteristic increase in spiral vessel density during the luteal phase. (c) The bottom section focuses on the corpus luteum, featuring a diagram of the female reproductive system with a magnified view of ovarian vascularization. Below this, multiplanar 3D TV-CDS images (longitudinal, axial, and coronal planes) and a high-definition 3D reconstruction demonstrate the pathognomonic vascular 'wreath'—a dense circumferential ring of blood vessels surrounding the functioning corpus luteum. This content illustrates key gynecological sonography concepts, including the cyclical nature of endometrial perfusion and the advanced spatial assessment afforded by 3D Doppler imaging for ovarian structures.
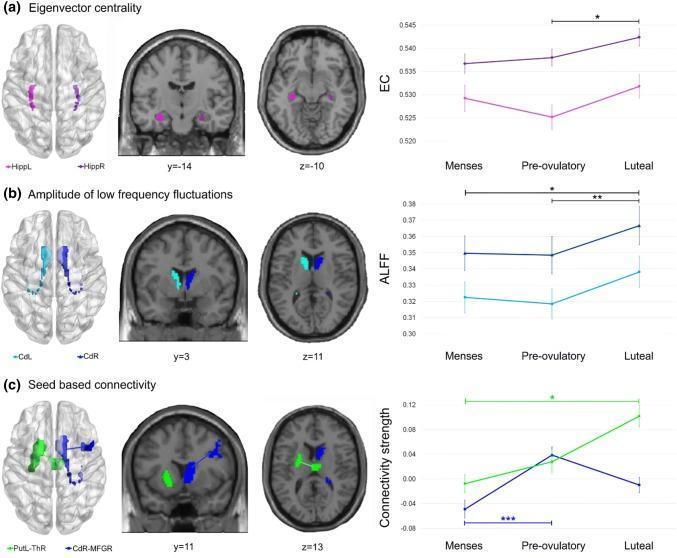
Educational medical visualization of resting-state fMRI (rs-fMRI) analysis across three menstrual cycle phases: menses, pre-ovulatory, and luteal. The image is divided into three panels representing different neuroimaging metrics. Panel (a) shows Eigenvector Centrality (EC) with colored regions in the bilateral hippocampus (purple), indicating a significant increase in functional network importance during the luteal phase compared to the pre-ovulatory phase. Panel (b) illustrates the Amplitude of Low-Frequency Fluctuations (ALFF) in the bilateral caudate (blue and light blue), showing significantly higher neural activity during the luteal phase. Panel (c) displays seed-based functional connectivity changes. It highlights increased connectivity between the left putamen and right thalamus (green) during the luteal phase, and dynamic connectivity between the right caudate and right middle frontal gyrus (MFG, dark blue), which peaks during the pre-ovulatory phase. Each panel includes 3D brain renderings, coronal (y-coordinates), and axial (z-coordinates) cross-sections, alongside quantitative line plots with statistical significance markers (*) for longitudinal comparison of cycle-dependent neuroplasticity.
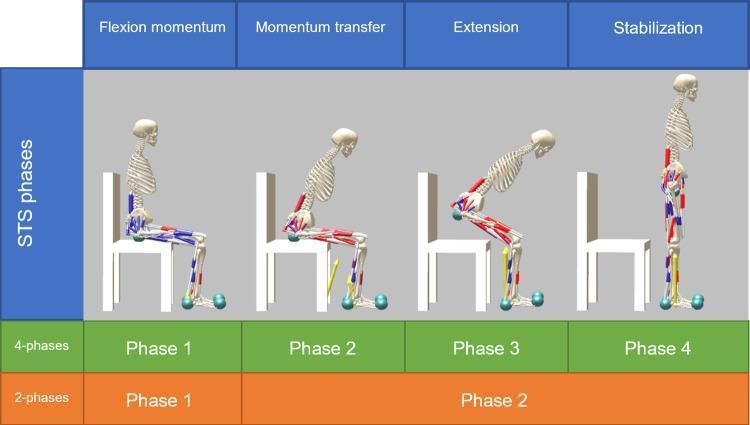
This musculoskeletal diagram illustrates the four kinematic phases of the human sit-to-stand (STS) cycle: Flexion Momentum, Momentum Transfer, Extension, and Stabilization. Each phase is represented by a skeletal model with overlaid muscular activation indicators (red and blue markers) and ground/seat contact spheres. Phase 1 (Flexion Momentum) shows the subject in a seated position with initial trunk flexion. Phase 2 (Momentum Transfer) depicts the lifting of the pelvis from the chair (seat-off), requiring increased hip flexion and ankle dorsiflexion. Phase 3 (Extension) visualizes the upward movement where hip and knee extension occurs, showing significant activation of the quadriceps and gluteal muscle groups. Phase 4 (Stabilization) shows the final erect standing posture with weight-bearing joint alignment and postural stability activation. The diagram further classifies these movements into two different control models: a detailed '4-phases' model (green) and a simplified '2-phases' model (orange), useful for biomechanical analysis and rehabilitation engineering.
The Menstrual Cycle
Overview
Anatomy Involved
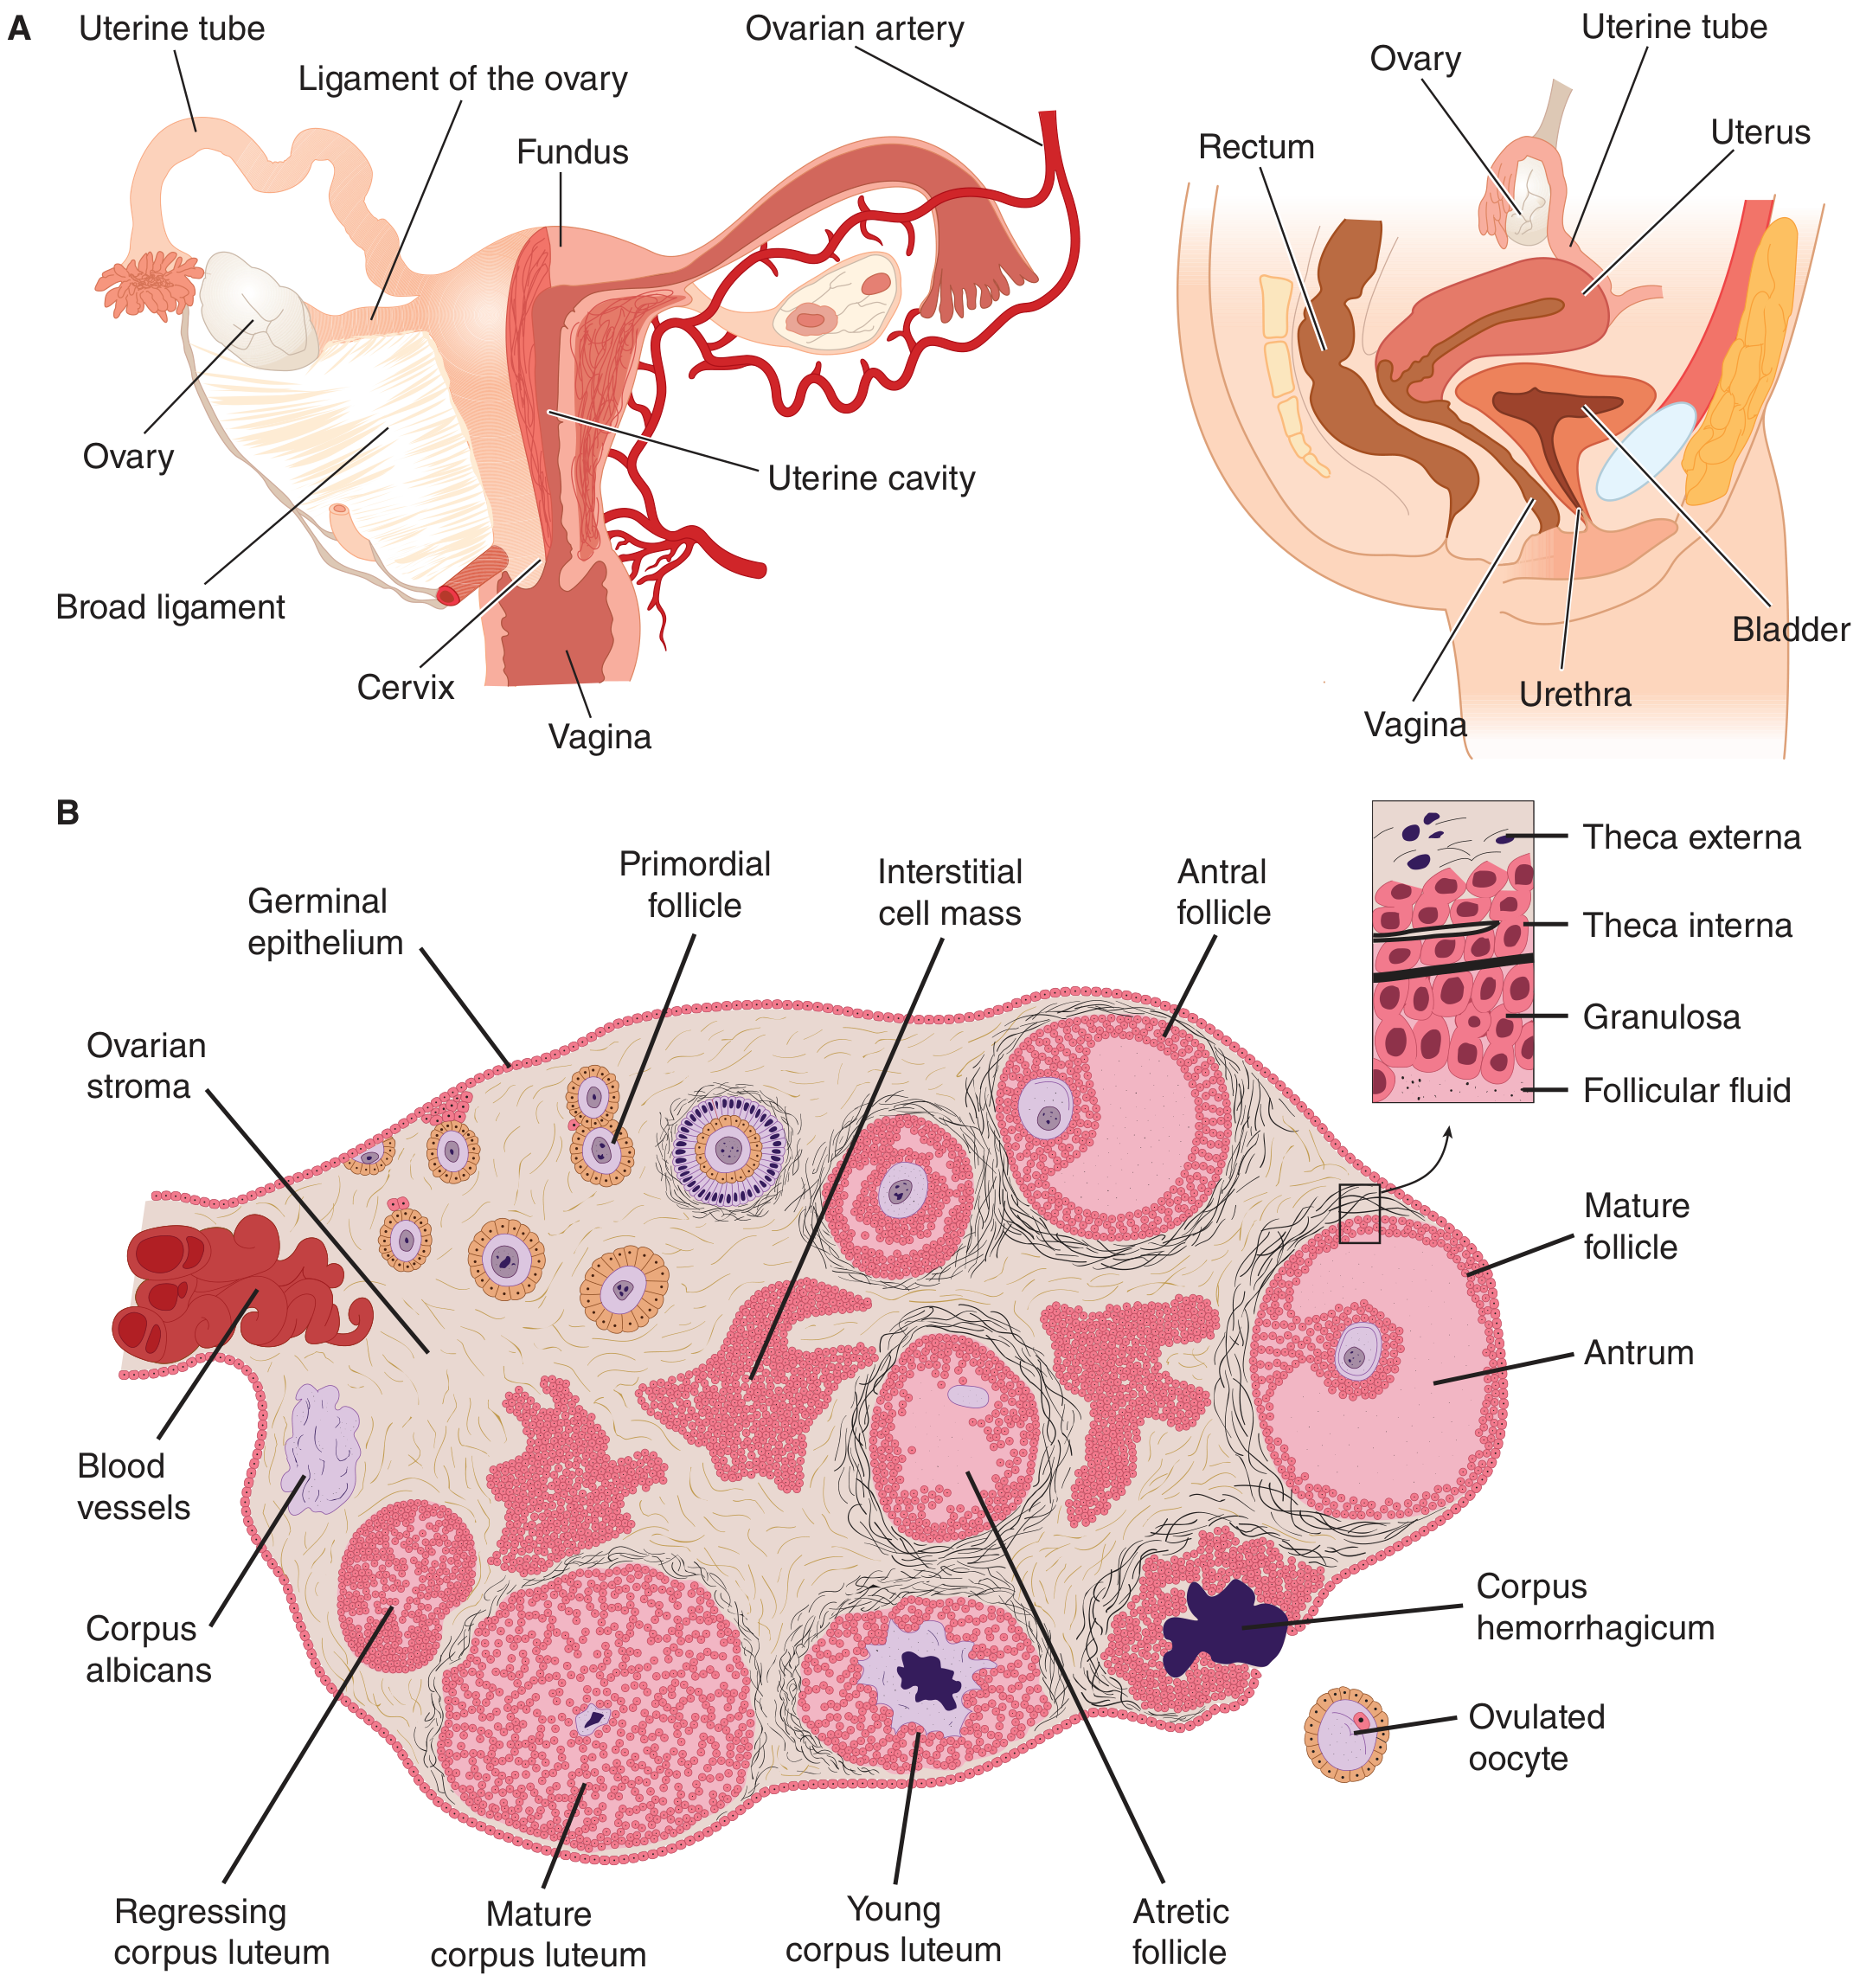
Hormonal Control Axis
1. Hypothalamus - GnRH
- Gonadotropin-releasing hormone (GnRH) is a decapeptide produced by neurons in the arcuate nucleus, secreted in a pulsatile fashion into the portal vessels.
- GnRH must be pulsatile to be effective - continuous exposure causes downregulation of pituitary GnRH receptors (the basis for GnRH agonist therapy).
- Follicular phase: frequent, small-amplitude pulses. Luteal phase: lower frequency, higher amplitude pulses.
- GnRH half-life is only 2-4 minutes due to rapid proteolytic cleavage.
2. Anterior Pituitary - FSH & LH
- GnRH simultaneously regulates FSH (follicle-stimulating hormone) and LH (luteinizing hormone).
- The pulse frequency of GnRH determines the ratio: slower frequency favors FSH secretion over LH.
3. Ovary - Estrogen & Progesterone
- Estrogen is produced mainly by granulosa cells via aromatization of androgens supplied by the theca interna cells (the "two-cell, two-gonadotropin" model).
- After ovulation, the corpus luteum secretes both estrogen and progesterone.
Phases of the Menstrual Cycle
Phase 1 - Menstrual Phase (Days 1-5)
- Withdrawal of estrogen and progesterone at the end of the previous cycle causes vasoconstriction of spiral arteries, ischemia, and shedding of the functional endometrial layer.
- FSH levels begin to rise, stimulating new follicle recruitment.
Phase 2 - Follicular (Proliferative) Phase (Days 1-14)
- FSH stimulates growth of several primordial follicles. By day 6, one becomes the dominant (Graafian) follicle - selected by its superior ability to produce intrafollicular estrogen. Others undergo atresia via apoptosis.
- The dominant follicle develops a fluid-filled antrum.
- Rising estradiol (E2) exerts negative feedback on FSH/LH early in this phase, suppressing non-dominant follicles.
- Endometrial effects of estrogen:
- Stimulates growth of the endometrium, glands, stroma, and elongation of spiral arteries.
- Cervical mucus becomes copious, watery, and elastic - produces a "ferning" pattern on a slide, forming channels that allow sperm penetration.
Phase 3 - Ovulation (Day 14)
- Rising estradiol switches to positive feedback on the pituitary, triggering the LH surge (with a smaller FSH surge).
- The LH surge causes the dominant follicle to rupture ~36 hours later - ovulation.
- The ovum is extruded into the abdominal cavity, picked up by the fimbriated ends of the fallopian tube.
- Some women experience brief lower abdominal pain (mittelschmerz) from follicular fluid/blood causing peritoneal irritation.
Phase 4 - Luteal (Secretory) Phase (Days 14-28)
-
The ruptured follicle fills with blood (corpus hemorrhagicum), then granulosa and theca cells proliferate and the clot is replaced by lipid-rich luteal cells - forming the corpus luteum.
-
The corpus luteum secretes progesterone (dominant) and estrogen. Vascular development of the corpus luteum depends on VEGF.
-
Endometrial effects of progesterone:
- Proliferation slows; endometrium becomes secretory.
- Glands become tortuous, accumulate glycogen, increase mucus secretion.
- Stroma becomes edematous; spiral arteries become highly coiled.
- Cervical mucus becomes thick, non-elastic, non-ferning - no longer permeable to sperm.
- Progesterone has a mild thermogenic action, raising basal body temperature by ~0.5°C (basis of the "rhythm method" of contraception).
-
If no pregnancy occurs: The corpus luteum regresses (~day 23-24), progesterone and estrogen fall, FSH rises again, and menstruation begins - the cycle repeats.
-
If pregnancy occurs: hCG (human chorionic gonadotropin) from the trophoblast maintains the corpus luteum, which keeps producing progesterone to sustain the endometrium until the placenta takes over.
-
The corpus luteum regresses to a fibrous corpus albicans.
Summary Table
| Phase | Days | Dominant Hormone | Endometrium | Key Events |
|---|---|---|---|---|
| Menstrual | 1-5 | Falling E + P | Shedding | FSH begins rising |
| Follicular/Proliferative | 1-14 | Estrogen (E2) | Thickens, glands grow | Dominant follicle selected; ferning of cervical mucus |
| Ovulation | ~14 | LH surge | Prepared | Follicle ruptures; ovum released |
| Luteal/Secretory | 14-28 | Progesterone | Secretory, glycogen-rich | Corpus luteum; BBT rises; thick cervical mucus |
Clinical Indicators of Ovulation
- Basal body temperature (BBT) rise of ~0.5°C in the luteal phase (due to progesterone's thermogenic effect).
- Cervical mucus changes - switch from watery/ferning to thick/non-ferning indicates ovulation has occurred.
- Urinary LH kits detect the preovulatory LH surge (~24-36 h before ovulation).
- Mittelschmerz - mid-cycle pelvic pain at the time of ovulation.
Cyclic Effects on Other Tissues
| Tissue | Follicular Phase Effect | Luteal Phase Effect |
|---|---|---|
| Endometrium | Proliferation, gland growth | Secretory transformation |
| Cervical mucus | Watery, ferning | Thick, non-ferning |
| Breasts | Ductal proliferation (estrogen) | Lobular/alveolar growth (progesterone); possible swelling/tenderness |
| Vaginal epithelium | Proliferation, cornification | Infiltration by leukocytes |
| Basal body temperature | Baseline | Elevated ~0.5°C |