
Explain me 10 changes of ecg
I'll look up the medical library for authoritative ECG content right away.
Searching sources...
Reading File
Finding Sources
Finding Sources
Finding Sources
Reading File
Reading File
Reading File
Reading File
Excellent - I now have rich textbook content from Harrison's Principles of Internal Medicine (22nd ed). Let me compile the comprehensive answer from what I've gathered.
10 Important ECG Changes
Based on Harrison's Principles of Internal Medicine, 22nd Edition and Medical Physiology (Boron & Boulpaep).
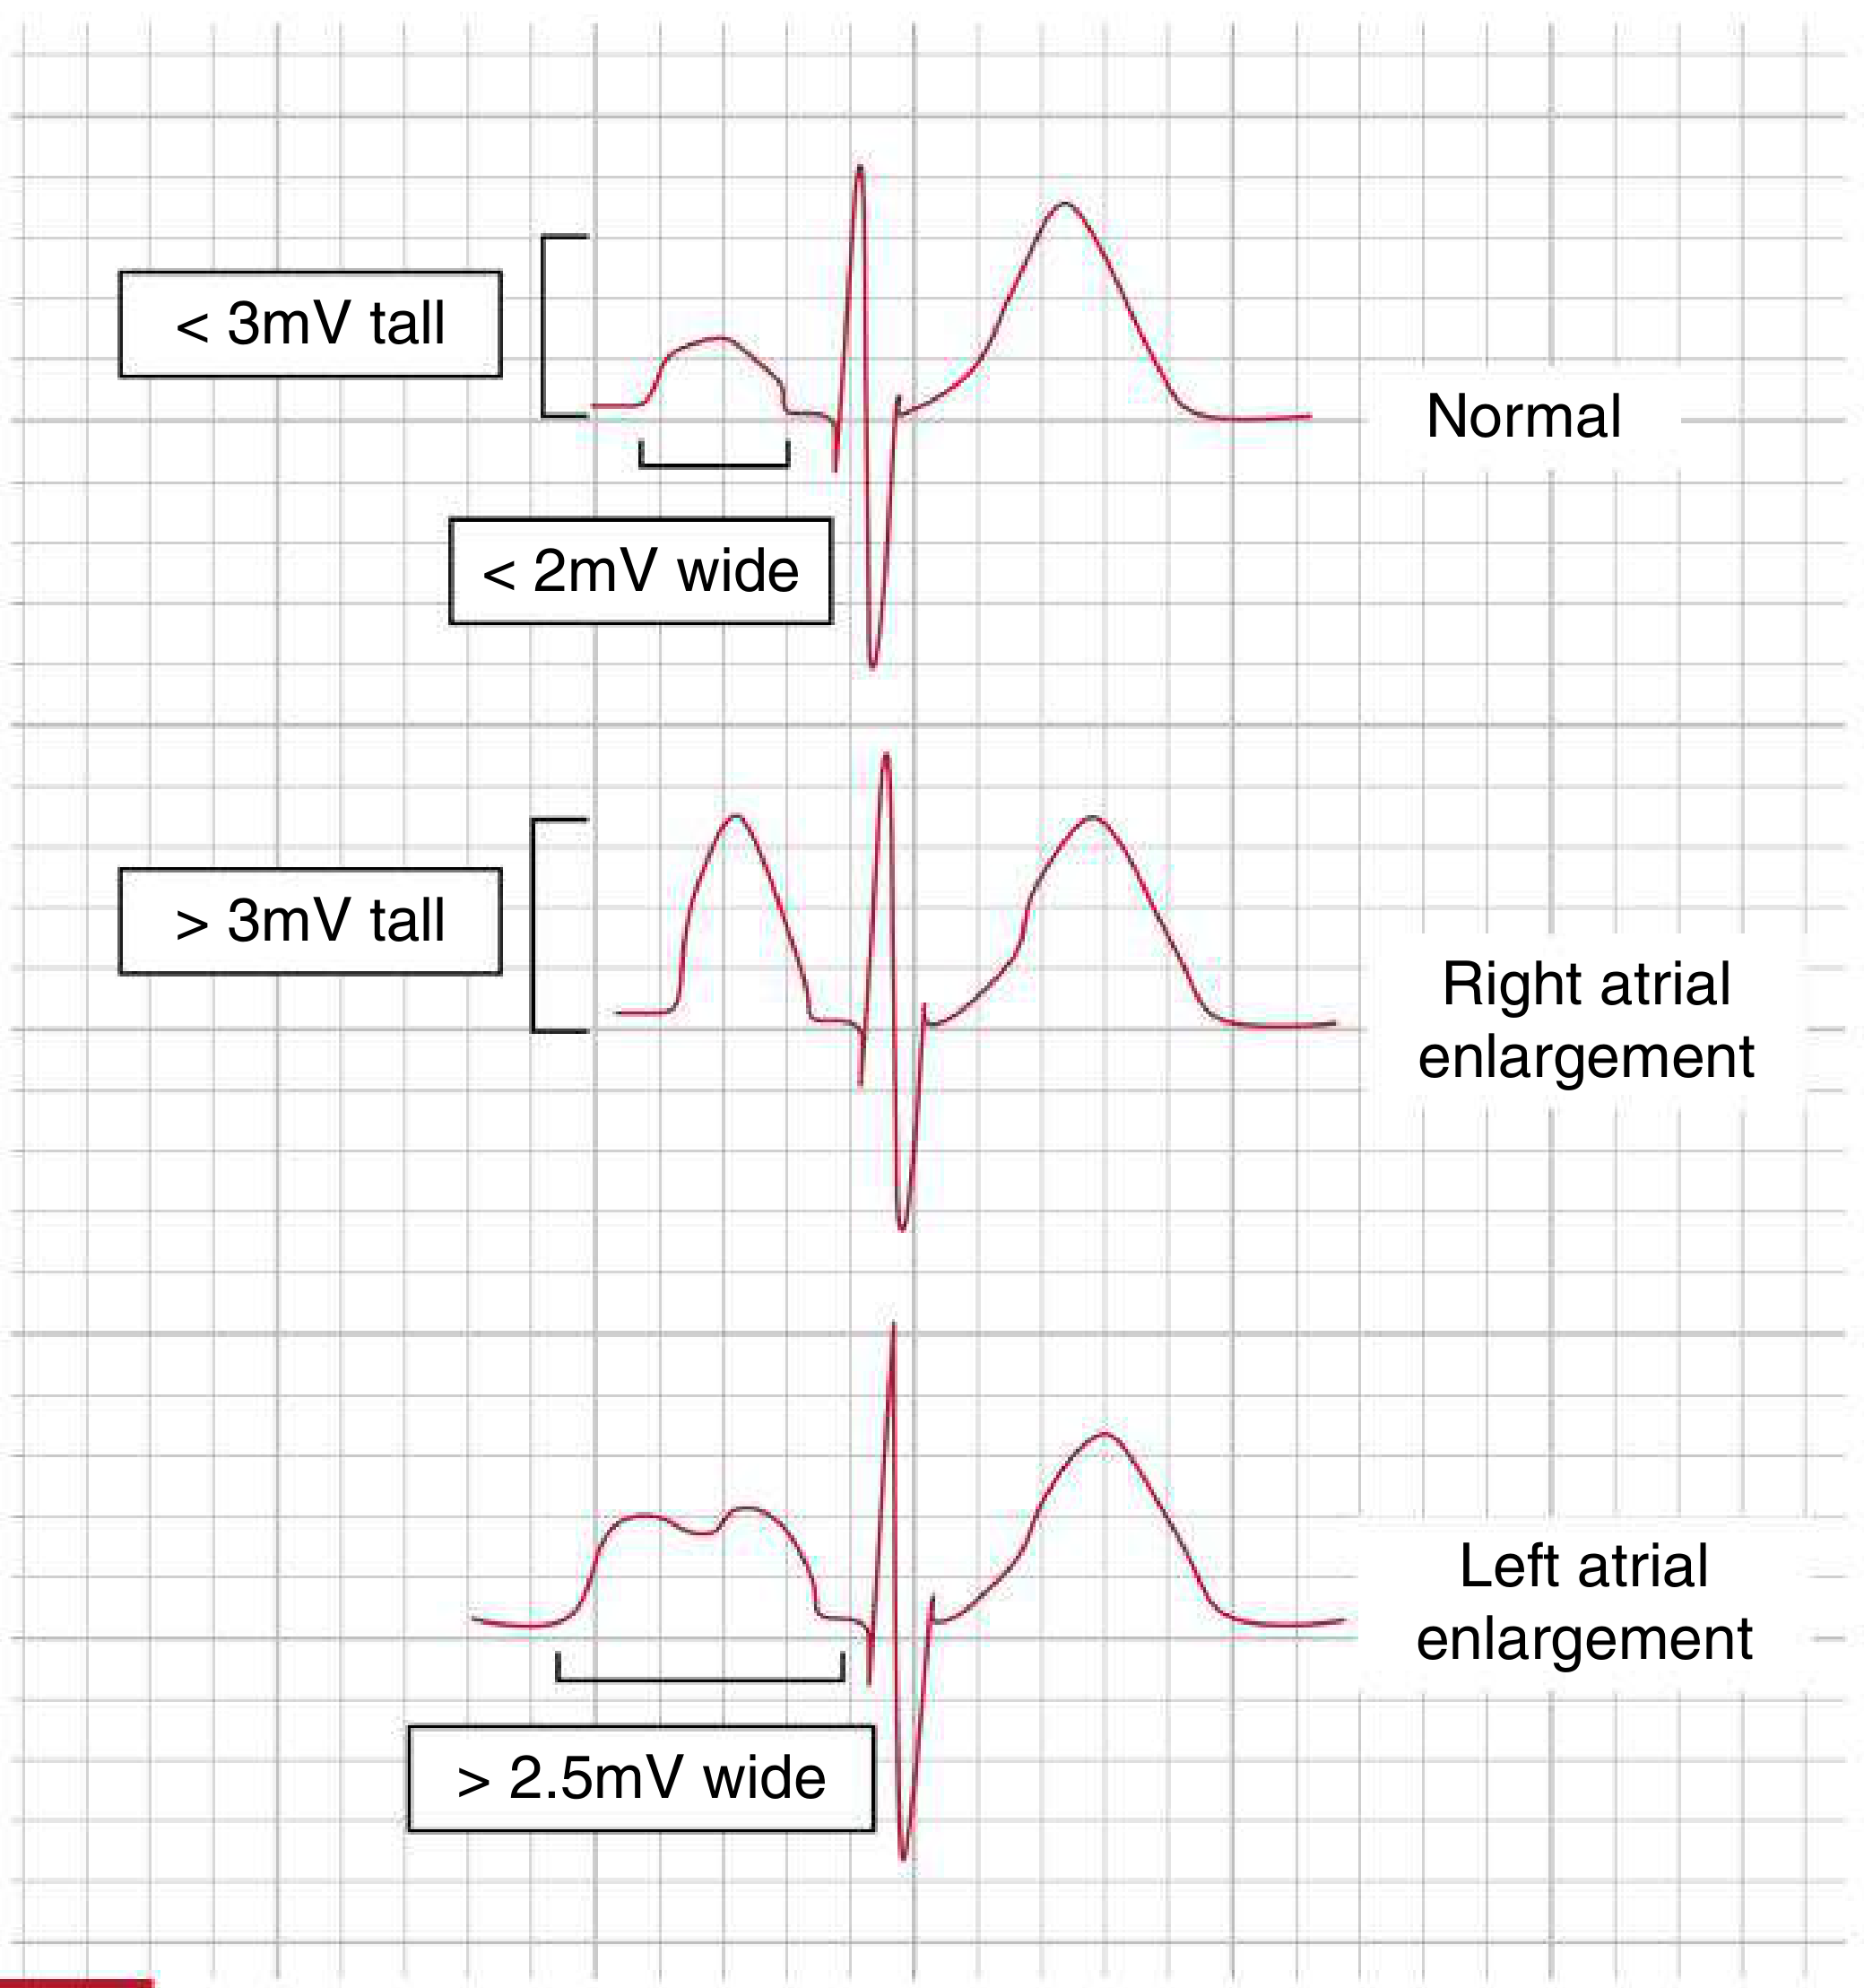
1. P-Wave Changes (Atrial Enlargement)
Right atrial overload produces tall, peaked P waves ≥ 2.5 mm (historically "P-pulmonale") - seen in right-sided pressure overload (e.g., pulmonary hypertension, tricuspid stenosis).
Left atrial abnormality produces a broad (≥120 ms), often notched P wave in limb leads, and a biphasic P wave in V1 with a prominent negative (terminal) component. Historically called "P-mitrale." Can occur with interatrial conduction delay even without true enlargement.
2. ST-Segment Elevation
Classic sign of acute myocardial infarction (STEMI). ST elevation in anatomically contiguous leads indicates acute transmural ischemia/injury. The elevated segment is concave-upward ("coved" or "tombstone" shape in severe cases). Also seen in:
- Pericarditis (diffuse, saddle-shaped elevation)
- Vasospastic (Prinzmetal) angina (transient, resolves with nitrates)
- Brugada syndrome (right precordial V1-V2)
3. ST-Segment Depression
Indicates subendocardial ischemia or non-ST elevation ACS (NSTEMI/UA). Also seen in:
- Reciprocal changes in STEMI in the opposite territory
- Right or left ventricular hypertrophy ("strain" pattern)
- Digitalis effect (produces a characteristic "scooped" or "hockey-stick" depression)
4. T-Wave Inversion
Reflects abnormal ventricular repolarization. Causes include:
- Ischemia/NSTEMI - deep symmetric T-wave inversions (Wellens' pattern in V2-V3 indicates LAD critical stenosis)
- Right/Left ventricular hypertrophy - in leads with dominant R waves ("strain" pattern)
- Bundle branch blocks
- Pulmonary embolism - T-wave inversions in V1-V4
Normally the mean T-wave vector should be roughly concordant (within ~45°) with the mean QRS vector in the frontal plane.
5. QRS Axis Deviation
The normal QRS axis is -30° to +90° in the frontal plane.
- Left axis deviation (LAD): axis more negative than -30°. Causes include left anterior fascicular block, inferior MI, LVH, Wolff-Parkinson-White syndrome.
- Right axis deviation (RAD): axis beyond +90°. Causes include RVH, left posterior fascicular block, pulmonary embolism (acute cor pulmonale), and normal variant in tall/thin individuals.
The axis can shift markedly in hypertrophy or conduction block.
6. Bundle Branch Blocks (QRS Widening ≥ 120 ms)
Right Bundle Branch Block (RBBB): rsR' ("rabbit ears") in V1, wide slurred S wave in lateral leads (I, V5-V6). QRS ≥ 120 ms.
Left Bundle Branch Block (LBBB): broad, notched R wave in lateral leads (I, aVL, V5-V6), deep S wave in V1. QRS ≥ 120 ms. New LBBB in the context of chest pain is treated as a STEMI equivalent.
Incomplete bundle branch blocks show similar morphology but QRS 100-119 ms.
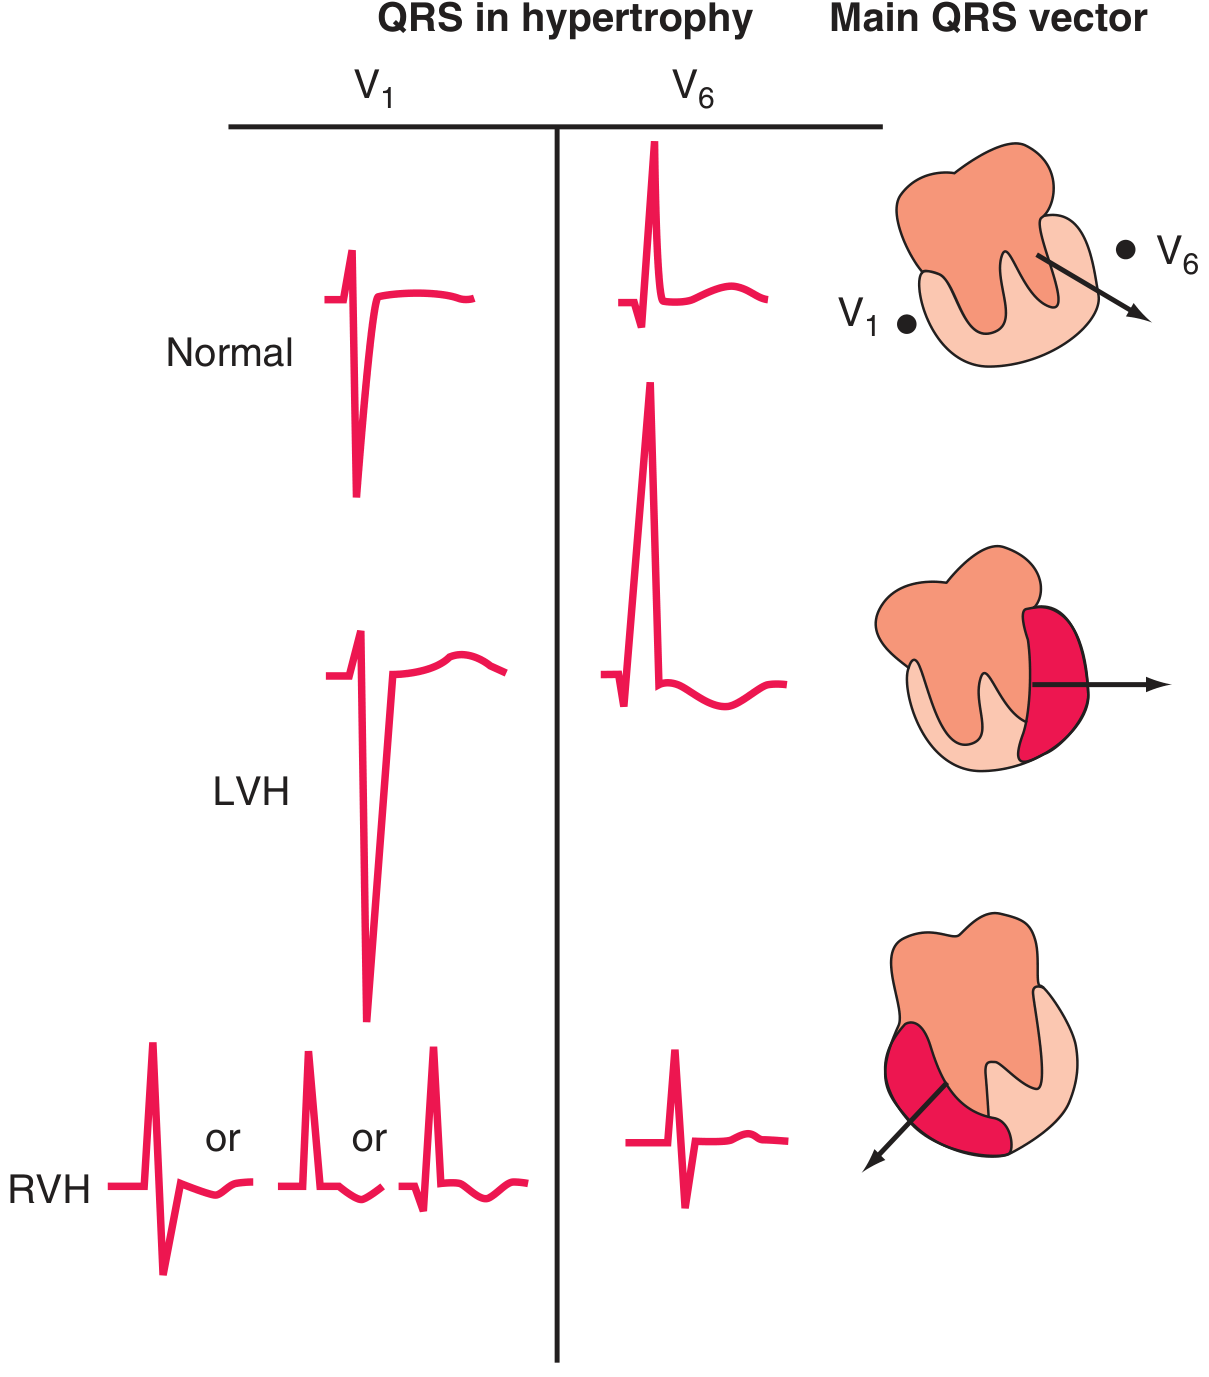
7. LVH and RVH Voltage Changes
Left Ventricular Hypertrophy (LVH): increases amplitude of electrical forces directed leftward and posteriorly. Voltage criteria (e.g., Sokolow-Lyon: S in V1 + R in V5 or V6 ≥ 35 mm). Often accompanied by ST depression and T-wave inversions in lateral leads ("strain pattern").
Right Ventricular Hypertrophy (RVH): tall R wave in V1 (R ≥ S), right axis deviation, ST-T changes in right precordial leads. Due to pulmonic stenosis or pulmonary arterial hypertension.
8. QT Interval Prolongation
The QT interval reflects total ventricular repolarization duration. Rate-corrected QTc (Bazett formula) is normally:
- Males: ≤440 ms
- Females: ≤460 ms
Prolonged QT predisposes to torsades de pointes (polymorphic VT). Causes:
- Drugs: antiarrhythmics (quinidine, sotalol, amiodarone, dofetilide), antibiotics (azithromycin, fluoroquinolones), antipsychotics
- Electrolyte abnormalities: hypokalemia, hypomagnesemia, hypocalcemia
- Congenital long QT syndrome
Prominent U waves (especially with hypokalemia) are also a marker of prolonged repolarization and torsades risk.
9. PR Interval Changes
Normal PR interval: 120-200 ms (3-5 small boxes).
- Short PR (< 120 ms): seen in pre-excitation syndromes (Wolff-Parkinson-White - with delta wave), Lown-Ganong-Levine syndrome, or AV junctional/low atrial rhythms.
- First-degree AV block: PR > 200 ms, every P followed by QRS.
- Second-degree AV block (Mobitz I/Wenckebach): progressively lengthening PR until a QRS is dropped.
- Second-degree AV block (Mobitz II): fixed PR with sudden non-conducted P waves - more ominous, may progress to complete block.
- Third-degree (complete) AV block: no relationship between P waves and QRS; atria and ventricles beat independently.
10. Pathological Q Waves
A pathological Q wave is:
- Width ≥ 40 ms (1 small box)
- Depth ≥ 25% of the following R wave
- Seen in ≥ 2 contiguous leads
They indicate prior transmural myocardial infarction (irreversible myocardial necrosis). Q waves develop hours to days after a STEMI and may persist permanently. Their location maps to the infarcted territory:
- Inferior MI: Q waves in II, III, aVF
- Anterior MI: Q waves in V1-V4
- Lateral MI: Q waves in I, aVL, V5-V6
Quick Reference Summary
| ECG Change | Key Feature | Classic Cause |
|---|---|---|
| P-wave changes | Tall/peaked or broad/notched | Atrial enlargement |
| ST elevation | ≥1 mm in ≥2 contiguous leads | STEMI, pericarditis |
| ST depression | Horizontal/downsloping | NSTEMI, strain |
| T-wave inversion | Symmetric, deep | Ischemia, hypertrophy |
| Axis deviation | LAD or RAD | Block, hypertrophy, PE |
| Bundle branch block | QRS ≥ 120 ms | RBBB or LBBB pattern |
| LVH/RVH voltage | Tall R/deep S | Hypertrophy |
| QT prolongation | QTc > 440/460 ms | Drugs, electrolytes |
| PR interval changes | <120 or >200 ms | Pre-excitation, AV block |
| Pathological Q waves | Wide ≥ 40 ms, deep | Prior MI |
Sources: Harrison's Principles of Internal Medicine, 22nd Edition (2025), p. 1913-1920; Medical Physiology (Boron & Boulpaep), pp. 731-732
This is a shared conversation. Sign in to Orris to start your own chat.