
About ECG
Asking for Preferences
What aspect of ECG would you like to learn about?
ECG basics covers waveform components (P, QRS, T), intervals, axis, rate, and rhythm. Let me pull detailed content from the medical library now.
Searching sources...
Reading File
Finding Sources
Finding Sources
Finding Sources
Finding Sources
Finding Sources
Reading File
Finding Sources
Finding Sources
Excellent - I have multiple authoritative sources. Let me read from Guyton (physiology), Harrison's (clinical), Harriet Lane, and Medical Physiology in parallel.
Reading File
Reading File
Reading File
Reading File
Reading File
I now have excellent content from multiple authoritative sources. Let me fetch the key ECG waveform diagram from Harrison's to include visually.
Loading Image
Loading Image
I now have everything needed for a thorough, well-illustrated ECG basics guide. Here it is:
ECG Basics: How to Read an Electrocardiogram
What is an ECG?
An electrocardiogram (ECG) records the electrical activity of the heart by detecting tiny potentials on the skin's surface. When a cardiac impulse travels through the heart, current spreads into surrounding tissues and reaches the body surface. Electrodes placed at specific sites capture these potentials and display them as waveforms over time.
- Braunwald's Heart Disease; Guyton and Hall Textbook of Medical Physiology
The Cardiac Conduction System (What Generates the ECG)
Before reading the ECG, understand what produces it:
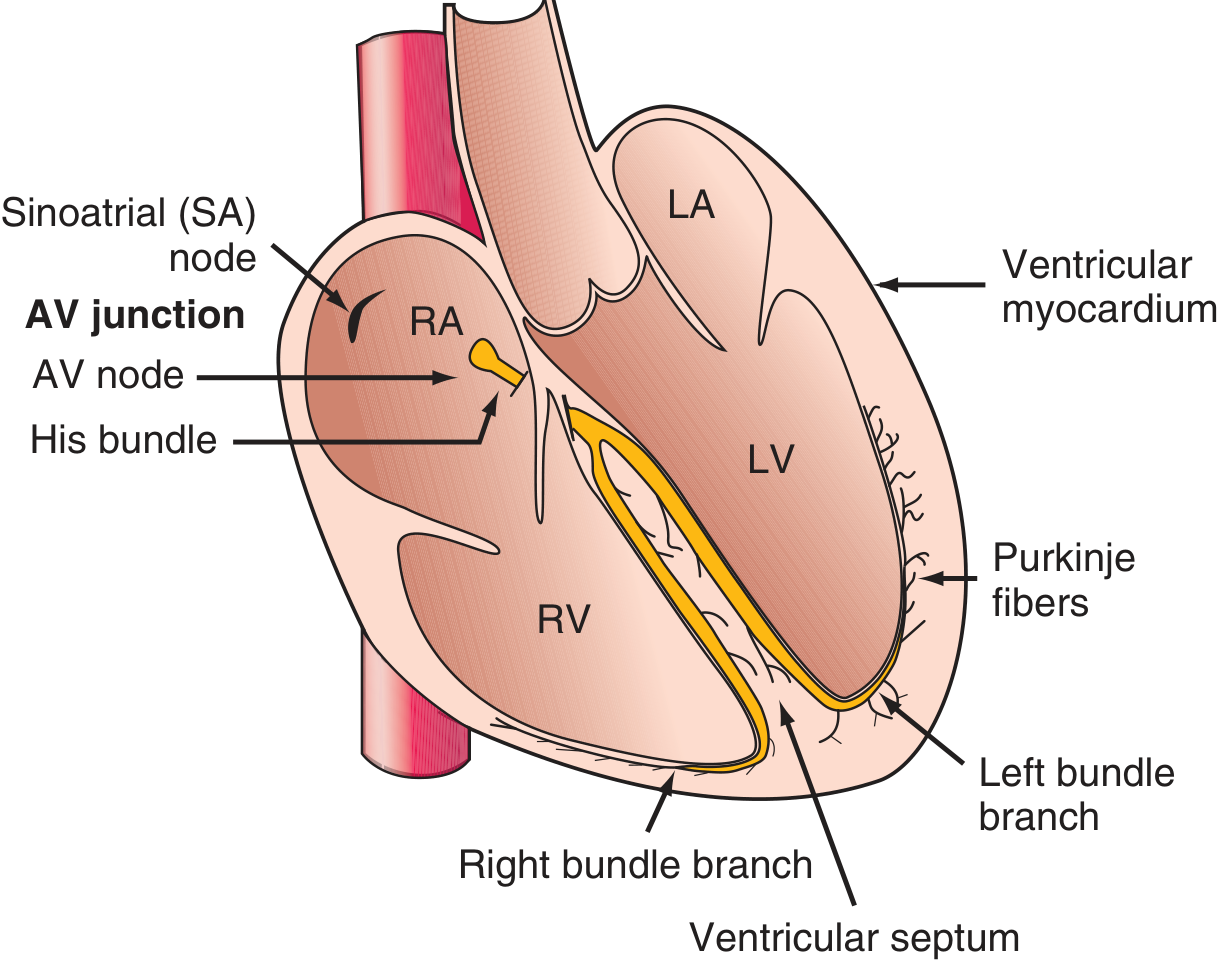
The impulse originates in the SA node, depolarizes both atria, passes through the AV node (where it slows), travels down the His bundle, splits into the right and left bundle branches, and finally spreads through the Purkinje fibers into the ventricular myocardium. This coordinated sequence produces all the recognizable ECG waveforms.
- Harrison's Principles of Internal Medicine 22E
The Basic ECG Waveforms
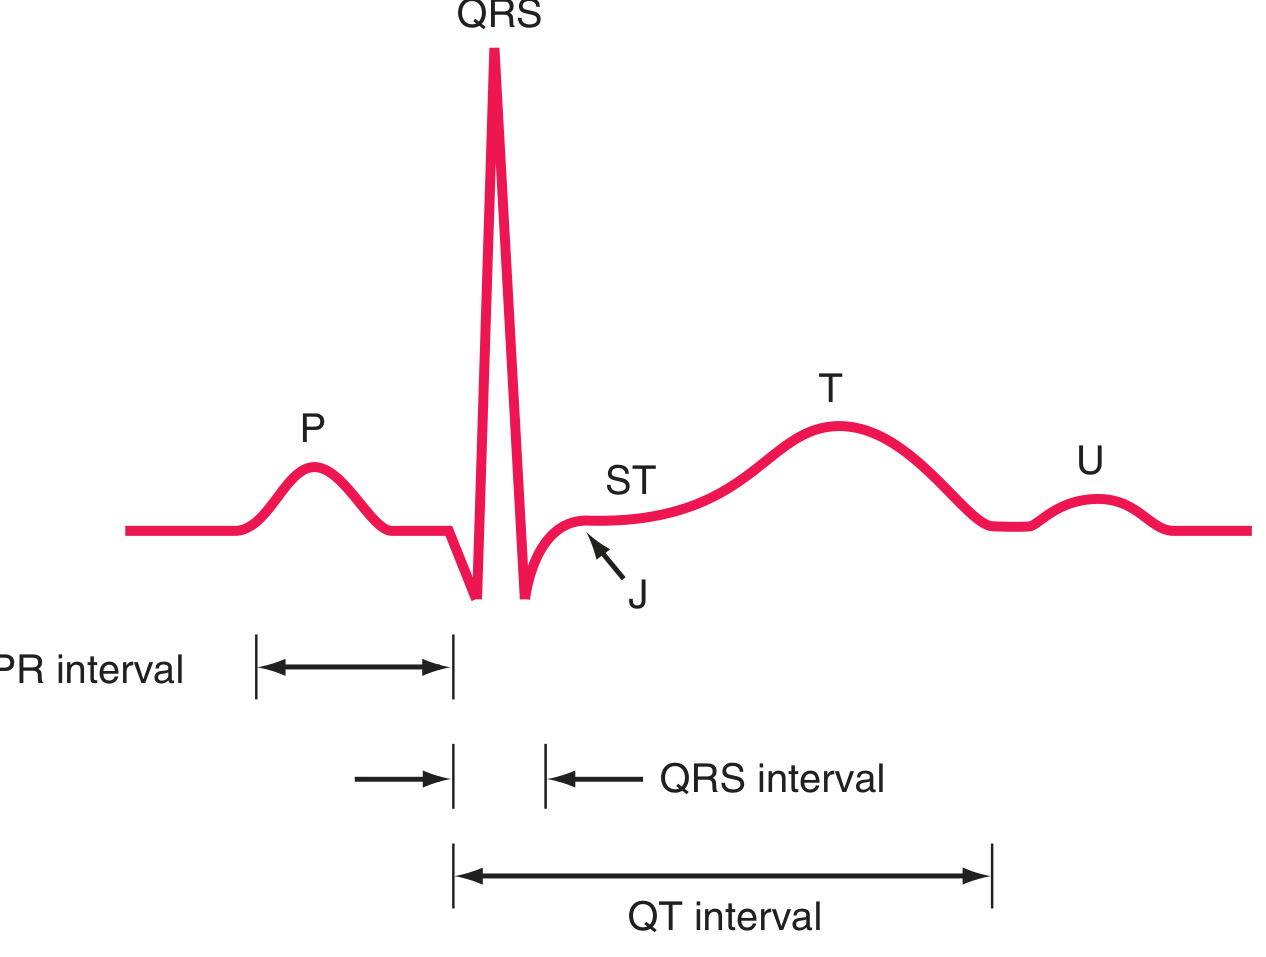
| Wave / Segment | Represents |
|---|---|
| P wave | Atrial depolarization |
| PR segment | AV node conduction delay |
| QRS complex | Ventricular depolarization |
| ST segment | Plateau of ventricular action potential (isoelectric at rest) |
| T wave | Ventricular repolarization |
| U wave | Late ventricular repolarization (not always present) |
| J point | Junction between end of QRS and start of ST segment |
The QRS complex may have up to three components: Q (initial negative), R (first positive), and S (second negative). All three are not always present.
- Guyton and Hall Textbook of Medical Physiology; Harrison's Principles of Internal Medicine 22E
ECG Paper and Measurements
ECG paper is a 1 mm grid, recorded at a standard speed of 25 mm/sec:
- 1 small box = 1 mm wide = 0.04 seconds (40 ms)
- 1 large box = 5 mm wide = 0.20 seconds (200 ms)
- Amplitude: 1 mV = 10 mm (standard calibration)
This means you measure time horizontally and voltage vertically.
Key Intervals and Normal Values
| Interval | What it Measures | Normal Value |
|---|---|---|
| PR interval | Start of P wave to start of QRS; includes AV conduction time | 120-200 ms (3-5 small boxes) |
| QRS duration | Duration of ventricular depolarization | ≤100-110 ms (<2.5 small boxes) |
| QT interval | Ventricular depolarization + repolarization | Varies with rate; corrected (QTc) ≤450 ms (men), ≤460 ms (women) |
| RR interval | Time between consecutive QRS complexes | Used to calculate heart rate |
QTc correction (Bazett formula): QTc = QT (sec) / √RR (sec)
The QT interval must always be rate-corrected because it shortens at faster heart rates and lengthens at slower ones.
- Harrison's Principles of Internal Medicine 22E; Harriet Lane Handbook
1. Rate
Method 1 (regular rhythm): Divide 300 by the number of large boxes between two consecutive R waves.
| R-R large boxes | Rate (bpm) |
|---|---|
| 1 | 300 |
| 2 | 150 |
| 3 | 100 |
| 4 | 75 |
| 5 | 60 |
| 6 | 50 |
Method 2: HR = 1500 ÷ number of small boxes between two R waves
Method 3 (irregular rhythm): Count QRS complexes in a 10-second strip and multiply by 6.
Normal adult resting heart rate: 60-100 bpm
2. Rhythm
Check for sinus rhythm:
- Every QRS is preceded by a P wave
- P waves are upright in leads I and aVF (normal P axis)
- Regular R-R intervals (minor respiratory variation is normal - sinus arrhythmia)
If P waves are absent, inverted, or not related to QRS complexes, an abnormal rhythm is present.
3. Axis
The QRS axis reflects the overall direction of ventricular depolarization in the frontal plane.
Quick method using leads I and aVF:
| Lead I | aVF | Axis |
|---|---|---|
| Positive | Positive | Normal (0° to +90°) |
| Positive | Negative | Left axis deviation (LAD) |
| Negative | Positive | Right axis deviation (RAD) |
| Negative | Negative | Extreme axis deviation |
Normal axis: -30° to +90°
Left axis deviation (LAD): more negative than -30° (seen in left anterior fascicular block, inferior MI, LBBB)
Right axis deviation (RAD): more positive than +90° (seen in right ventricular hypertrophy, pulmonary embolism, RBBB)
4. P Wave Morphology
- Normal duration: <0.12 seconds (3 small boxes)
- Normal amplitude: <2.5 mm
- Should be upright in leads I, II, aVF; inverted in aVR
- Biphasic P in V1: normal; large terminal negative component suggests left atrial enlargement
- Tall, peaked P (P pulmonale): right atrial enlargement (>2.5 mm in II)
- Broad, notched P (P mitrale): left atrial enlargement (>0.12 s)
5. PR Interval
- Short PR (<120 ms): pre-excitation (WPW), accelerated AV conduction
- Long PR (>200 ms): 1st degree AV block (conduction delay at the AV node)
6. QRS Complex
- Normal duration: ≤110 ms
- Wide QRS (>120 ms): bundle branch block, ventricular rhythm, hyperkalemia, drugs (Na-channel blockers)
- Q waves: small septal Q waves are normal in lateral leads; pathological Q waves are ≥40 ms wide or ≥1/4 R wave height (suggest prior MI)
- R-wave progression: R waves should increase from V1 to V5/V6 (dominant S in V1, dominant R in V5/V6)
7. ST Segment
Normally isoelectric (flat, at baseline). The J point marks the start of the ST segment.
- ST elevation: myocardial infarction (STEMI), pericarditis, early repolarization, Brugada syndrome
- ST depression: ischemia, reciprocal change, digoxin effect, hypokalemia
8. T Wave
- Normally upright in I, II, V3-V6; inverted in aVR
- Tall, peaked T waves: hyperkalemia (earliest ECG sign), early MI
- T wave inversion: ischemia, ventricular hypertrophy, bundle branch block, PE
9. QT Interval
The QT interval must be corrected for heart rate (QTc). Prolonged QTc raises risk of torsades de pointes.
Causes of long QT: hypokalemia, hypomagnesemia, hypocalcemia, amiodarone, sotalol, antipsychotics, congenital LQTS
The action potential correlates are: QRS onset = phase 0 (rapid Na+ upstroke); ST segment = phase 2 (plateau); T wave = phase 3 (repolarization). Drugs that block Na+ channels widen the QRS; drugs that prolong phase 2 or 3 lengthen the QT.
- Harrison's Principles of Internal Medicine 22E
10. The 12-Lead ECG: What Each Lead "Sees"
The 12 leads view the heart from 12 different angles:
Limb leads (frontal plane):
| Leads | View |
|---|---|
| I, aVL | Lateral (left side) |
| II, III, aVF | Inferior (bottom) |
| aVR | Cavity (normally negative) |
Precordial leads (horizontal plane):
| Leads | View |
|---|---|
| V1, V2 | Right ventricle/septum |
| V3, V4 | Anterior wall |
| V5, V6 | Lateral wall |
A change seen in a specific lead group localizes pathology to that wall of the heart.
Systematic Reading Approach (Summary Checklist)
- Rate - fast, normal, slow?
- Rhythm - regular/irregular, sinus or not?
- Axis - normal, LAD, RAD?
- Intervals - PR, QRS, QT/QTc within normal limits?
- P waves - present, morphology normal, 1:1 with QRS?
- QRS complex - width, R-wave progression, Q waves?
- ST segment - elevated, depressed, or flat?
- T waves - upright, inverted, peaked?
- U waves - present? (prominent in hypokalemia)
- Overall impression - correlate with clinical context
Sources: Guyton and Hall Textbook of Medical Physiology; Harrison's Principles of Internal Medicine 22E; Harriet Lane Handbook (The Johns Hopkins Hospital, 23rd ed.); Braunwald's Heart Disease
This is a shared conversation. Sign in to Orris to start your own chat.