Lobar pneumonia
Reading File
Finding Sources
Searching PubMed
"lobar pneumonia" AND "community-acquired pneumonia"
Finding Sources
Reading File
Reading File
Finding Sources
Reading File
Reading File
Reading File
Reading File
Loading Image
Loading Image
Loading Image
Loading Image
Here is a comprehensive overview of lobar pneumonia drawn from Robbins Pathology, Robbins & Kumar Basic Pathology, Fishman's Pulmonary Diseases and Disorders, and Grainger & Allison's Diagnostic Radiology.
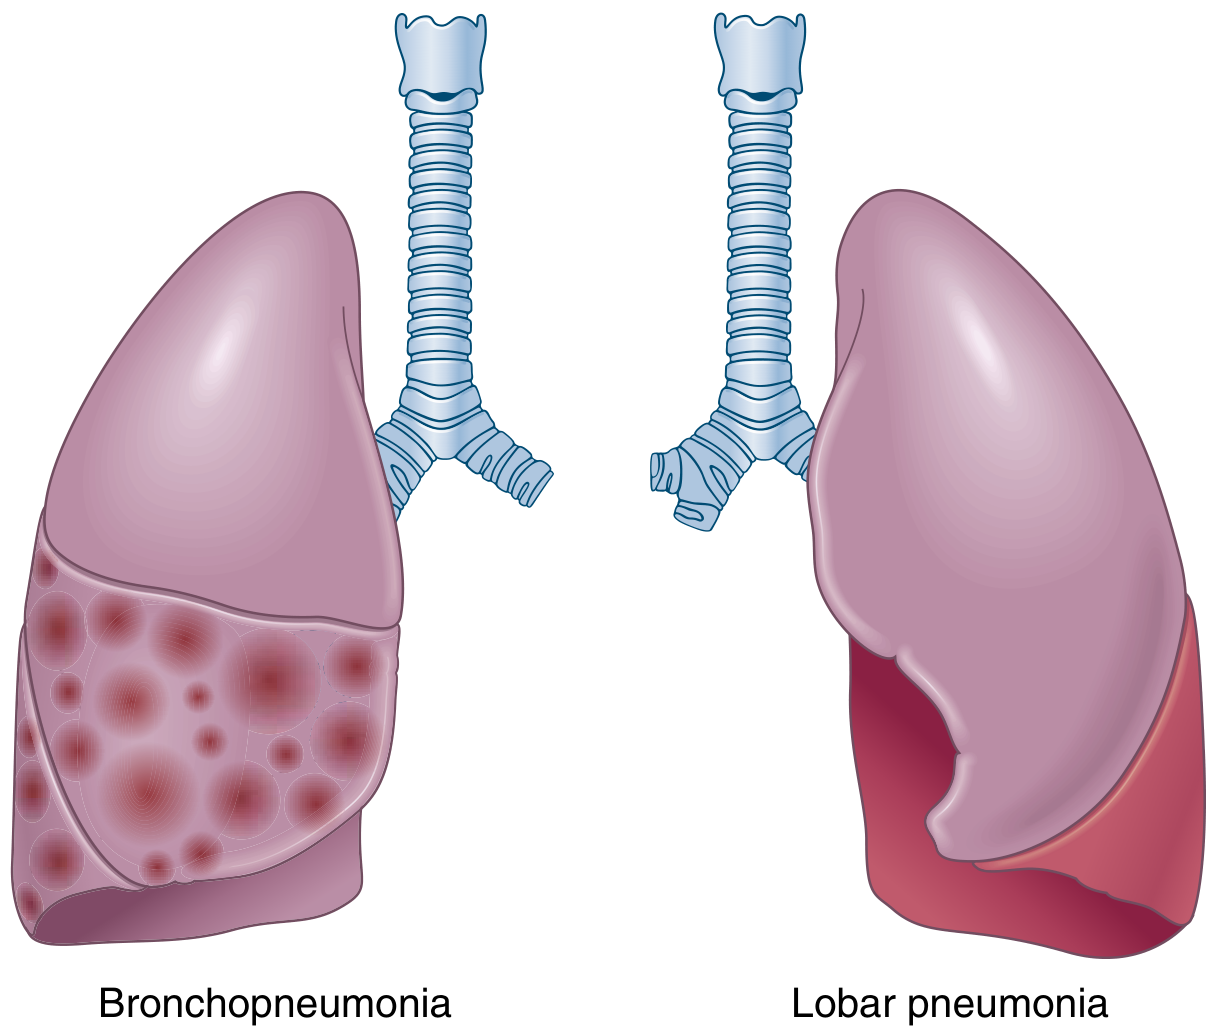
Lobar Pneumonia
Definition
Lobar pneumonia is defined by consolidation of a large portion of, or an entire, pulmonary lobe due to bacterial infection. It is distinguished from bronchopneumonia, which produces patchy, multifocal consolidation. The two patterns can overlap — patchy involvement may become confluent and evolve into full lobar consolidation.
Etiology / Common Organisms
| Organism | Key Points |
|---|---|
| Streptococcus pneumoniae | Most common cause; ~1/3 of all CAP. Peaks in winter/spring; risk factors include extremes of age, chronic cardiopulmonary disease, alcoholism, immunosuppression, asplenia |
| Klebsiella pneumoniae | Most common gram-negative cause (0.5–5% of pneumonias); classically right upper lobe; produces bulging fissure, dense consolidation, early abscess; affects debilitated/alcoholic patients |
| Legionella species | Common severe CAP in immunocompetent hosts; exposure via contaminated water systems; may rapidly progress to full lobar or bilobar disease |
| Haemophilus influenzae | Particularly in COPD patients |
| Other bacterial causes | Staphylococcus aureus (cavitation), anaerobes, gram-negative aerobes |
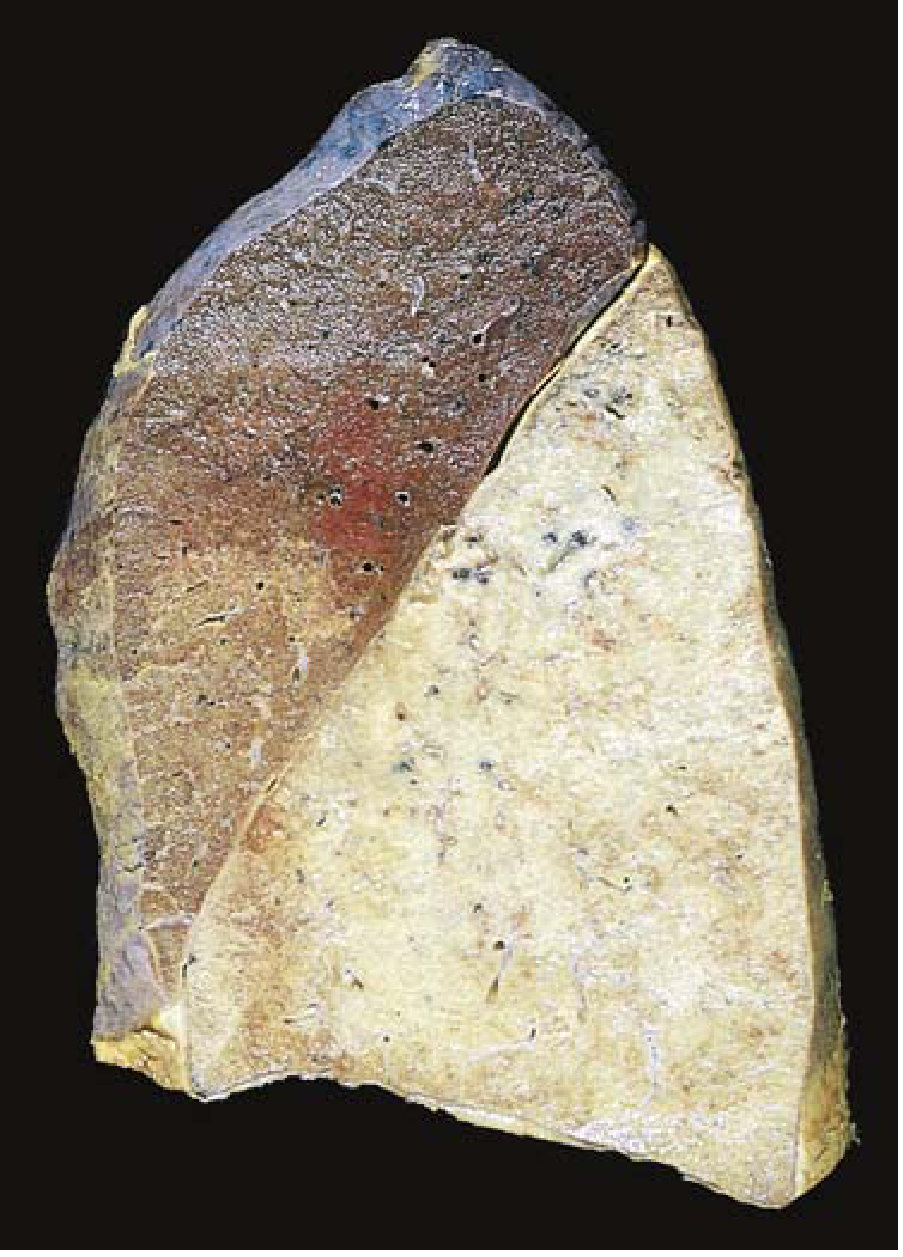
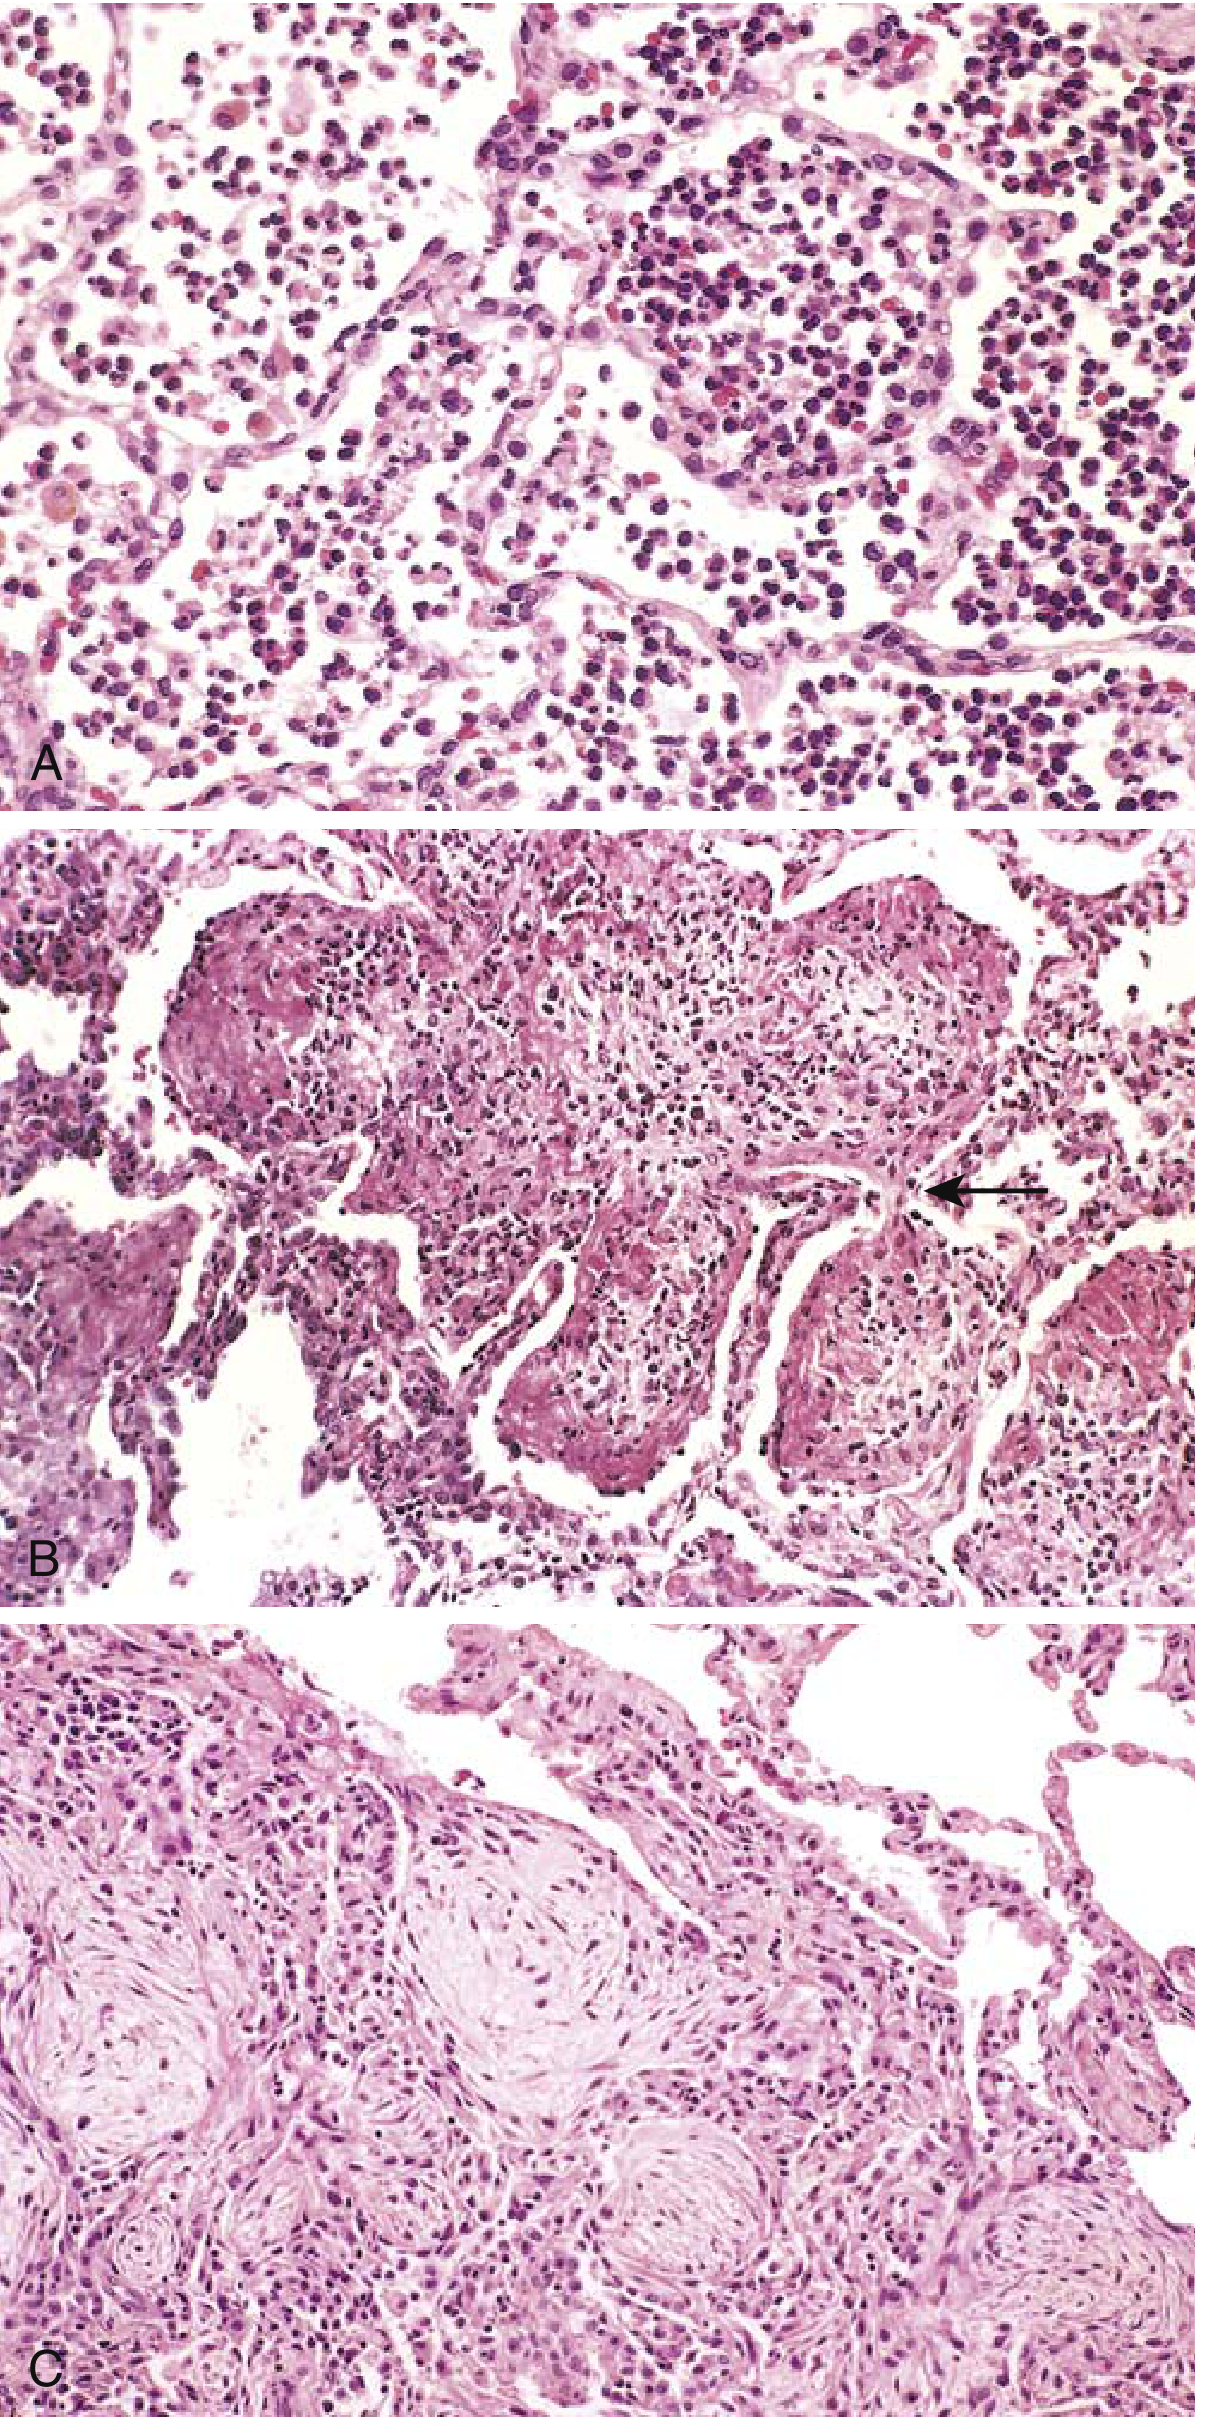
Pathology — The Four Classic Stages
Lobar pneumonia classically progresses through four sequential stages:
1. Congestion
- Lung is heavy, boggy, and red
- Vascular engorgement, intraalveolar edema fluid with few neutrophils
- Bacteria often numerous
2. Red Hepatization
- Massive confluent exudation: neutrophils + red blood cells + fibrin fill alveolar spaces
- Gross: lobe is red, firm, airless, with liver-like consistency (hence "hepatization")
3. Gray Hepatization
- Progressive disintegration of red cells
- Persistence of fibrinopurulent exudate
- Color shifts to grayish-brown
4. Resolution
- Exudate is broken down by enzymatic digestion → granular, semifluid debris
- Debris is resorbed, ingested by macrophages, expectorated, or organized by fibroblasts
- If extension to pleura → fibrinous pleuritis; may leave fibrous thickening or adhesions
Clinical Features
- Abrupt onset of high fever, shaking chills
- Productive cough with mucopurulent sputum (may be rust-colored/hemoptysis in pneumococcal disease)
- Pleuritic chest pain and pleural friction rub when pleuritis is present
- In the elderly, classic features may be absent; may mimic CHF, PE, or malignancy
Radiology
Chest X-ray:
- Homogeneous, nonsegmental consolidation confined to one lobe
- Entire lobe is radiopaque in lobar pneumonia (vs. focal opacities in bronchopneumonia)
- Air bronchogram — airways made visible by surrounding alveolar filling — is characteristic
- Volume loss is absent or minimal in the acute stage; minor atelectasis may develop from bronchial obstruction by exudate
- Pleural effusion in up to 50% of cases (highly suggestive of bacterial process when large)
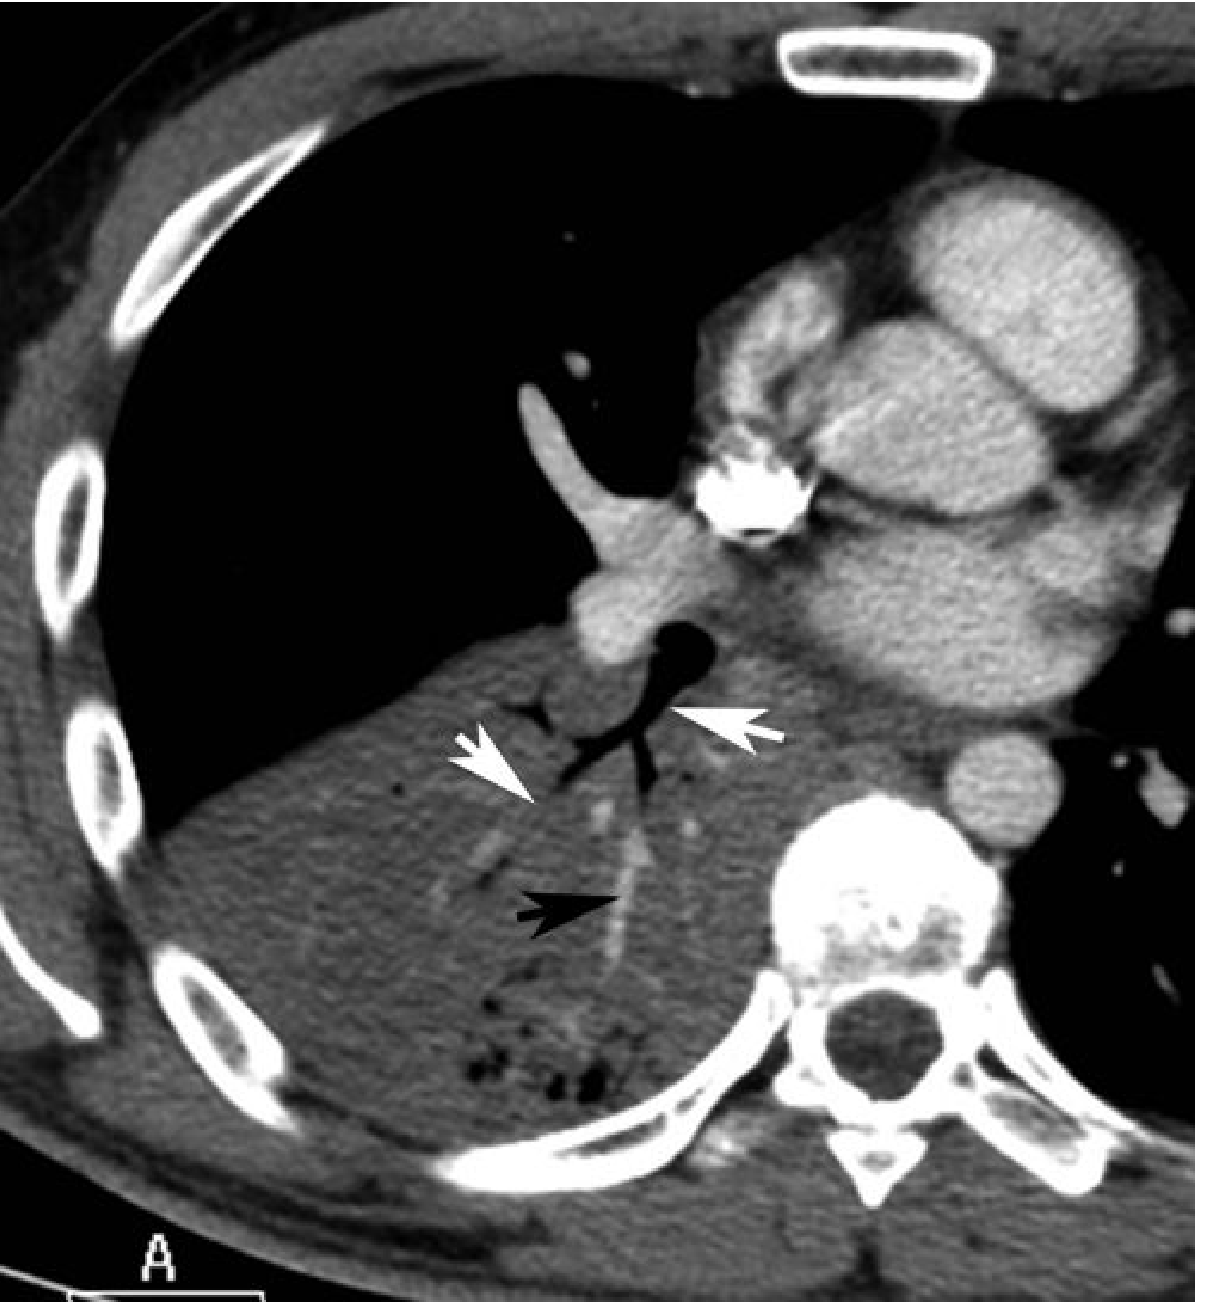
CT scan:
- Dense parenchymal consolidation with air bronchograms
- The CT angiogram sign — enhancement of branching pulmonary vessels within a homogeneous low-attenuation consolidation — can occur in lobar pneumonia (originally described in lepidic adenocarcinoma)
- Klebsiella: bulging fissure sign, early necrosis/abscess
Radiographic interpretation caveat: Significant interobserver variation exists among radiologists distinguishing bacterial vs. non-bacterial pneumonia on CXR alone. Interstitial infiltrates are more typical of viral/atypical causes, but this is not definitive.
Complications
- Lung abscess — tissue destruction/necrosis (especially Klebsiella, Staphylococcus)
- Empyema — spread of infection to the pleural space → intrapleural fibrinopurulent reaction
- Bacteremic dissemination → endocarditis, meningitis, brain/renal/splenic abscesses, suppurative arthritis, pericarditis
Treatment
- Effective antibiotics markedly alter the clinical course; treated patients often become afebrile within 48–72 hours
- Identification of the causative organism and antibiotic sensitivity testing are the keystones of therapy
- Mortality in hospitalized patients is <10%; most deaths result from complications (empyema, meningitis, endocarditis) or underlying debility/alcoholism
Sources: Robbins & Kumar Basic Pathology (p. 470–471) | Robbins, Cotran & Kumar Pathologic Basis of Disease | Fishman's Pulmonary Diseases and Disorders | Grainger & Allison's Diagnostic Radiology
Explain ABG from Harrison book of medicine
Reading File
Finding Sources
Finding Sources
Finding Sources
Reading File
Reading File
Reading File
Reading File
Reading File
Loading Image
Reading File
I now have comprehensive content from Harrison's. Let me compile the full response.
Arterial Blood Gas (ABG) — Harrison's Principles of Internal Medicine (22nd Ed., 2025)
1. Normal Acid-Base Homeostasis
Systemic arterial pH is maintained between 7.35 and 7.45 by:
- Extracellular and intracellular chemical buffering
- Respiratory regulation of PaCO₂ (CNS control)
- Renal regulation of plasma HCO₃⁻
The relationship is described by the Henderson-Hasselbalch equation:
$$\text{pH} = \text{pK'} + \log_{10} \frac{[\text{HCO}3^-]}{\alpha{\text{CO}_2} \times \text{PaCO}_2}$$
where dissolved CO₂ (mmol/L) = 0.03 × PaCO₂ (mmHg), and pK' = 6.1.
Normal steady-state PaCO₂ ≈ 40 mmHg. Underexcretion → hypercapnia; overexcretion → hypocapnia. Hypercapnia is usually from hypoventilation, not increased CO₂ production.
2. Normal ABG Values
| Parameter | Normal Range |
|---|---|
| pH | 7.35 – 7.45 |
| PaCO₂ | 35 – 45 mmHg |
| HCO₃⁻ | 22 – 26 mmol/L |
| PaO₂ | 80 – 100 mmHg |
In clinical laboratory reporting, pH and PaCO₂ are directly measured; HCO₃⁻ is calculated from the Henderson-Hasselbalch equation. This calculated HCO₃⁻ must match the measured total CO₂ on the electrolyte panel within ±2 mmol/L. A discrepancy suggests simultaneous sampling error or laboratory error.
3. Stepwise Approach to ABG Interpretation
Harrison's Table 36-3 — Steps in Accurate Diagnosis of Acid-Base Disorders:
- Obtain ABG and venous electrolytes simultaneously (before therapy)
- Compare calculated HCO₃⁻ (from ABG) with measured HCO₃⁻ (electrolyte panel) — should agree within ±2 mmol/L
- Assess the Anion Gap (AG) — correct for albumin if hypoalbuminemia present; high AG if >10 mEq/L
- Identify causes of high-AG acidosis (ketoacidosis, lactic acidosis, renal failure, toxic alcohols)
- Identify causes of non-gap acidosis (GI bicarbonate loss, renal tubular acidosis)
- Estimate predicted compensatory response (Table below)
- Compare delta values (ΔAG vs. ΔHCO₃⁻)
- Compare change in [Cl⁻] with change in [Na⁺] on the electrolyte panel
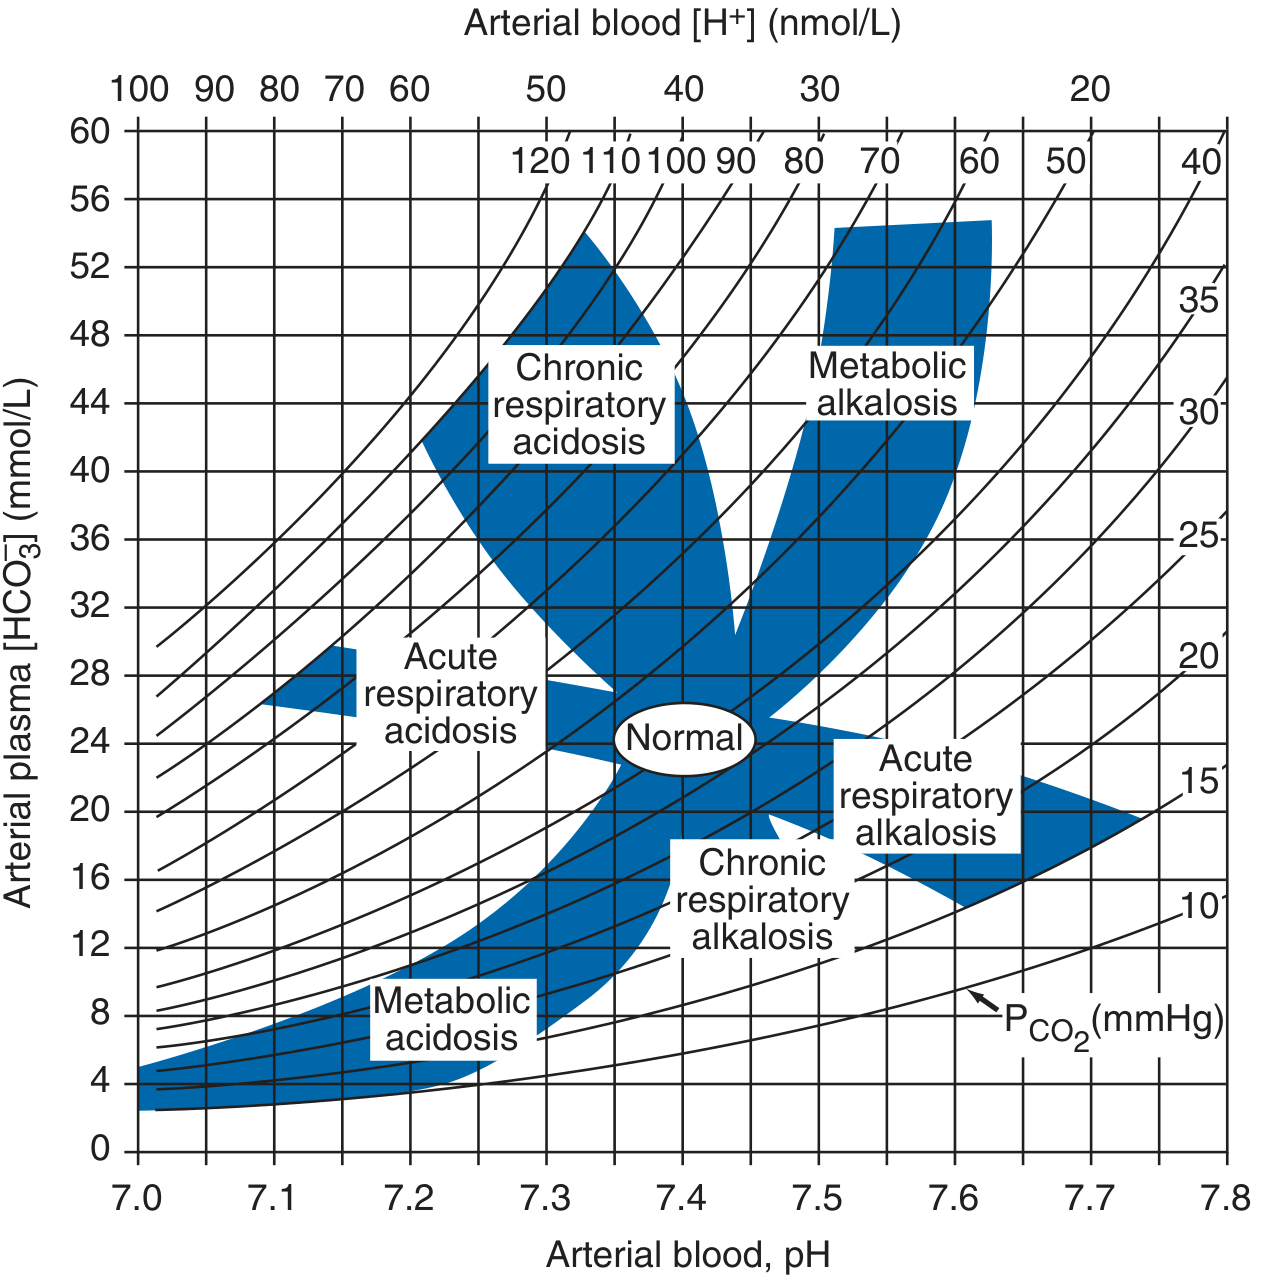
4. The Four Primary Acid-Base Disorders
A. Metabolic Acidosis
- ↓ pH, ↓ HCO₃⁻, ↓ PaCO₂ (respiratory compensation)
- Causes: increased endogenous acid production (lactate, ketoacids), HCO₃⁻ loss (diarrhea), or failure of renal acid excretion (CKD)
- Effects: increased ventilation, myocardial depression, peripheral vasodilation, CNS depression (headache, lethargy, coma), glucose intolerance
B. Metabolic Alkalosis
- ↑ pH, ↑ HCO₃⁻, ↑ PaCO₂ (hypoventilation as compensation)
C. Respiratory Acidosis
- ↓ pH, ↑ PaCO₂, ↑ HCO₃⁻ (renal compensation)
- Acute vs. chronic (degree of HCO₃⁻ rise differs)
D. Respiratory Alkalosis
- ↑ pH, ↓ PaCO₂, ↓ HCO₃⁻ (renal compensation)
- Exception: Chronic respiratory alkalosis may return pH fully to normal — the only disorder where full compensation to normal pH occurs
5. Predicted Compensatory Responses (Harrison's Table 58-1)
| Disorder | Compensation Formula | pH | HCO₃⁻ | PaCO₂ |
|---|---|---|---|---|
| Metabolic acidosis | PaCO₂ = (1.5 × HCO₃⁻) + 8 ± 2 (Winter's equation) or PaCO₂ ↓ 1.25 mmHg per mmol/L ↓ HCO₃⁻ | ↓ | ↓ | ↓ |
| Metabolic alkalosis | PaCO₂ ↑ 0.75 mmHg per mmol/L ↑ HCO₃⁻ | ↑ | ↑ | ↑ |
| Acute resp. alkalosis | HCO₃⁻ ↓ 0.2 mmol/L per mmHg ↓ PaCO₂ | ↑ | ↓ | ↓ |
| Chronic resp. alkalosis | HCO₃⁻ ↓ 0.4 mmol/L per mmHg ↓ PaCO₂ | ↑ | ↓ | ↓ |
| Acute resp. acidosis | HCO₃⁻ ↑ 0.1 mmol/L per mmHg ↑ PaCO₂ | ↓ | ↑ | ↑ |
| Chronic resp. acidosis | HCO₃⁻ ↑ 0.4 mmol/L per mmHg ↑ PaCO₂ | ↓ | ↑ | ↑ |
Key rule: Compensatory responses move PaCO₂ and HCO₃⁻ in the same direction as the primary change. If PaCO₂ and HCO₃⁻ move in opposite directions, a mixed disorder is present.
6. The Anion Gap (AG)
$$\text{AG} = \text{Na}^+ - (\text{Cl}^- + \text{HCO}_3^-)$$
- Normal AG: 6–12 mmol/L (average ~10 mmol/L)
- Normal unmeasured anions: albumin, phosphate, sulfate, organic anions
Causes of elevated AG:
- Accumulation of acid anions (lactate, ketoacids, uremic acids, toxic alcohols, salicylates)
Causes of decreased AG:
- ↑ unmeasured cations (lithium, calcium, magnesium, cationic immunoglobulins)
- ↓ albumin (nephrotic syndrome, liver disease, malabsorption)
- Hyperviscosity / severe hyperlipidemia
Albumin correction for AG:
For every 1 g/dL albumin below 4.5 g/dL, add 2.5 mmol/L to the measured AG. Example: albumin 2.5 g/dL (2 below normal), uncorrected AG 15 → corrected AG = 15 + (2 × 2.5) = 20 mmol/L
High-AG Metabolic Acidosis — Causes (MUDPILES):
| Category | Examples |
|---|---|
| Lactic acidosis | Sepsis, shock, hepatic failure |
| Ketoacidosis | Diabetic, alcoholic, starvation |
| Renal failure | Uremic acid accumulation |
| Toxins | Ethylene glycol, methanol, salicylates, propylene glycol |
7. Delta-Delta (Δ/Δ) Ratio — Detecting Mixed Disorders
When high-AG metabolic acidosis is present, compare:
- ΔAG = patient's AG − 10 (normal AG)
- ΔHCO₃⁻ = 25 − patient's HCO₃⁻
Normally, every mmol rise in AG should cause a ~1 mmol fall in HCO₃⁻. If:
- ΔAG >> ΔHCO₃⁻ → concurrent metabolic alkalosis masking the acidosis
- ΔAG << ΔHCO₃⁻ → concurrent non-gap acidosis (e.g., RTA + lactic acidosis)
Clinical example from Harrison's: An alcoholic with vomiting (metabolic alkalosis, HCO₃⁻ = 40) develops ketoacidosis — pH returns to 7.40, HCO₃⁻ to 25, PaCO₂ to 40 mmHg (all "normal") — but AG is 30. ΔHCO₃⁻ = 0, ΔAG = 20. This unmasks a covert mixed metabolic alkalosis + high-AG acidosis.
8. Mixed Acid-Base Disorders (Harrison's Table 3-2)
| Combination | Clue | Clinical Example |
|---|---|---|
| Met. acidosis + Resp. alkalosis | PaCO₂ below predicted (Winter's) | Lactic acidosis/sepsis in ICU |
| Met. acidosis + Resp. acidosis | PaCO₂ above predicted | Severe pneumonia, pulmonary edema |
| Met. alkalosis + Resp. alkalosis | PaCO₂ doesn't ↑ as predicted; pH very high | End-stage liver disease + diuretics |
| Met. alkalosis + Resp. acidosis | PaCO₂ high, pH normal despite both abnormal | COPD patient on diuretics |
| High-AG + Normal-AG acidosis | ΔHCO₃⁻ >> ΔAG | Diarrhea + lactic acidosis; toluene toxicity |
| High-AG acidosis + Met. alkalosis | ΔAG >> ΔHCO₃⁻; normal pH, normal HCO₃⁻ | Uremia + vomiting |
Changes in PaCO₂ and HCO₃⁻ in opposite directions always indicate a mixed disorder.
9. Treatment Principle
Treatment of metabolic acidosis with alkali (e.g., NaHCO₃) should be reserved for severe acidemia, unless the patient lacks "potential HCO₃⁻" in plasma (i.e., the accumulated acid anion is non-metabolizable, as in renal failure or toxic ingestion). With metabolizable anions (lactate, ketoacids), correcting the underlying cause regenerates HCO₃⁻.
Source: Harrison's Principles of Internal Medicine, 22nd Edition (2025, McGraw Hill Medical) — Chapter 58: Fluid, Electrolyte, and Acid-Base Disorders
This is a shared conversation. Sign in to Orris to start your own chat.