Explain me 10 common heart disease with ecg changes and ecg images of those disease
Reading File
Finding Sources
Finding Sources
Searching Images
ECG electrocardiogram myocardial infarction ST elevation STEMI
Searching Images
atrial fibrillation ECG irregular rhythm absent P waves
Searching Images
complete heart block third degree AV block ECG
Searching Images
left ventricular hypertrophy ECG voltage criteria
Finding Sources
Finding Sources
Searching Images
Wolff-Parkinson-White syndrome ECG delta wave short PR interval
Searching Images
pericarditis ECG saddle-shaped ST elevation diffuse PR depression
Searching Images
ventricular tachycardia ECG wide QRS complex
Searching Images
pulmonary embolism ECG S1Q3T3 right heart strain
Searching Images
hypertrophic cardiomyopathy ECG deep Q waves LVH strain
Searching Images
heart failure dilated cardiomyopathy ECG bundle branch block LBBB
Here is a comprehensive guide to 10 common heart diseases with their ECG changes and representative ECG images.
10 Common Heart Diseases: ECG Changes & Images
1. 🫀 ST-Elevation Myocardial Infarction (STEMI)
ECG Changes
- Hyperacute T-waves (earliest sign — tall, peaked, broad-based)
- ST-segment elevation ≥1 mm in ≥2 contiguous limb leads, or ≥2 mm in ≥2 contiguous precordial leads
- Reciprocal ST depression in opposing leads
- Pathological Q waves (evolve within hours; indicate transmural necrosis)
- T-wave inversion (late phase)
- ST elevation morphology is typically convex ("tombstone") upward
Localisation by leads:
| Territory | Leads with ST↑ | Artery |
|---|---|---|
| Anterior | V1–V4 | LAD |
| Inferior | II, III, aVF | RCA |
| Lateral | I, aVL, V5–V6 | LCx |
| Posterior | V7–V9 (ST depression V1–V3) | RCA/LCx |
Anterior STEMI: Pronounced ST elevation with "tombstone" morphology in V2–V5, evolving QS waves, consistent with proximal LAD occlusion.
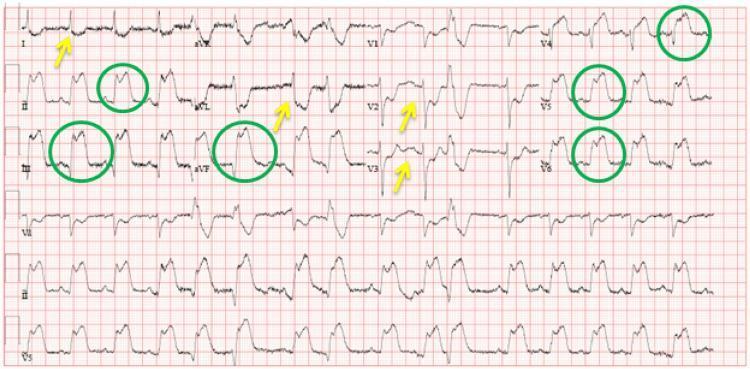
Inferolateral STEMI: ST elevation (green circles) in II, III, aVF, V4–V6; reciprocal ST depression (yellow arrows) in I, aVL, V2–V3.
2. 🫀 Non-ST Elevation Myocardial Infarction (NSTEMI) / Unstable Angina
ECG Changes
- ST depression ≥0.5 mm in ≥2 contiguous leads (horizontal or downsloping)
- T-wave inversion (symmetric, deep; especially in anterior leads)
- Transient ST elevation (resolves within 20 min; Prinzmetal variant)
- No pathological Q waves (no full-thickness necrosis)
- ECG may be normal in up to 5% of cases — troponin is key
3. 🫀 Atrial Fibrillation (AF)
ECG Changes
- Absent P waves — replaced by chaotic fibrillatory (f) waves at 350–600/min, best seen in V1 and II
- Irregularly irregular R-R intervals (hallmark sign)
- Narrow QRS complexes (unless aberrant conduction/bundle branch block)
- Ventricular rate typically 100–160/min if uncontrolled (AF with RVR)
- Baseline undulation (fine or coarse fibrillatory waves)
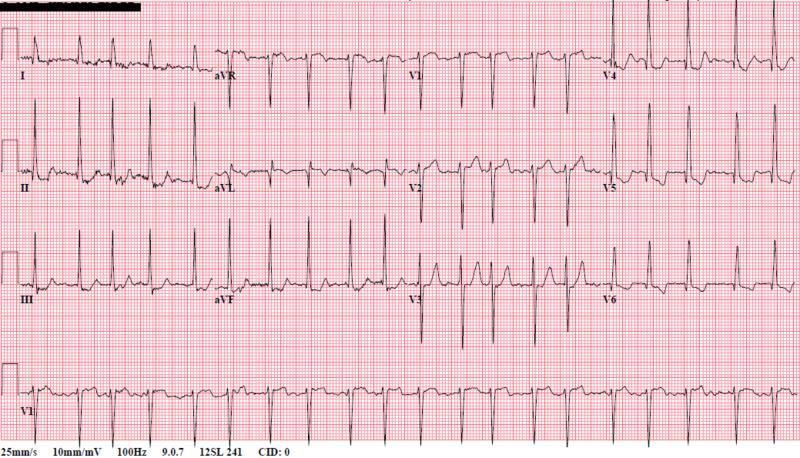
AF with RVR: Absent P waves replaced by chaotic baseline, irregularly irregular QRS complexes, narrow morphology indicating supraventricular origin.
4. 🫀 Complete (Third-Degree) AV Block
ECG Changes
- Complete AV dissociation: P waves and QRS complexes fire independently
- Regular P waves at normal atrial rate (60–100/min)
- Regular, slow QRS escape rhythm (40–60/min if junctional; <40/min if ventricular)
- Wide QRS if escape is ventricular in origin (>120 ms)
- Narrow QRS if escape pacemaker is junctional (above His bundle)
- No fixed PR interval — P waves "march through" the QRS and T waves
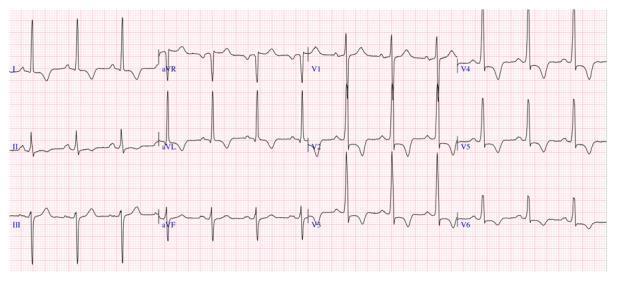
Complete heart block: Regular P waves (faster rate) with no relationship to wide QRS escape complexes (~55 bpm). Classic AV dissociation.
5. 🫀 Wolff-Parkinson-White (WPW) Syndrome
ECG Changes
The classic WPW triad:
- Short PR interval (<120 ms) — bypass tract bypasses AV node delay
- Delta wave — slurred, slow upstroke at the start of QRS
- Widened QRS (>120 ms) — due to fusion of conducted and pre-excited beats
Additional findings:
- Pseudo-infarction Q waves (negative delta waves in inferior leads may mimic inferior MI)
- Secondary ST-T changes (discordant to QRS direction)
- Risk of AVRT (supraventricular tachycardia) — narrow-complex orthodromic or wide-complex antidromic
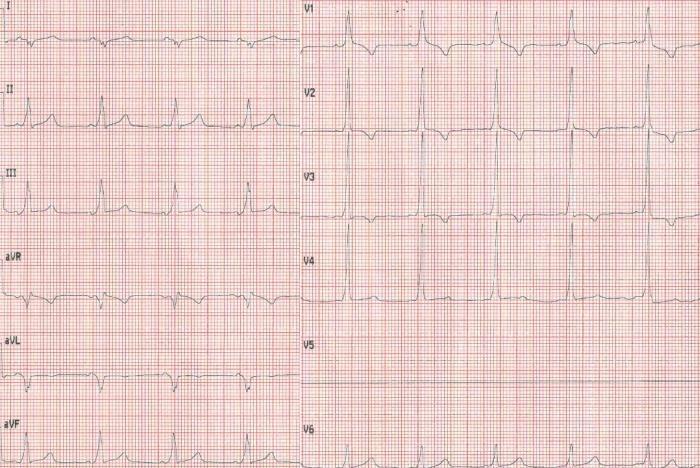
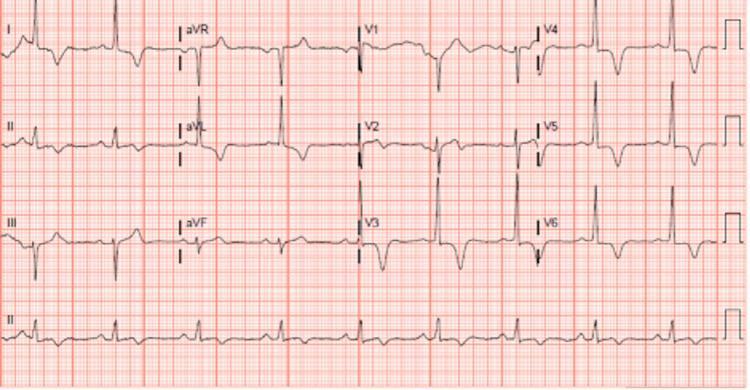
WPW: Short PR interval, prominent delta waves (slurred QRS upstroke) in II, III, aVF, and V2–V6 — classic triad of pre-excitation.
6. 🫀 Acute Pericarditis
ECG Changes (four stages):
| Stage | Finding |
|---|---|
| I (days 1–2) | Diffuse concave ("saddle-shaped") ST elevation in most leads; PR depression in II, V4–V6; PR elevation in aVR |
| II (days 3–7) | ST returns to baseline; T waves flatten |
| III (weeks 1–3) | Diffuse T-wave inversions |
| IV (months) | ECG normalises |
Key differentiator from STEMI:
- ST elevation is diffuse (multiple territories, not one coronary distribution)
- ST morphology is concave (smile-shaped), not convex
- PR depression is highly specific for pericarditis
- No reciprocal ST depression (except in aVR)
- Spodick's sign — downsloping TP segment

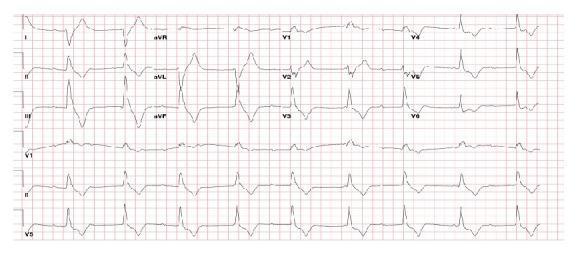
Acute pericarditis: Diffuse concave ST elevation in I, II, III, aVF, V2–V6; PR depression in II; reciprocal ST depression and PR elevation in aVR — classic stage I findings.
7. 🫀 Ventricular Tachycardia (VT)
ECG Changes
- Regular wide-complex tachycardia — QRS >120 ms, rate 100–250/min
- Monomorphic (uniform QRS) vs Polymorphic (varying QRS — e.g., Torsades de Pointes)
- AV dissociation — independent P waves marching through QRS (pathognomonic for VT)
- Fusion beats — hybrid QRS from simultaneous sinus + ventricular depolarisation
- Capture beats — narrow QRS during VT when sinus impulse conducts normally (confirms VT)
- Positive concordance V1–V6 (all positive) or negative concordance (all negative) strongly suggest VT
- Northwest axis (QRS negative in both I and aVF)

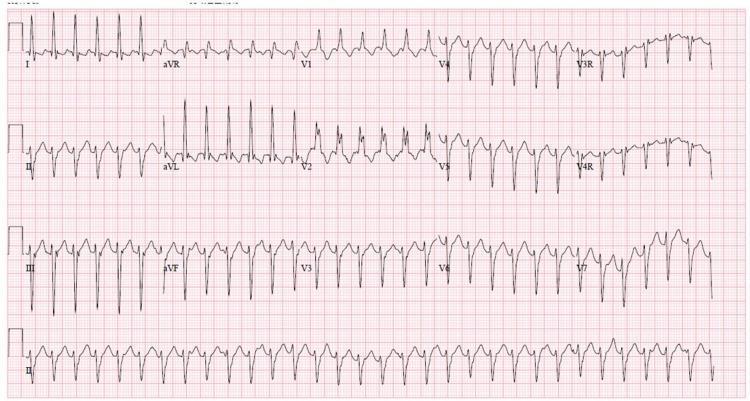
VT with RBBB morphology and left axis deviation — characteristic of idiopathic left ventricular fascicular tachycardia (Belhassen tachycardia).
8. 🫀 Pulmonary Embolism (PE)
ECG Changes
Most common finding is sinus tachycardia. Classic (but low sensitivity ~20%) pattern:
- S1Q3T3: Deep S wave in lead I + Q wave in lead III + inverted T wave in lead III
- Right axis deviation
- Incomplete or complete RBBB (right ventricular strain)
- T-wave inversions in V1–V4 (right ventricular strain pattern)
- P pulmonale (tall peaked P waves in II — right atrial enlargement)
- Atrial fibrillation (acute-onset)
- Normal ECG does not rule out PE
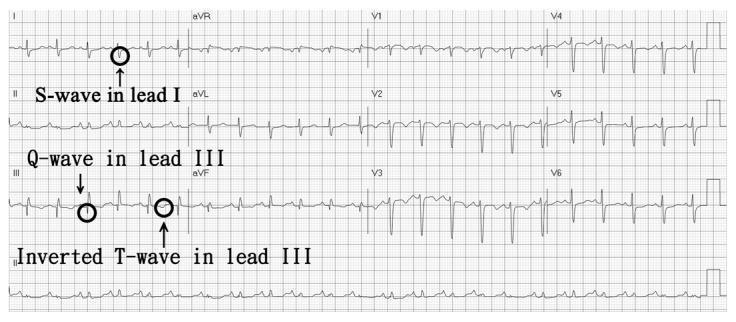
Acute PE: Annotated S1Q3T3 — prominent S wave in lead I, Q wave and inverted T wave in lead III. Sinus tachycardia and right ventricular strain.
Acute PE: S1Q3T3 + T-wave inversions in inferior leads and V1–V3 + incomplete RBBB (QRS 110 ms) — classic right ventricular strain pattern.
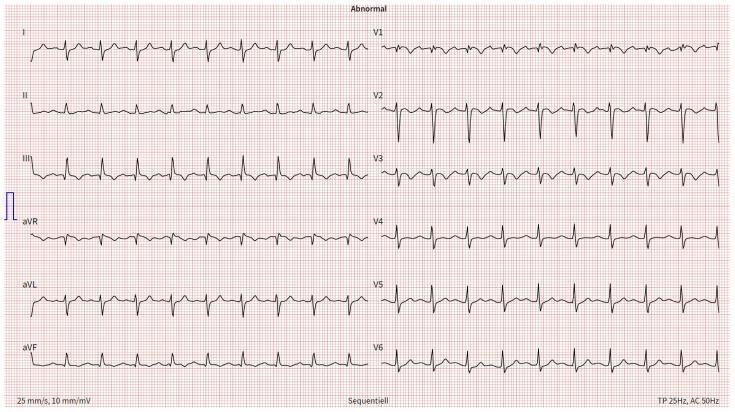
9. 🫀 Hypertrophic Cardiomyopathy (HCM)
ECG Changes
- Left ventricular hypertrophy (LVH) voltage criteria: S in V1 + R in V5/V6 ≥35 mm (Sokolow-Lyon); R in aVL ≥12 mm (Cornell)
- Deep, narrow ("dagger") Q waves in lateral and inferior leads (I, aVL, V5–V6) — due to septal hypertrophy
- Giant negative T-waves in precordial leads (especially apical HCM — Yamaguchi syndrome; V3–V5, depth >10 mm)
- Left axis deviation
- ST depression with strain pattern (lateral leads)
- WPW-like delta waves occasionally seen
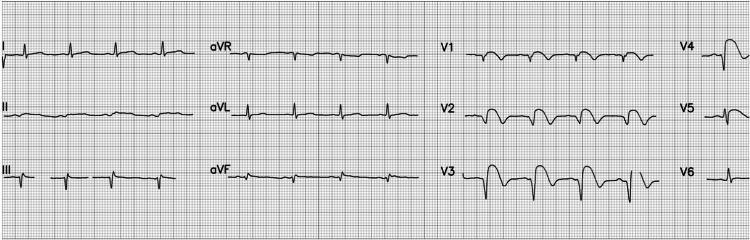
Apical HCM: Deep symmetric T-wave inversions in V3–V6, II, III, aVF — classic "giant T-wave inversion" pattern of apical (Yamaguchi) HCM.
Septal HCM: High R-wave voltages in V2–V4, ST depression, deep T-wave inversions in V2–V6, positive T in aVR (associated with arrhythmic risk).
10. 🫀 Dilated Cardiomyopathy / Heart Failure
ECG Changes
- Left bundle branch block (LBBB): QRS ≥120 ms; broad monophasic R in I, aVL, V5–V6; deep QS in V1–V3; discordant ST-T changes
- Poor R-wave progression (V1–V4) — loss of septal forces
- Left atrial enlargement: Bifid P wave in II (P mitrale), negative terminal P force in V1
- Non-specific ST-T changes (diffuse repolarisation abnormalities)
- Sinus tachycardia (compensatory)
- Frequent PVCs (ventricular irritability)
- Left axis deviation
- Low voltage (if associated pericardial effusion or obesity/emphysema)

LBBB in DCM: Wide QRS (>120 ms), broad R waves in I, aVL, V5–V6 with deep QS in V1–V3. Secondary ST-T inversions discordant to QRS — characteristic of dyssynchronous ventricular activation.
Quick Reference Summary
| # | Disease | Key ECG Findings |
|---|---|---|
| 1 | STEMI | ST elevation (convex), Q waves, reciprocal ST depression |
| 2 | NSTEMI | ST depression, T-wave inversion, no Q waves |
| 3 | Atrial Fibrillation | Absent P waves, irregularly irregular RR |
| 4 | Complete AV Block | P-QRS dissociation, slow escape rhythm |
| 5 | WPW Syndrome | Short PR, delta waves, widened QRS |
| 6 | Acute Pericarditis | Diffuse concave ST elevation, PR depression |
| 7 | Ventricular Tachycardia | Wide QRS tachycardia, AV dissociation, concordance |
| 8 | Pulmonary Embolism | S1Q3T3, sinus tachycardia, RV strain |
| 9 | Hypertrophic CM | LVH voltage, deep Q waves, giant T inversions |
| 10 | Dilated CM / Heart Failure | LBBB, poor R progression, left atrial enlargement |
Clinical Note: ECG findings must always be interpreted in conjunction with clinical history, physical examination, and biomarkers (troponin, BNP). An ECG alone does not confirm or exclude most diagnoses. When in doubt, repeat the ECG and perform echocardiography.
This is a shared conversation. Sign in to Orris to start your own chat.