
Give me detailed comparison between type 1 diabetes mellitus vs type 2 diabetes mellitus.
Give me detailed comparison between type 1 diabetes mellitus vs type 2 diabetes mellitus.
type 1 vs type 2 diabetes mellitus comparison pathophysiology
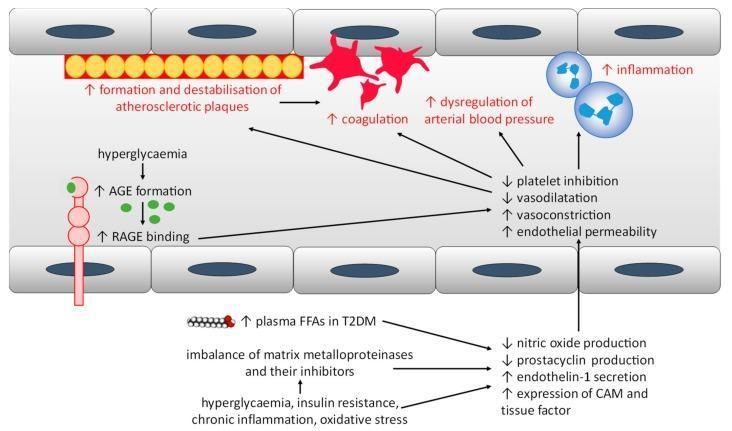
A pathophysiology diagram illustrating the mechanisms of endothelial dysfunction and increased cardiovascular risk in Type 1 and Type 2 Diabetes Mellitus. The diagram shows a cross-section of a blood vessel lined with endothelial cells. The upper section depicts pathological outcomes including the formation and destabilization of atherosclerotic plaques, increased coagulation (platelet aggregation), dysregulation of arterial blood pressure, and increased inflammation. Centrally, a list summarizes the resulting vascular environment: decreased platelet inhibition and vasodilation, alongside increased vasoconstriction and endothelial permeability. The lower section outlines the biochemical triggers: hyperglycemia leading to advanced glycation end-product (AGE) formation and RAGE binding; elevated plasma free fatty acids (FFAs); and imbalances in matrix metalloproteinases. These factors, alongside insulin resistance and oxidative stress, drive the dysfunction by decreasing nitric oxide and prostacyclin production while increasing endothelin-1, tissue factor, and cell adhesion molecule (CAM) expression. The diagram serves as a conceptual map connecting metabolic derangements to clinical macrovascular and microvascular complications.
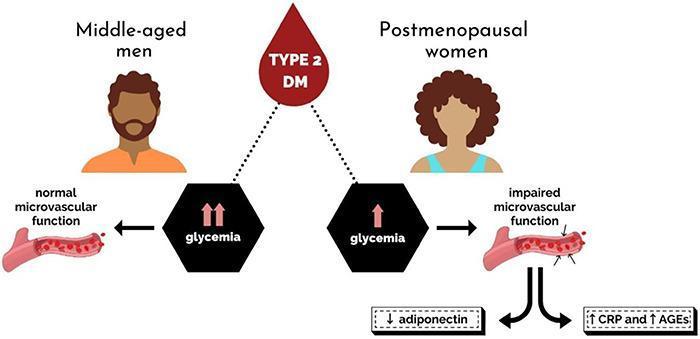
A medical infographic and comparison chart illustrating the sex-specific pathophysiology of microvascular function in Type 2 Diabetes Mellitus (T2DM). The diagram compares middle-aged men and postmenopausal women. For men, the visual highlights that despite higher glycemia (indicated by double upward arrows), they exhibit 'normal microvascular function,' depicted by a blood vessel with a smooth endothelium and organized red blood cells. In contrast, postmenopausal women are shown with lower glycemia (single upward arrow) yet manifest 'impaired microvascular function,' visually represented by an irregular, damaged vessel lining with projections. This vascular impairment in women is further linked to a specific metabolic profile: decreased levels of the anti-inflammatory adipokine adiponectin and increased levels of pro-inflammatory mediators, specifically C-reactive protein (CRP) and advanced glycation end products (AGEs). The illustration serves as a clinical comparison of how hormonal status and inflammatory markers, rather than glycemia alone, drive microvascular complications in diabetic women.
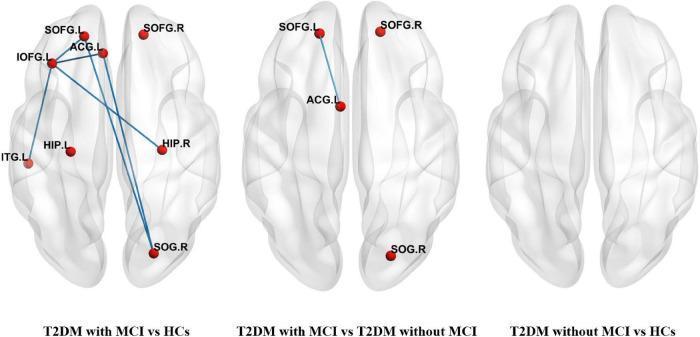
This Comparison Chart illustrates brain network connectivity alterations in patients with Type 2 Diabetes Mellitus (T2DM) and Mild Cognitive Impairment (MCI) using three axial-view brain mapping diagrams. The visualization identifies specific anatomical regions as red nodes and functional or structural connections as blue edges. Panel 1 (T2DM with MCI vs HCs) displays a dense network of eight nodes, including the Left and Right Superior Frontal Gyrus (SOFG), Left Inferior Frontal Gyrus (IOFG), Left Anterior Cingulate Gyrus (ACG), Bilateral Hippocampus (HIP), Left Inferior Temporal Gyrus (ITG), and Right Superior Occipital Gyrus (SOG), indicating significant connectivity differences compared to healthy controls. Panel 2 (T2DM with MCI vs T2DM without MCI) reveals a simpler four-node network with a prominent edge connecting the SOFG.L and ACG.L, highlighting regional alterations associated specifically with cognitive decline in diabetic patients. Panel 3 (T2DM without MCI vs HCs) shows an empty brain template, indicating no significant network differences between these groups. This visualization demonstrates the neuro-pathophysiological progression of T2DM-related cognitive impairment through graph theory analysis.
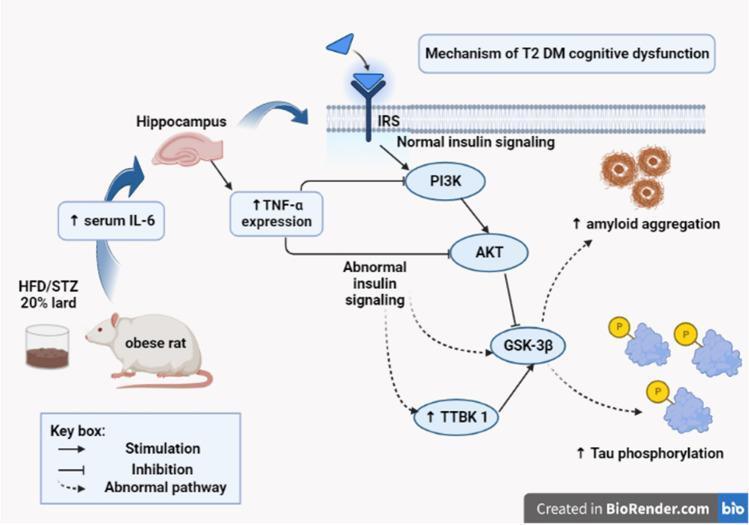
A pathophysiology diagram illustrating the molecular mechanisms linking Type 2 Diabetes Mellitus (T2DM) to cognitive dysfunction. The pathway begins with a High-Fat Diet (HFD) and Streptozotocin (STZ) induction in a rat model, leading to increased serum Interleukin-6 (IL-6) and subsequent hippocampal TNF-α expression. This inflammatory state disrupts normal insulin signaling at the Insulin Receptor Substrate (IRS) level. Under normal conditions, IRS stimulates the PI3K/AKT pathway. However, the diagram shows an 'abnormal pathway' where increased TNF-α leads to decreased PI3K and AKT activity. This downregulation fails to inhibit Glycogen Synthase Kinase 3 beta (GSK-3β). Simultaneously, there is an upregulation of Tau Tubulin Kinase 1 (TTBK 1). The synergistic effect of increased GSK-3β and TTBK 1 activity drives the hallmark pathological features of Alzheimer-like neurodegeneration: increased amyloid aggregation and increased tau phosphorylation. The diagram uses solid arrows for stimulation, T-bars for inhibition, and dashed arrows to represent abnormal disease-state pathways.
Type 1 Diabetes Mellitus vs Type 2 Diabetes Mellitus - Detailed Comparison
1. Overview / Definition
| Feature | Type 1 DM (T1DM) | Type 2 DM (T2DM) |
|---|---|---|
| Core defect | Absolute insulin deficiency due to destruction of pancreatic beta cells | Insulin resistance with relative (not absolute) insulin deficiency |
| Proportion of all DM | ~5-10% of cases | ~90-95% of all cases |
| Former names | Juvenile-onset DM, Insulin-dependent DM (IDDM) | Adult-onset DM, Non-insulin-dependent DM (NIDDM) |
2. Etiology & Pathogenesis
Type 1 DM
- Autoimmune destruction of beta cells in the pancreatic islets of Langerhans, resulting in complete loss of insulin production.
- Environmental triggers (viral infections, toxins, possibly vitamin D deficiency) may initiate the autoimmune cascade in genetically predisposed individuals.
- A prediabetes period of gradual beta cell destruction can last months to decades. During this silent phase, the first-phase insulin release to IV glucose becomes depressed or absent.
- Eventually, most or all beta cells are destroyed, causing undetectable C-peptide and insulin levels. - Henry's Clinical Diagnosis and Management by Laboratory Methods
- Anti-GAD65 (glutamic acid decarboxylase) - highest sensitivity (91%) as a single screening marker
- Insulin autoantibodies (IAA) - more common in young children
- IA-2 (insulinoma-associated protein 2, tyrosine phosphatase)
- ZnT8A (zinc transporter 8) - located on secretory granule surface membranes
Type 2 DM
- Caused by insulin resistance combined with progressive beta cell dysfunction. Genetic susceptibility (≥18 polymorphisms identified by GWAS) interacts with environmental triggers.
- Genetically susceptible individuals develop obesity, which induces physiologic stress and overproduction of insulin. Over time, programmed beta cell apoptosis begins.
- By the time prediabetes is diagnosed (2-hour postprandial glucose 140-180 mg/dL), patients have already lost ~80% of beta cell function and are maximally insulin resistant. - Textbook of Family Medicine
- Disease is progressive - ultimately requires multiple agents and often insulin.
- Environmental triggers include obesity, high-fat diet, physical inactivity, vitamin D deficiency, concurrent illness, and certain medications (glucocorticoids, HIV medications). - Textbook of Family Medicine
3. Insulin Release Pattern
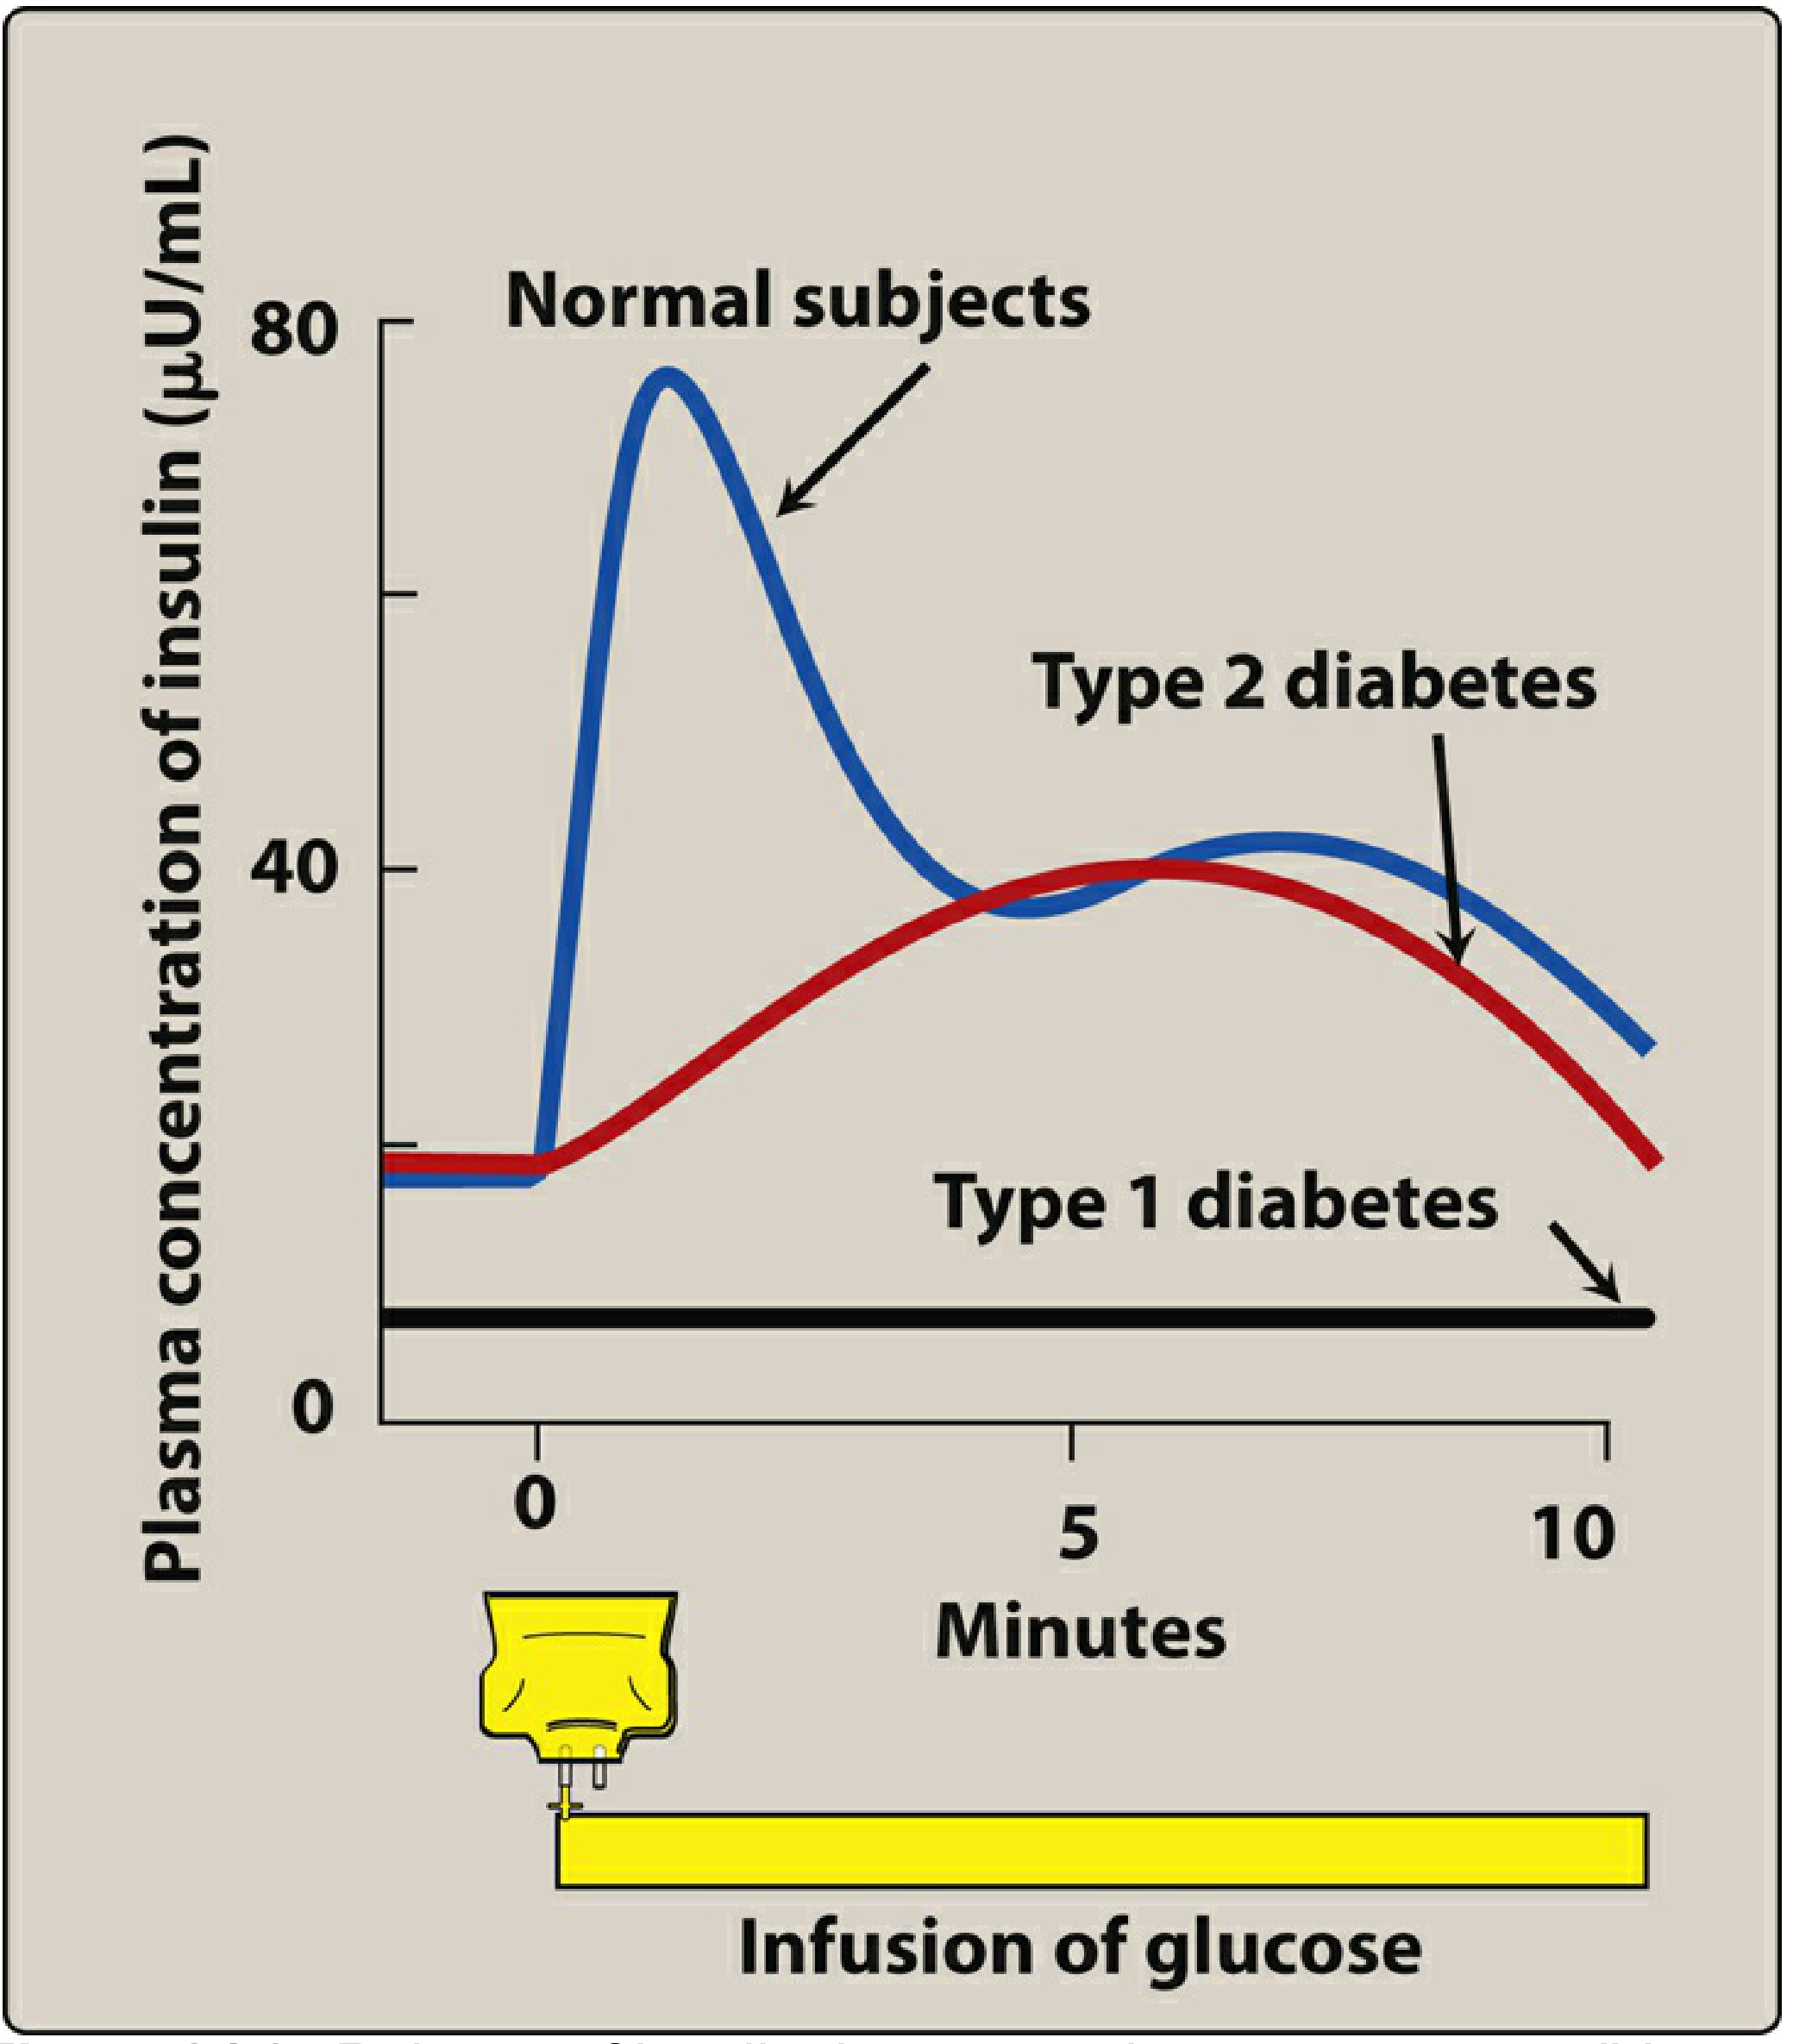
- T1DM: No first-phase or second-phase insulin release - pancreas cannot respond to glucose at all.
- T2DM: Loss of the early first-phase peak; slow, blunted second-phase response - insulin is still produced but insufficiently and with poor timing.
4. Epidemiology & Risk Factors
| Feature | T1DM | T2DM |
|---|---|---|
| Age at onset | Typically childhood, adolescence, young adults (can occur at any age; LADA appears in adults) | Typically >45 years, increasingly younger |
| Body habitus | Usually normal weight or thin | Usually overweight or obese |
| Sex | Roughly equal | Slightly more common in women with certain risk factors (PCOS, gestational DM history) |
| Ethnicity | Any; slight North European predominance | Higher in African Americans, Native Americans, Hispanics, Asians, Pacific Islanders |
| Family history | Weaker (3-5% risk if parent affected) | Stronger (1st degree relative is major risk factor) |
| Metabolic syndrome | Not typically associated | Strongly associated (HTN, dyslipidemia, abdominal obesity) |
| Other autoimmune diseases | Frequently associated (thyroid, celiac, Addison's) | Not typically associated |
5. Genetic Basis
| T1DM | T2DM | |
|---|---|---|
| Key genes | HLA-DR3, HLA-DR4 (chromosome 6); also non-HLA genes | ≥18 polymorphisms identified; no single HLA association |
| HLA association | Strong (HLA-DR/DQ on chromosome 6) | Weak / absent |
| Mode | Polygenic + environmental trigger | Polygenic + strong environmental influence (obesity, diet) |
- T2DM polymorphisms favor reduced satiety, increased appetite, reduced energy expenditure, and increased intraabdominal fat - Textbook of Family Medicine
6. Clinical Presentation
| Feature | T1DM | T2DM |
|---|---|---|
| Onset | Acute / abrupt | Insidious (often asymptomatic at diagnosis) |
| Classic symptoms (3 Ps) | Polyuria, polydipsia, polyphagia - often dramatic and rapid | Often absent or subtle - many found on screening |
| Weight | Weight loss | Often overweight or obese |
| Ketonemia/DKA | Common - prone to DKA when insulin withheld | Rare - not prone to DKA; prone to HHS instead |
| At diagnosis | Often symptomatic, may present in DKA | Often asymptomatic; complications (e.g., retinopathy) may already be present |
7. Laboratory / Diagnostic Features
- Fasting plasma glucose ≥126 mg/dL (8-hour fast, confirmed on repeat)
- Random glucose ≥200 mg/dL + symptoms of hyperglycemia
- 2-hour plasma glucose ≥200 mg/dL during 75g OGTT
- HbA1c ≥6.5%
| Lab Finding | T1DM | T2DM |
|---|---|---|
| C-peptide | Very low or undetectable | Normal or elevated (especially early); low in late-stage |
| Insulin levels | Very low / absent | Normal, elevated (early); reduced (late) |
| Autoantibodies (GAD65, IA-2, IAA, ZnT8A) | Positive (usually ≥2) | Negative |
| HbA1c monitoring | Target <7% (gold standard) | Same target |
| Prediabetes range | FPG 100-125 mg/dL; OGTT 140-199 mg/dL; HbA1c 5.7-6.4% | Same criteria |
8. Acute Complications
| Complication | T1DM | T2DM |
|---|---|---|
| Diabetic Ketoacidosis (DKA) | Common, hallmark - due to absolute insulin deficiency causing unrestrained lipolysis and ketogenesis | Rare (may occur in severe illness) |
| Hyperosmolar Hyperglycemic State (HHS) | Rare | More common - due to relative insulin sufficiency preventing ketosis but not hyperglycemia |
| Hypoglycemia | More frequent (tight insulin control) | Less frequent overall; occurs with insulin or sulfonylurea use |
| Hypoglycemic unawareness | Can develop with repeated episodes | Can develop similarly |
- Miller's Anesthesia: "T1DM patients prone to ketoacidosis when insulin is withheld; T2DM patients prone to HHS during acute illness."
9. Chronic Complications (Shared, but timing differs)
- Diabetic retinopathy - leading cause of blindness
- Diabetic nephropathy - T2DM is the most common cause of chronic renal failure in the US (because T2DM is 10x more frequent)
- Diabetic neuropathy (peripheral + autonomic)
-
Coronary heart disease
-
Peripheral vascular disease
-
Stroke / cerebrovascular disease
-
Endothelial dysfunction from hyperglycemia, AGE formation, elevated free fatty acids, oxidative stress, and insulin resistance drives both micro- and macrovascular disease. - Henry's Clinical Diagnosis
In T2DM, 18% of patients with prediabetes already have diabetic retinopathy before progressing to frank T2DM. - Textbook of Family Medicine
10. Treatment
Type 1 DM
| Delivery Method | Description |
|---|---|
| Multiple Daily Injections (MDI) | Basal + prandial (bolus) dosing regimen |
| Continuous Subcutaneous Insulin Infusion (CSII) / Insulin pump | Manual bolus entries |
| Sensor-Augmented Pump | CGM + pump; suspends insulin when glucose is low |
| Automated Insulin Delivery (AID) | CGM + pump + algorithm; adjusts basal rate in real-time |
- Rapid-acting (Aspart, Lispro, Glulisine): onset <15 min, peak 0.5-1.5h, duration 3-5h
- Short-acting (Regular): onset 0.5-1h, peak 2-3h, duration 4-8h
- Intermediate (NPH): onset 2-4h, peak 4-10h, duration 10-16h
- Long-acting (Glargine, Detemir, Degludec): onset 1-9h, flat/no peak, duration 20-24h+
- Harrison's Principles of Internal Medicine 22E
Type 2 DM
| Drug Class | Example | Mechanism |
|---|---|---|
| Biguanides (1st-line) | Metformin | Reduces hepatic gluconeogenesis, modest increase in peripheral uptake; promotes weight loss |
| Sulfonylureas | Glipizide, Glimepiride | Stimulate beta cell insulin secretion (ATP-K+ channel) |
| Meglitinides | Repaglinide | Short-acting insulin secretagogues |
| Thiazolidinediones | Pioglitazone | Insulin sensitizers (PPARγ agonists) |
| Alpha-glucosidase inhibitors | Acarbose | Delay carbohydrate absorption |
| DPP-4 inhibitors | Sitagliptin | Increase incretin levels → glucose-dependent insulin secretion |
| GLP-1 receptor agonists | Semaglutide, Liraglutide | Stimulate glucose-dependent insulin secretion, suppress glucagon, promote weight loss, CV benefit |
| SGLT-2 inhibitors | Empagliflozin, Dapagliflozin | Promote urinary glucose excretion; CV and renal protective benefits |
| Insulin | All types | When oral agents insufficient or in severe hyperglycemia |
- Metformin remains first-line; SGLT-2 inhibitors and GLP-1 agonists are preferred add-ons when CV/renal protection is needed - Harrison's 22E
- 15-20% of T2DM patients ultimately require insulin - Swanson's Family Medicine Review
11. Monitoring Targets (Both Types)
| Parameter | Target |
|---|---|
| HbA1c | <7.0% (gold standard; checked every 3 months) |
| Fasting plasma glucose | 80-130 mg/dL |
| Post-meal glucose (2h) | <180 mg/dL |
| Blood pressure | <130/80 mmHg |
| LDL cholesterol | <70 mg/dL (high CV risk) |
12. Summary Comparison Table
| Feature | Type 1 DM | Type 2 DM |
|---|---|---|
| Mechanism | Autoimmune beta cell destruction | Insulin resistance + progressive beta cell failure |
| Insulin | Absolute deficiency | Relative deficiency |
| Proportion | 5-10% | 90-95% |
| Onset | Acute, abrupt | Insidious, often asymptomatic |
| Age | Usually <30 years (any age) | Usually >45 years (decreasing) |
| Body weight | Normal/thin | Obese |
| Autoantibodies | Present (GAD65, IA-2, ZnT8A, IAA) | Absent |
| C-peptide | Very low/absent | Normal to high (early) |
| HLA association | Strong (DR3/DR4) | Weak/absent |
| Ketosis/DKA | Prone | Rare |
| HHS | Rare | Prone |
| Hypoglycemia risk | Higher | Lower (unless on insulin/SU) |
| Metabolic syndrome | Not associated | Strongly associated |
| Other autoimmune | Frequently co-exists | Not typically |
| Treatment | Insulin always required | Lifestyle → Metformin → add-on agents → insulin |
| Progression | Stable (beta cells already destroyed) | Progressive over years/decades |
| Complications | Same spectrum; earlier if poor control | Same spectrum; may predate diagnosis |
Sources
- Harrison's Principles of Internal Medicine, 22E (2025)
- Lippincott Illustrated Reviews: Pharmacology
- Henry's Clinical Diagnosis and Management by Laboratory Methods
- Miller's Anesthesia, 10E
- Textbook of Family Medicine, 9E
- Swanson's Family Medicine Review
Give me detailed treatment protocol for Type 2 Diabetes mellitus for both outpatient as well as inpatient. Give me step by step algorithm along with the preferred medications in view of associated comorbiditis. Also give me In every situation if blood sugar in elevated despite of given medicine what next step or next medicine to either add on or replace with. Make it interesting as well give me different scenarios of cases to make it more explainable.
"type 2 diabetes"[MeSH Terms] AND "practice guideline"[pt]
PMID: 39093266
ADA 2025 Standards of Care type 2 diabetes pharmacologic treatment algorithm metformin GLP-1 SGLT2
inpatient glycemic management guidelines 2024 2025 basal bolus insulin target glucose critically ill
Type 2 Diabetes Mellitus - Complete Treatment Protocol (Outpatient + Inpatient)
PART A: OUTPATIENT ALGORITHM
Step 0 - Foundation (Every Patient, Every Time)
- Lifestyle: medical nutrition therapy, weight management, exercise
- Diabetes self-management education
- Assess comorbidity profile first - this now determines drug choice independent of HbA1c, per the ADA/EASD consensus algorithm - Katzung's Pharmacology, Fig. 41-6, updated per ADA Standards of Care 2025
Step 1 - Ask "Does this patient have a compelling comorbidity?"
                    NEWLY DIAGNOSED T2DM
                            |
              Start Metformin + Lifestyle
                            |
        ┌───────────────────┼───────────────────┬─────────────────┐
        │                   │                   │                 │
   ASCVD / high        Heart Failure         CKD (esp.        Obesity /
   ASCVD risk           (esp. HFrEF)      albuminuria)      weight is priority
        │                   │                   │                 │
   SGLT2i and/or       SGLT2i preferred    SGLT2i (if eGFR    GLP-1 RA or
   GLP-1 RA with       (regardless of        ≥20) + max      dual GIP/GLP-1 RA
   proven CV benefit    A1c/metformin)      tolerated          (tirzepatide) -
   - regardless of                          metformin;         highest weight
   A1c                                      + finerenone       loss efficacy
                                             if albuminuria
                                             persists + K+ normal
- Source: ADA Standards of Care 2025 Pharmacologic Treatment guideline; Goldman-Cecil Medicine; Comprehensive Clinical Nephrology 7E
Step 2 - No compelling comorbidity? Standard escalation ladder
| Line | Drug | Why |
|---|---|---|
| 1st | Metformin | Cheap, weight-neutral/loss, no hypoglycemia, cardio-safe |
| 2nd (if A1c not at goal in ~3 months) | Add SGLT2i or GLP-1 RA (preferred) OR pioglitazone/DPP-4i/SU depending on cost/access | 2025 ADA update favors early combination therapy rather than sequential monotherapy |
| 3rd | Add a second agent from a different class | Combine mechanisms - e.g., SGLT2i + GLP-1RA |
| 4th | Insulin | When combination oral/injectable non-insulin therapy fails |
PART B: "IF SUGAR STILL HIGH DESPITE DRUG X" - Escalation Logic
| Current Regimen | Sugar still high - Next Step |
|---|---|
| Lifestyle alone | Add metformin (unless eGFR <30 or contraindication) |
| Metformin alone, A1c above goal | Add SGLT2i or GLP-1 RA (comorbidity-driven) or 2nd agent |
| Metformin + 1 agent, still uncontrolled | Add a 3rd class with complementary mechanism (don't stack two secretagogues, e.g., don't add SU on top of meglitinide) |
| Triple oral/injectable therapy failing | Start basal insulin at bedtime - keep metformin, SGLT2i, GLP-1RA running (only taper SU/DPP-4i due to redundancy and hypo risk) |
| Basal insulin + oral agents, fasting glucose controlled but daytime spikes | Add premixed insulin before breakfast/dinner, OR add prandial rapid-acting insulin at the largest meal ("basal-plus") |
| Basal-plus insulin still failing | Convert to full basal-bolus (long-acting once/twice daily + rapid-acting before each meal) |
| Basal-bolus insulin + still poor control, weight gain, high doses (>1-1.5 U/kg/day) | Suspect severe insulin resistance - add pioglitazone (watch edema/HF) or maximize GLP-1RA/SGLT2i; reassess adherence, injection technique, steroid use, infection |
| Any regimen + recurrent hypoglycemia | De-intensify - drop sulfonylurea/meglitinide first, relax A1c target if elderly/frail, consider CGM |
- Sources: Katzung's Pharmacology Fig. 41-6; ADA Standards of Care 2025
PART C: COMORBIDITY-DRIVEN DRUG SELECTION (Cheat Sheet)
| Comorbidity | Preferred | Avoid / Caution |
|---|---|---|
| ASCVD / high CV risk | GLP-1 RA or SGLT2i with proven CV benefit | - |
| Heart Failure (esp. HFrEF) | SGLT2i is first-line regardless of A1c - reduces HF hospitalization | Pioglitazone (fluid retention, contraindicated in HF); saxagliptin (some DPP-4i linked to HF hospitalization) |
| CKD/albuminuria | Metformin (down to eGFR 30, reduced dose 30-45) + SGLT2i (can continue to eGFR ~20) ± finerenone (nonsteroidal MRA) if albuminuria persists and K+ normal | SGLT2i glucose-lowering effect weakens below eGFR 45 (but renal/CV protection persists); avoid metformin if eGFR <30 |
| Obesity as priority | GLP-1 RA or dual GIP/GLP-1 RA (tirzepatide) - largest weight loss | Sulfonylureas, TZDs, insulin (all cause weight gain) |
| Elderly / frail | DPP-4i (low hypoglycemia risk), cautious SGLT2i (volume depletion risk), simplified insulin regimens | Sulfonylureas (esp. glyburide) - hypoglycemia risk higher in elderly, renal/hepatic impairment - Katzung's Pharmacology |
| Hepatic impairment | Insulin is safest; metformin avoided in significant hepatic disease (lactic acidosis risk) | Sulfonylureas (unpredictable clearance), pioglitazone (monitor LFTs) |
| History of pancreatitis | Avoid | GLP-1 RA, DPP-4i (theoretical pancreatitis association) |
PART D: INPATIENT PROTOCOL
Golden Rule: Insulin is the cornerstone in the hospital. Oral agents are unreliable (slow onset, GI absorption issues, contraindications with contrast/fasting/renal changes) - Goodman & Gilman's Pharmacological Basis of Therapeutics
D1. Non-Critically Ill, Ward Patient (Eating)
| Component | Dosing principle |
|---|---|
| Basal insulin | Long-acting, once daily (~40-50% of total daily dose) |
| Prandial (bolus) insulin | Rapid-acting before each meal, adjusted to carb intake |
| Correction insulin | Added on top of bolus dose for unexpected hyperglycemia |
| Target | 140-180 mg/dL for most hospitalized patients |
| DPP-4 inhibitor + correction insulin | Newer acceptable alternative for mild hyperglycemia in select non-T1DM patients (2025 update) |
| Home insulin pump / hybrid closed-loop | Can be continued if patient/team capable of managing it |
D2. Critically Ill / ICU Patient
| Parameter | Value |
|---|---|
| Target glucose | 140-180 mg/dL (ADA 2025, SCCM 2024, ACP) |
| Start/intensify insulin infusion | Persistent glucose >180 mg/dL |
| Avoid tight control | Targets <140 mg/dL increase hypoglycemia risk without added benefit (per RCT evidence) |
| Permissive higher target (up to 250) | Consider in advanced renal failure or labile/high hypoglycemia-risk patients |
D3. Perioperative Patient
| Step | Action |
|---|---|
| Preop HbA1c check | If >8%, consider delaying elective surgery (independently associated with wound infection and mortality) |
| Insulin dose while fasting | Reduce stable home dose by 1/3 to 1/2 |
| SGLT2 inhibitors | STOP 3-4 days before surgery (FDA 2020 warning) - risk of euglycemic DKA postoperatively |
| Insulin pump patients | Can continue in OR if team is comfortable programming it; maintain basal rate unless glucose <110 (then reduce) or >180 (correction dose); check glucose at least hourly |
| ERAS protocols | Carbohydrate drinks up to 2h preop reduce catabolism/hypoglycemia risk in diabetics |
D4. Hyperglycemic Emergencies (DKA / HHS)
| DKA | HHS | |
|---|---|---|
| Typical patient | Can occur in T2DM under severe stress (infection, MI, missed insulin) | Classic T2DM presentation |
| Core therapy | IV fluids (isotonic saline) → insulin infusion (fixed rate, e.g. 0.1 U/kg/h) → potassium replacement before/with insulin (insulin drives K+ intracellularly) → address underlying trigger | Aggressive fluid resuscitation is the priority; low-dose insulin (~0.05 U/kg/h) only if significant ketonemia present; correct slowly to avoid cerebral edema |
| Location | ICU or intermediate care for continuous monitoring | Same - large fluid/electrolyte shifts require monitored bed |
PART E: CASE SCENARIOS (Putting It All Together)
🩺 Case 1 - "The Textbook Start"
🫀 Case 2 - "The Post-MI Patient"
💧 Case 3 - "The Failing Kidneys"
❤️ Case 4 - "Swollen Ankles and Short of Breath"
⚖️ Case 5 - "Weight is the Whole Battle"
👵 Case 6 - "The Frail Grandmother"
🏥 Case 7 - "Sugar 280 on the Medical Ward"
🚨 Case 8 - "Crashing in the ICU"
🔪 Case 9 - "Elective Surgery Coming Up"
🆘 Case 10 - "Found Down, Fruity Breath"
🌊 Case 11 - "The Confused Elderly Man, No Ketones"
Quick-Reference Master Algorithm (Memorize This Shape)
LIFESTYLE + METFORMIN (always, unless contraindicated)
        │
        ▼
Compelling comorbidity? ──YES──► SGLT2i/GLP-1RA (ASCVD, HF, CKD)
        │                         or GLP-1RA/tirzepatide (obesity)
        NO
        ▼
Standard 2nd agent (SGLT2i/GLP-1RA preferred > DPP-4i/SU/TZD)
        │
   Still uncontrolled?
        ▼
3rd agent, different mechanism
        │
   Still uncontrolled?
        ▼
BASAL INSULIN at bedtime (keep metformin/SGLT2i/GLP-1RA; drop SU/DPP-4i)
        │
   Fasting good, daytime spikes?
        ▼
BASAL-PLUS (add prandial insulin at biggest meal) or premixed insulin
        │
   Still uncontrolled?
        ▼
FULL BASAL-BOLUS regimen
        │
   Recurrent hypoglycemia at any stage → step BACK, de-intensify, relax target
Create a clinical decision-making flowchart PDF I can print and use in clinic
mkdir -p /tmp/workspace/t2dm-flowchart/output && ls -la /tmp/workspace/
~/t2dm-flowchart/generate_flowchart.py
import math
from reportlab.pdfgen import canvas
from reportlab.lib.pagesizes import landscape, LETTER
from reportlab.lib import colors
from reportlab.pdfbase.pdfmetrics import stringWidth

PAGE_W, PAGE_H = landscape(LETTER)  # 792 x 612
OUT = "/tmp/workspace/t2dm-flowchart/output/T2DM_Clinical_Algorithm.pdf"

NAVY = colors.HexColor("#0B3D91")
BLUE = colors.HexColor("#1D6FB8")
LIGHT_BLUE = colors.HexColor("#EAF2FB")
GREEN = colors.HexColor("#1E7B45")
LIGHT_GREEN = colors.HexColor("#EAF7EE")
PURPLE = colors.HexColor("#6A3D9A")
LIGHT_PURPLE = colors.HexColor("#F1E9F8")
TEAL = colors.HexColor("#0E7C7B")
LIGHT_TEAL = colors.HexColor("#E6F5F5")
ORANGE = colors.HexColor("#C1610B")
LIGHT_ORANGE = colors.HexColor("#FDF0E3")
RED = colors.HexColor("#B12A2A")
LIGHT_RED = colors.HexColor("#FBEAEA")
GREY = colors.HexColor("#555555")
LIGHT_GREY = colors.HexColor("#F2F6FC")
YELLOW_BG = colors.HexColor("#FFF3CD")

# ---------- helpers ----------

def wrap_text(text, font_name, font_size, max_width):
    words = text.split()
    lines = []
    cur = ""
    for w in words:
        test = (cur + " " + w).strip()
        if stringWidth(test, font_name, font_size) <= max_width:
            cur = test
        else:
            if cur:
                lines.append(cur)
            cur = w
    if cur:
        lines.append(cur)
    if not lines:
        lines = [""]
    return lines


def draw_box(c, x, y, w, h, text, fill=colors.white, stroke=colors.black,
             text_color=colors.black, font_size=8, bold=True, line_width=1.3,
             radius=7):
    c.setFillColor(fill)
    c.setStrokeColor(stroke)
    c.setLineWidth(line_width)
    c.roundRect(x, y, w, h, radius, fill=1, stroke=1)
    font_name = "Helvetica-Bold" if bold else "Helvetica"
    c.setFillColor(text_color)
    c.setFont(font_name, font_size)
    raw_lines = text.split("\n")
    all_lines = []
    for rl in raw_lines:
        if rl.strip() == "":
            all_lines.append("")
        else:
            all_lines.extend(wrap_text(rl, font_name, font_size, w - 12))
    line_h = font_size + 3
    total_h = line_h * len(all_lines)
    start_y = y + h / 2 + total_h / 2 - line_h + 2
    for i, line in enumerate(all_lines):
        lw = stringWidth(line, font_name, font_size)
        c.drawString(x + w / 2 - lw / 2, start_y - i * line_h, line)


def draw_diamond(c, cx, cy, w, h, text, fill=YELLOW_BG, font_size=8.2):
    c.setFillColor(fill)
    c.setStrokeColor(colors.black)
    c.setLineWidth(1.3)
    p = c.beginPath()
    p.moveTo(cx, cy + h / 2)
    p.lineTo(cx + w / 2, cy)
    p.lineTo(cx, cy - h / 2)
    p.lineTo(cx - w / 2, cy)
    p.close()
    c.drawPath(p, fill=1, stroke=1)
    font_name = "Helvetica-Bold"
    c.setFillColor(colors.black)
    c.setFont(font_name, font_size)
    lines = []
    for rl in text.split("\n"):
        lines.extend(wrap_text(rl, font_name, font_size, w * 0.58))
    line_h = font_size + 2.2
    total_h = line_h * len(lines)
    start_y = cy + total_h / 2 - line_h + 2
    for i, line in enumerate(lines):
        lw = stringWidth(line, font_name, font_size)
        c.drawString(cx - lw / 2, start_y - i * line_h, line)


def arrow(c, x1, y1, x2, y2, color=colors.HexColor("#333333"), width=1.5, label=None):
    c.setStrokeColor(color)
    c.setLineWidth(width)
    c.line(x1, y1, x2, y2)
    ang = math.atan2(y2 - y1, x2 - x1)
    ah_len = 7.5
    ah_ang = 0.42
    x3 = x2 - ah_len * math.cos(ang - ah_ang)
    y3 = y2 - ah_len * math.sin(ang - ah_ang)
    x4 = x2 - ah_len * math.cos(ang + ah_ang)
    y4 = y2 - ah_len * math.sin(ang + ah_ang)
    c.setFillColor(color)
    p = c.beginPath()
    p.moveTo(x2, y2)
    p.lineTo(x3, y3)
    p.lineTo(x4, y4)
    p.close()
    c.drawPath(p, fill=1, stroke=0)
    if label:
        c.setFillColor(colors.HexColor("#222222"))
        c.setFont("Helvetica-BoldOblique", 7.6)
        c.drawString((x1 + x2) / 2 + 4, (y1 + y2) / 2 + 3, label)


def draw_titled_box(c, x, y, w, h, title, body, fill, accent, title_fs=9.2,
                     body_fs=7.3, pad=7):
    c.setFillColor(fill)
    c.setStrokeColor(accent)
    c.setLineWidth(1.7)
    c.roundRect(x, y, w, h, 8, fill=1, stroke=1)
    c.setFillColor(accent)
    c.setFont("Helvetica-Bold", title_fs)
    title_lines = wrap_text(title, "Helvetica-Bold", title_fs, w - 2 * pad)
    ty = y + h - pad - title_fs
    for line in title_lines:
        lw = stringWidth(line, "Helvetica-Bold", title_fs)
        c.drawString(x + w / 2 - lw / 2, ty, line)
        ty -= title_fs + 2.5
    ty -= 2
    c.setStrokeColor(accent)
    c.setLineWidth(0.7)
    c.line(x + pad, ty, x + w - pad, ty)
    ty -= 11
    c.setFillColor(colors.HexColor("#1A1A1A"))
    for para in body.split("\n"):
        if para.strip() == "":
            ty -= body_fs * 0.7
            continue
        bold_line = para.startswith("**")
        clean = para[2:] if bold_line else para
        font = "Helvetica-Bold" if bold_line else "Helvetica"
        c.setFont(font, body_fs)
        lines = wrap_text(clean, font, body_fs, w - 2 * pad)
        for line in lines:
            c.drawString(x + pad, ty, line)
            ty -= body_fs + 2.8


def header(c, kicker, title):
    c.setFillColor(NAVY)
    c.rect(0, PAGE_H - 48, PAGE_W, 48, fill=1, stroke=0)
    c.setFillColor(colors.HexColor("#BFD4F2"))
    c.setFont("Helvetica-Bold", 9)
    c.drawString(24, PAGE_H - 16, kicker)
    c.setFillColor(colors.white)
    c.setFont("Helvetica-Bold", 16.5)
    c.drawString(24, PAGE_H - 36, title)


def footer(c, page_num, total_pages):
    c.setFillColor(GREY)
    c.setFont("Helvetica-Oblique", 7.2)
    c.drawString(24, 14, "Clinical quick-reference only - verify against current local protocols/prescribing information. Not a substitute for clinical judgment.")
    c.setFont("Helvetica-Bold", 7.5)
    c.drawRightString(PAGE_W - 24, 14, "T2DM Clinical Decision Algorithm  |  Page %d of %d" % (page_num, total_pages))


def legend(c, x, y):
    items = [(LIGHT_BLUE, BLUE, "ASCVD"), (LIGHT_PURPLE, PURPLE, "Heart Failure"),
             (LIGHT_TEAL, TEAL, "CKD"), (LIGHT_ORANGE, ORANGE, "Obesity"),
             (LIGHT_RED, RED, "Avoid / Caution")]
    cx = x
    for fill, accent, label in items:
        c.setFillColor(fill)
        c.setStrokeColor(accent)
        c.setLineWidth(1.1)
        c.rect(cx, y, 10, 10, fill=1, stroke=1)
        c.setFillColor(colors.HexColor("#222222"))
        c.setFont("Helvetica", 7.6)
        c.drawString(cx + 14, y + 2, label)
        cx += 14 + stringWidth(label, "Helvetica", 7.6) + 16


def draw_table(c, x, top_y, col_widths, rows, header_fs=8.4, body_fs=7.2):
    total_w = sum(col_widths)
    y_cursor = top_y
    for r_idx, row in enumerate(rows):
        is_header = (r_idx == 0)
        fs = header_fs if is_header else body_fs
        font = "Helvetica-Bold" if is_header else "Helvetica"
        cell_lines = []
        max_lines = 1
        for ci, cell in enumerate(row):
            lines = []
            for para in str(cell).split("\n"):
                lines.extend(wrap_text(para, font, fs, col_widths[ci] - 10))
            cell_lines.append(lines)
            max_lines = max(max_lines, len(lines))
        row_h = max_lines * (fs + 3.2) + 10
        fill = NAVY if is_header else (LIGHT_GREY if r_idx % 2 == 0 else colors.white)
        c.setFillColor(fill)
        c.rect(x, y_cursor - row_h, total_w, row_h, fill=1, stroke=0)
        c.setStrokeColor(colors.HexColor("#9AA7B8"))
        c.setLineWidth(0.6)
        c.rect(x, y_cursor - row_h, total_w, row_h, fill=0, stroke=1)
        cx = x
        text_color = colors.white if is_header else colors.HexColor("#1A1A1A")
        for ci, lines in enumerate(cell_lines):
            c.setStrokeColor(colors.HexColor("#9AA7B8"))
            c.line(cx, y_cursor - row_h, cx, y_cursor)
            c.setFillColor(text_color)
            c.setFont(font, fs)
            ty = y_cursor - 7 - fs
            for line in lines:
                c.drawString(cx + 5, ty, line)
                ty -= fs + 3.2
            cx += col_widths[ci]
        c.setStrokeColor(colors.HexColor("#9AA7B8"))
        c.line(cx, y_cursor - row_h, cx, y_cursor)
        y_cursor -= row_h
    return y_cursor


def section_title(c, x, y, text, color=NAVY, fs=11.5):
    c.setFillColor(color)
    c.setFont("Helvetica-Bold", fs)
    c.drawString(x, y, text)


# ==================================================================
c = canvas.Canvas(OUT, pagesize=landscape(LETTER))
TOTAL_PAGES = 4

# ------------------------------------------------------------------
# PAGE 1 - Comorbidity-driven pathway
# ------------------------------------------------------------------
header(c, "TYPE 2 DIABETES MELLITUS - OUTPATIENT ALGORITHM (PART 1 of 2)", "Comorbidity-Driven First-Line Therapy")

start_w, start_h = 260, 44
start_x = PAGE_W / 2 - start_w / 2
start_y = 500
draw_box(c, start_x, start_y, start_w, start_h,
         "ALL PATIENTS WITH NEW/EXISTING T2DM\nLifestyle modification + METFORMIN\n(unless eGFR <30 or contraindicated)",
         fill=LIGHT_GREY, stroke=NAVY, text_color=NAVY, font_size=8.6)

dia_cx, dia_cy, dia_w, dia_h = PAGE_W / 2 - 40, 430, 280, 72
arrow(c, dia_cx, start_y, dia_cx, dia_cy + dia_h / 2 + 2)
draw_diamond(c, dia_cx, dia_cy, dia_w, dia_h,
             "Compelling comorbidity present?\n(ASCVD, Heart Failure, CKD, or Obesity as priority)")

# NO branch -> side box pointing to page 2
no_x, no_y, no_w, no_h = 600, dia_cy - 30, 165, 62
arrow(c, dia_cx + dia_w / 2, dia_cy, no_x, no_y + no_h / 2, label="NO")
draw_box(c, no_x, no_y, no_w, no_h,
         "No compelling comorbidity\n\nGo to PAGE 2:\nStandard Escalation Ladder",
         fill=LIGHT_GREY, stroke=GREY, text_color=colors.HexColor("#222222"), font_size=8)

# YES branch -> 4 cards
card_y, card_h, card_w, gap = 165, 165, 175, 20
total_row_w = 4 * card_w + 3 * gap
row_x0 = PAGE_W / 2 - total_row_w / 2 - 40
positions = [row_x0 + i * (card_w + gap) for i in range(4)]

arrow(c, dia_cx - 20, dia_cy - dia_h / 2, dia_cx - 20, card_y + card_h + 28, label="YES")
# fan lines to each card
for px in positions:
    arrow(c, dia_cx - 20, card_y + card_h + 28, px + card_w / 2, card_y + card_h + 2)

draw_titled_box(c, positions[0], card_y, card_w, card_h, "ASCVD / High ASCVD Risk",
                "**PREFERRED:\nSGLT2 inhibitor and/or GLP-1 RA with proven CV benefit - "
                "regardless of A1c or metformin use.\n\n**CONTINUE:\nMetformin if tolerated/not contraindicated.",
                LIGHT_BLUE, BLUE)

draw_titled_box(c, positions[1], card_y, card_w, card_h, "Heart Failure (esp. HFrEF)",
                "**PREFERRED:\nSGLT2 inhibitor - first-line regardless of A1c/metformin. "
                "Reduces HF hospitalization.\n\n**AVOID:\nPioglitazone (fluid retention); caution with saxagliptin.",
                LIGHT_PURPLE, PURPLE)

draw_titled_box(c, positions[2], card_y, card_w, card_h, "CKD / Albuminuria",
                "**PREFERRED:\nMetformin (dose-adjust; stop <30 eGFR) + SGLT2i "
                "(renal benefit continues to ~eGFR 20).\n\n**ADD-ON:\nIf albuminuria persists and K+ normal - Finerenone (nonsteroidal MRA).",
                LIGHT_TEAL, TEAL)

draw_titled_box(c, positions[3], card_y, card_w, card_h, "Obesity Is the Priority",
                "**PREFERRED:\nGLP-1 RA or dual GIP/GLP-1 RA (tirzepatide) - greatest weight-loss efficacy.\n\n"
                "**AVOID (early):\nSulfonylureas, TZDs, insulin (weight gain).",
                LIGHT_ORANGE, ORANGE)

# bottom note
note_y, note_h = 40, 78
note_x, note_w = 16, PAGE_W - 32
draw_box(c, note_x, note_y, note_w, note_h,
         "ALL COMORBIDITY PATHWAYS: Reassess in ~3 months. If not at individualized A1c goal, add another "
         "comorbidity-appropriate agent (do not stack two insulin secretagogues). If glucose remains uncontrolled "
         "after combination therapy, proceed to insulin initiation - see PAGE 2 for the escalation ladder.",
         fill=colors.white, stroke=colors.HexColor("#999999"), text_color=colors.HexColor("#222222"),
         font_size=8.2, bold=False, line_width=1)

footer(c, 1, TOTAL_PAGES)
c.showPage()

# ------------------------------------------------------------------
# PAGE 2 - Standard escalation ladder + insulin initiation
# ------------------------------------------------------------------
header(c, "TYPE 2 DIABETES MELLITUS - OUTPATIENT ALGORITHM (PART 2 of 2)", "Standard Escalation Ladder & Insulin Initiation")

chain_x, chain_w = 40, 430
steps = [
    ("STEP 1", "Metformin + lifestyle\n(no compelling comorbidity)", LIGHT_GREY, NAVY),
    ("STEP 2", "Add 2nd agent: SGLT2 inhibitor or GLP-1 RA preferred\n(or DPP-4i / sulfonylurea / TZD by cost/access)", LIGHT_BLUE, BLUE),
    ("STEP 3", "Reassess ~3 months - not at goal?\nAdd 3rd agent with a DIFFERENT mechanism", LIGHT_TEAL, TEAL),
    ("STEP 4", "Still not at goal?\nStart BASAL INSULIN at bedtime\n(keep metformin/SGLT2i/GLP-1RA; taper SU/DPP-4i)", LIGHT_PURPLE, PURPLE),
    ("STEP 5", "Fasting glucose OK but daytime spikes?\nAdd prandial insulin at largest meal (\"basal-plus\") or premixed insulin", LIGHT_ORANGE, ORANGE),
    ("STEP 6", "Still uncontrolled?\nFULL BASAL-BOLUS regimen\n(long-acting + rapid-acting before every meal)", LIGHT_RED, RED),
]

y_top = 500
box_h = 68
gap_v = 18
for i, (tag, text, fill, accent) in enumerate(steps):
    y = y_top - i * (box_h + gap_v)
    draw_box(c, chain_x, y - box_h, chain_w, box_h, tag + "\n" + text,
             fill=fill, stroke=accent, text_color=colors.HexColor("#1A1A1A"), font_size=8.3)
    if i > 0:
        prev_y = y_top - (i - 1) * (box_h + gap_v) - box_h
        arrow(c, chain_x + chain_w / 2, prev_y, chain_x + chain_w / 2, y)

# side callout: hypoglycemia + de-intensification (spans right column)
side_x = chain_x + chain_w + 55
side_w = PAGE_W - side_x - 24

draw_titled_box(c, side_x, 330, side_w, 190, "AT ANY STEP: Recurrent Hypoglycemia",
                "**De-intensify first:\nDrop sulfonylurea or meglitinide before other agents - "
                "these carry the highest hypoglycemia risk.\n\n"
                "**Relax targets:\nConsider a higher individualized A1c goal (e.g. ~8%) in elderly, frail, "
                "or multimorbid patients, or those with limited life expectancy.\n\n"
                "**Consider CGM:\nContinuous glucose monitoring helps detect patterns and titrate safely.",
                LIGHT_RED, RED, title_fs=10.5, body_fs=8.3)

draw_titled_box(c, side_x, 120, side_w, 175, "2025 Practice Shift to Note",
                "Recent ADA Standards of Care favor **EARLY COMBINATION THERAPY** "
                "(e.g., metformin + SGLT2i/GLP-1 RA together at diagnosis in high-risk patients) "
                "rather than waiting for metformin monotherapy to \"fail\" before adding a second agent.\n\n"
                "Comorbidity-driven agent selection (Page 1) now takes priority over the A1c number itself "
                "when ASCVD, HF, or CKD is present.",
                LIGHT_BLUE, NAVY, title_fs=10.5, body_fs=8.3)

footer(c, 2, TOTAL_PAGES)
c.showPage()

# ------------------------------------------------------------------
# PAGE 3 - Quick reference tables
# ------------------------------------------------------------------
header(c, "QUICK-REFERENCE TABLES", "Escalation Cascade & Comorbidity Cheat-Sheet")

section_title(c, 20, PAGE_W * 0 + 545, "If Sugar Remains High Despite Current Regimen - What To Add / Replace")
esc_rows = [
    ["Current Regimen", "Sugar Still High -> Next Step"],
    ["Lifestyle alone", "Add metformin (unless eGFR <30 or contraindicated)"],
    ["Metformin alone, above goal", "Add SGLT2i or GLP-1 RA (comorbidity-driven) or another 2nd agent"],
    ["Metformin + 1 agent, uncontrolled", "Add a 3rd class with a complementary mechanism (avoid stacking two secretagogues)"],
    ["Triple therapy failing", "Start basal insulin at bedtime; continue metformin/SGLT2i/GLP-1RA; taper SU/DPP-4i"],
    ["Basal insulin + orals, fasting OK but daytime spikes", "Add prandial insulin at the largest meal (\"basal-plus\") or premixed insulin AM/PM"],
    ["Basal-plus insulin still failing", "Convert to full basal-bolus (long-acting + rapid-acting before each meal)"],
    ["Basal-bolus, high doses (>1-1.5 U/kg/day), still uncontrolled", "Suspect severe insulin resistance - add pioglitazone (watch HF/edema) or maximize GLP-1RA/SGLT2i; recheck adherence, technique, steroids, infection"],
    ["Any regimen + recurrent hypoglycemia", "De-intensify: drop sulfonylurea/meglitinide first; relax A1c goal if elderly/frail"],
]
col_widths_1 = [230, 530]
bottom1 = draw_table(c, 20, 542, col_widths_1, esc_rows)

section_title(c, 20, bottom1 - 14, "Comorbidity-Driven Drug Selection Cheat-Sheet")
com_rows = [
    ["Comorbidity", "Preferred", "Avoid / Caution"],
    ["ASCVD / high CV risk", "GLP-1 RA or SGLT2i with proven CV benefit", "-"],
    ["Heart Failure (HFrEF)", "SGLT2i first-line regardless of A1c", "Pioglitazone; caution with saxagliptin"],
    ["CKD / albuminuria", "Metformin (dose-adjust) + SGLT2i; add finerenone if albuminuria persists (K+ normal)", "Metformin if eGFR <30"],
    ["Obesity as priority", "GLP-1 RA or dual GIP/GLP-1 RA (tirzepatide)", "Sulfonylureas, TZDs, insulin as early add-on"],
    ["Elderly / frail", "DPP-4 inhibitor; simplified insulin regimens; cautious SGLT2i (volume depletion)", "Long-acting sulfonylureas (e.g. glyburide)"],
    ["Hepatic impairment", "Insulin is safest", "Metformin (significant disease); sulfonylureas; monitor LFTs with pioglitazone"],
    ["History of pancreatitis", "-", "GLP-1 RA, DPP-4i (theoretical association)"],
]
col_widths_2 = [150, 320, 290]
bottom2 = draw_table(c, 20, bottom1 - 20, col_widths_2, com_rows)

footer(c, 3, TOTAL_PAGES)
c.showPage()

# ------------------------------------------------------------------
# PAGE 4 - Inpatient protocol
# ------------------------------------------------------------------
header(c, "TYPE 2 DIABETES MELLITUS - INPATIENT PROTOCOL", "Ward, ICU, Perioperative & Hyperglycemic Emergencies")

adm_x, adm_y, adm_w, adm_h = PAGE_W / 2 - 150, 500, 300, 44
draw_box(c, adm_x, adm_y, adm_w, adm_h,
         "HOSPITALIZED PATIENT WITH HYPERGLYCEMIA\nInsulin is the cornerstone - oral agents unreliable in acute illness",
         fill=LIGHT_GREY, stroke=NAVY, text_color=NAVY, font_size=8.6)

dia2_cx, dia2_cy, dia2_w, dia2_h = PAGE_W / 2, 430, 230, 66
arrow(c, adm_x + adm_w / 2, adm_y, dia2_cx, dia2_cy + dia2_h / 2 + 2)
draw_diamond(c, dia2_cx, dia2_cy, dia2_w, dia2_h, "Critically ill / ICU?", font_size=9)

left_x, right_x = 90, PAGE_W - 90 - 300
box_y, box_h2, box_w2 = 300, 130, 300

arrow(c, dia2_cx - dia2_w / 2, dia2_cy, left_x + box_w2 / 2, box_y + box_h2, label="NO")
draw_titled_box(c, left_x, box_y, box_w2, box_h2, "Non-Critically Ill Ward Patient (Eating)",
                "**Regimen:\nBasal-bolus + correction insulin (NOT sliding-scale alone - inferior per RCT evidence).\n\n"
                "**Target:\n140-180 mg/dL for most patients.\n\n"
                "**Alternative for mild hyperglycemia:\nDPP-4 inhibitor + correction insulin (non-T1DM).\n\n"
                "**Home insulin pump/hybrid closed-loop:\nMay continue if patient/team capable.",
                LIGHT_BLUE, BLUE, body_fs=7.6)

arrow(c, dia2_cx + dia2_w / 2, dia2_cy, right_x + box_w2 / 2, box_y + box_h2, label="YES")
draw_titled_box(c, right_x, box_y, box_w2, box_h2, "Critically Ill / ICU Patient",
                "**Regimen:\nVariable-rate IV insulin infusion - preferred for rapidly changing hemodynamics/nutrition.\n\n"
                "**Target:\n140-180 mg/dL (ADA 2025 / SCCM 2024 / ACP).\n\n"
                "**Start/intensify:\nWhen glucose persistently >180 mg/dL.\n\n"
                "**Avoid <140 mg/dL target:\nIncreases hypoglycemia risk without added benefit.",
                LIGHT_PURPLE, PURPLE, body_fs=7.6)

# perioperative + emergencies row
peri_y, peri_h, peri_w = 40, 235, 250
peri_x = 40
draw_titled_box(c, peri_x, peri_y, peri_w, peri_h, "Perioperative Management",
                "**HbA1c >8%:\nConsider delaying elective surgery (linked to wound infection/mortality).\n\n"
                "**Fasting insulin dose:\nReduce stable home dose by 1/3 to 1/2.\n\n"
                "**SGLT2 inhibitors:\nSTOP 3-4 days pre-op - risk of euglycemic DKA (FDA warning).\n\n"
                "**Insulin pump:\nMay continue in OR if team trained; check glucose >= hourly.\n\n"
                "**ERAS carb drinks:\nUp to 2h pre-op reduce catabolism/hypoglycemia risk.",
                LIGHT_TEAL, TEAL, body_fs=7.3)

dka_x = peri_x + peri_w + 20
draw_titled_box(c, dka_x, peri_y, peri_w, peri_h, "Diabetic Ketoacidosis (DKA)",
                "Can occur in T2DM under severe stress (infection, MI, missed insulin).\n\n"
                "**Core therapy:\nIV isotonic fluids -> insulin infusion (~0.1 U/kg/h) -> "
                "REPLACE POTASSIUM before/with insulin (insulin drives K+ intracellularly) -> "
                "treat underlying trigger.\n\n"
                "**Location:\nICU / intermediate care with continuous monitoring.",
                LIGHT_ORANGE, ORANGE, body_fs=7.3)

hhs_x = dka_x + peri_w + 20
draw_titled_box(c, hhs_x, peri_y, peri_w, peri_h, "Hyperosmolar Hyperglycemic State (HHS)",
                "Classic T2DM presentation - elderly, no significant ketosis, markedly elevated osmolality.\n\n"
                "**Core therapy:\nAggressive fluid resuscitation is the PRIORITY.\n"
                "Low-dose insulin (~0.05 U/kg/h) only if significant ketonemia present.\n\n"
                "**Caution:\nCorrect slowly - avoid rapid osmotic shifts / cerebral edema.",
                LIGHT_RED, RED, body_fs=7.3)

footer(c, 4, TOTAL_PAGES)
c.showPage()

c.save()
print("Saved:", OUT)