
Why is the fever seen periodically in malaria like every 3 to 4 days
malaria life cycle erythrocytic stage fever periodicity
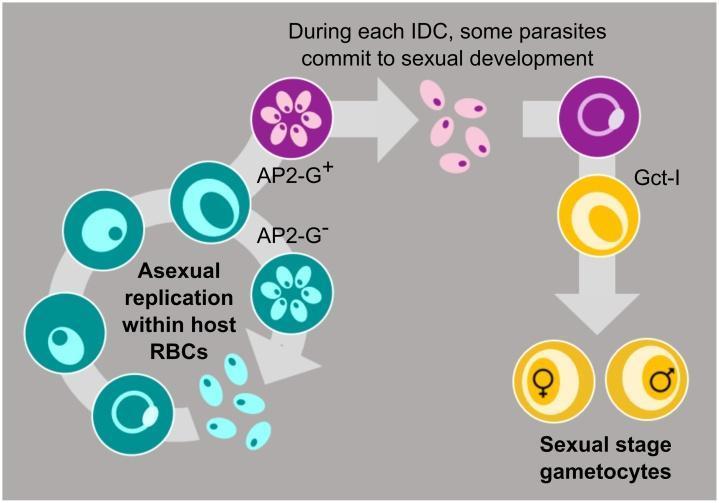
A medical educational diagram illustrating the Intra-erythrocytic Development Cycle (IDC) of the malaria parasite (Plasmodium spp.). The flowchart depicts two divergent pathways within a host red blood cell (RBC). The primary loop shows the asexual replication cycle, where parasites (teal circles) undergo maturation from a single parasite body into schizonts with multiple internal bodies, eventually bursting to release merozoites for further RBC infection. A secondary pathway illustrates sexual commitment, marked by the expression of the transcription factor AP2-G (represented by purple circles). Following this commitment, the parasites differentiate into sexual stages called gametocytes (yellow circles). The final stage of this differentiation demonstrates the formation of distinct male and female gametocytes, identified by gender symbols. The diagram highlights the biological decision-making process between continued asexual multiplication for within-host survival and the production of gametocytes for transmission to the mosquito vector, a key concept in malaria pathophysiology and lifecycle research.
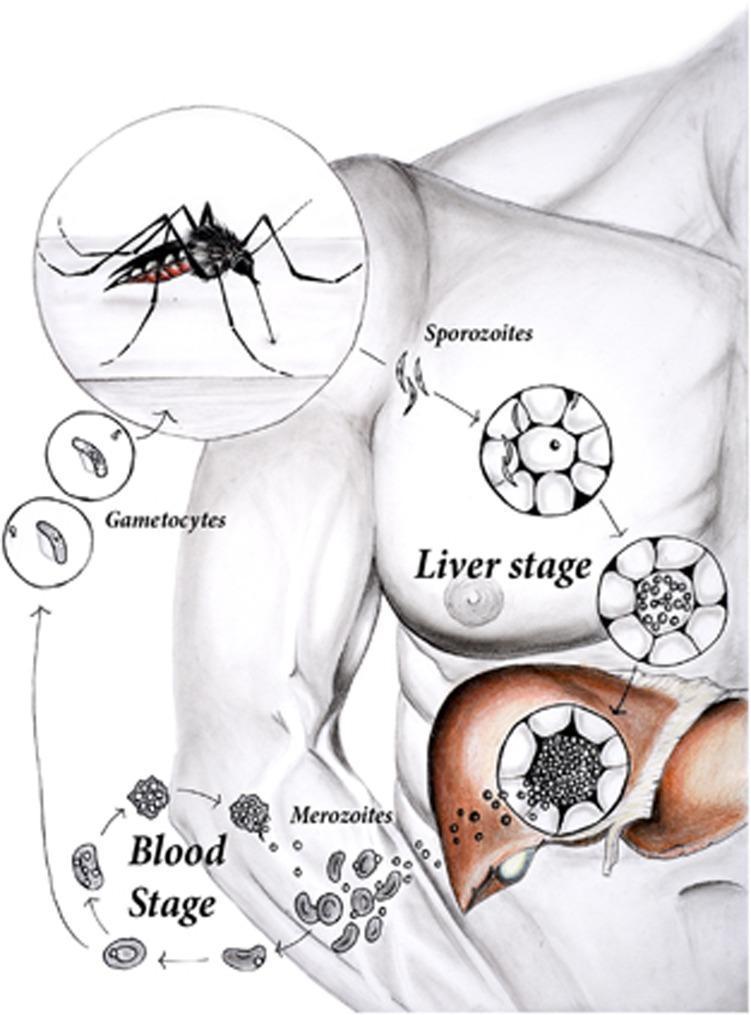
A medical illustration of the Plasmodium parasite lifecycle (Malaria) overlaying a human torso. The diagram details the vector-to-host transmission and the subsequent biological stages. It starts with an Anopheles mosquito vector introducing elongated sporozoites into the skin. The 'Liver stage' illustrates sporozoites entering hepatocytes, maturing into large schizonts filled with merozoites, and the subsequent rupture of liver cells. The 'Blood stage' depicts the erythrocytic cycle, where merozoites infect red blood cells (RBCs), replicate asexually, and cause RBC lysis. Distinctive crescent-shaped gametocytes are shown developing from the blood stage, signifying the potential for transmission back to a mosquito vector during a blood meal. Key educational concepts include the pre-erythrocytic (liver) and erythrocytic (blood) phases of infection, morphological differentiation of the parasite (sporozoite, schizont, merozoite, gametocyte), and the role of the mosquito as a disease vector. The diagram is designed for intermediate medical students to understand the pathogenesis and sequential progression of Malaria.
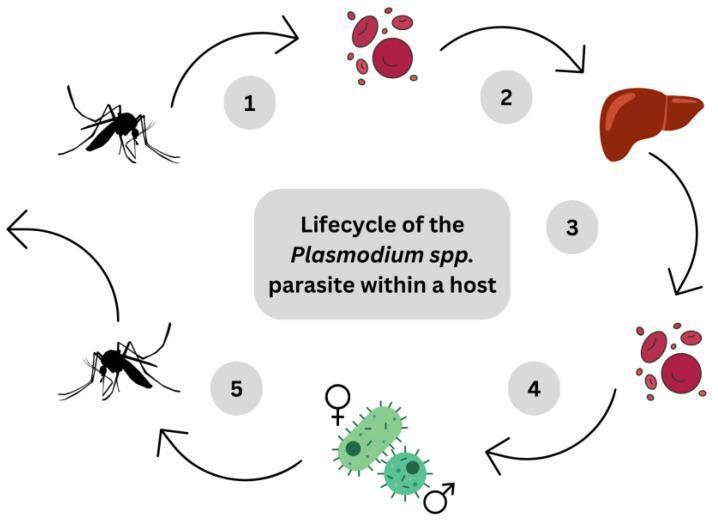
A pathophysiology diagram illustrating the human lifecycle of the Plasmodium spp. parasite, the causative agent of malaria. The diagram follows a numbered, clockwise circular flow consisting of five stages. Stage 1 depicts a mosquito vector, representing the inoculation of sporozoites into the host bloodstream. Stage 2 shows the transition of sporozoites through the bloodstream toward the liver, represented by a reddish-brown anatomical illustration of the organ. Stage 3 illustrates the intrahepatic phase where sporozoites mature into schizonts and merozoites within hepatocytes. Stage 4 depicts the erythrocytic cycle, where merozoites infect and lyse red blood cells, eventually developing into male and female gametocytes (marked with biological sex symbols). Stage 5 shows the uptake of these gametocytes by a second mosquito during a blood meal. The visual serves as an educational summary of the parasite's progression from the initial bite to the liver stage and subsequent blood-stage infection, highlighting key anatomical sites including the circulatory system, liver, and erythrocytes.
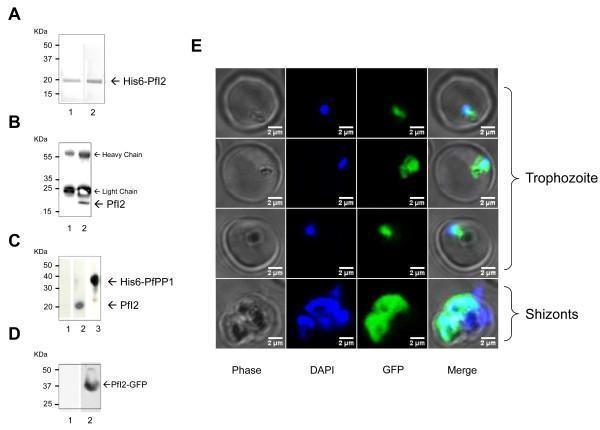
This composite image illustrates the molecular analysis and subcellular localization of the Plasmodium falciparum Inhibitor-2 (PfI2) protein. Panels A-D display western blots: (A) demonstrates purified His6-PfI2 at ~20 kDa; (B) shows immunoprecipitated native PfI2 with corresponding heavy and light chains; (C) reveals interaction between PfI2 and His6-PfPP1 (~40 kDa) via affinity purification; and (D) confirms the expression of a PfI2-GFP fusion protein at ~37 kDa. Panel E presents fluorescence microscopy of live transfectants across the erythrocytic cell cycle. It uses Phase contrast, DAPI (nuclear staining, blue), and GFP (PfI2-GFP, green) channels to visualize localization. In the trophozoite stage, PfI2-GFP exhibits a concentrated nucleo-cytoplasmic distribution near the nucleus. In the shizont stage, both DAPI and GFP signals become more diffuse and intense, occupying a larger volume of the parasite with significant overlap. The absence of GFP signal in the digestive vacuole is noted. This figure serves as a diagnostic and educational resource for understanding parasite protein expression and regulatory interactions in malaria research.
Why Malaria Fever is Periodic
The Core Mechanism: Erythrocytic (Blood) Stage Synchronization
- Parasite-derived pyrogens are released directly at the moment of red cell rupture
- The debris (parasitic material + erythrocyte remnants) is ingested by macrophages, which then release pro-inflammatory cytokines - primarily IL-1 and TNF - that act on the hypothalamus to raise body temperature
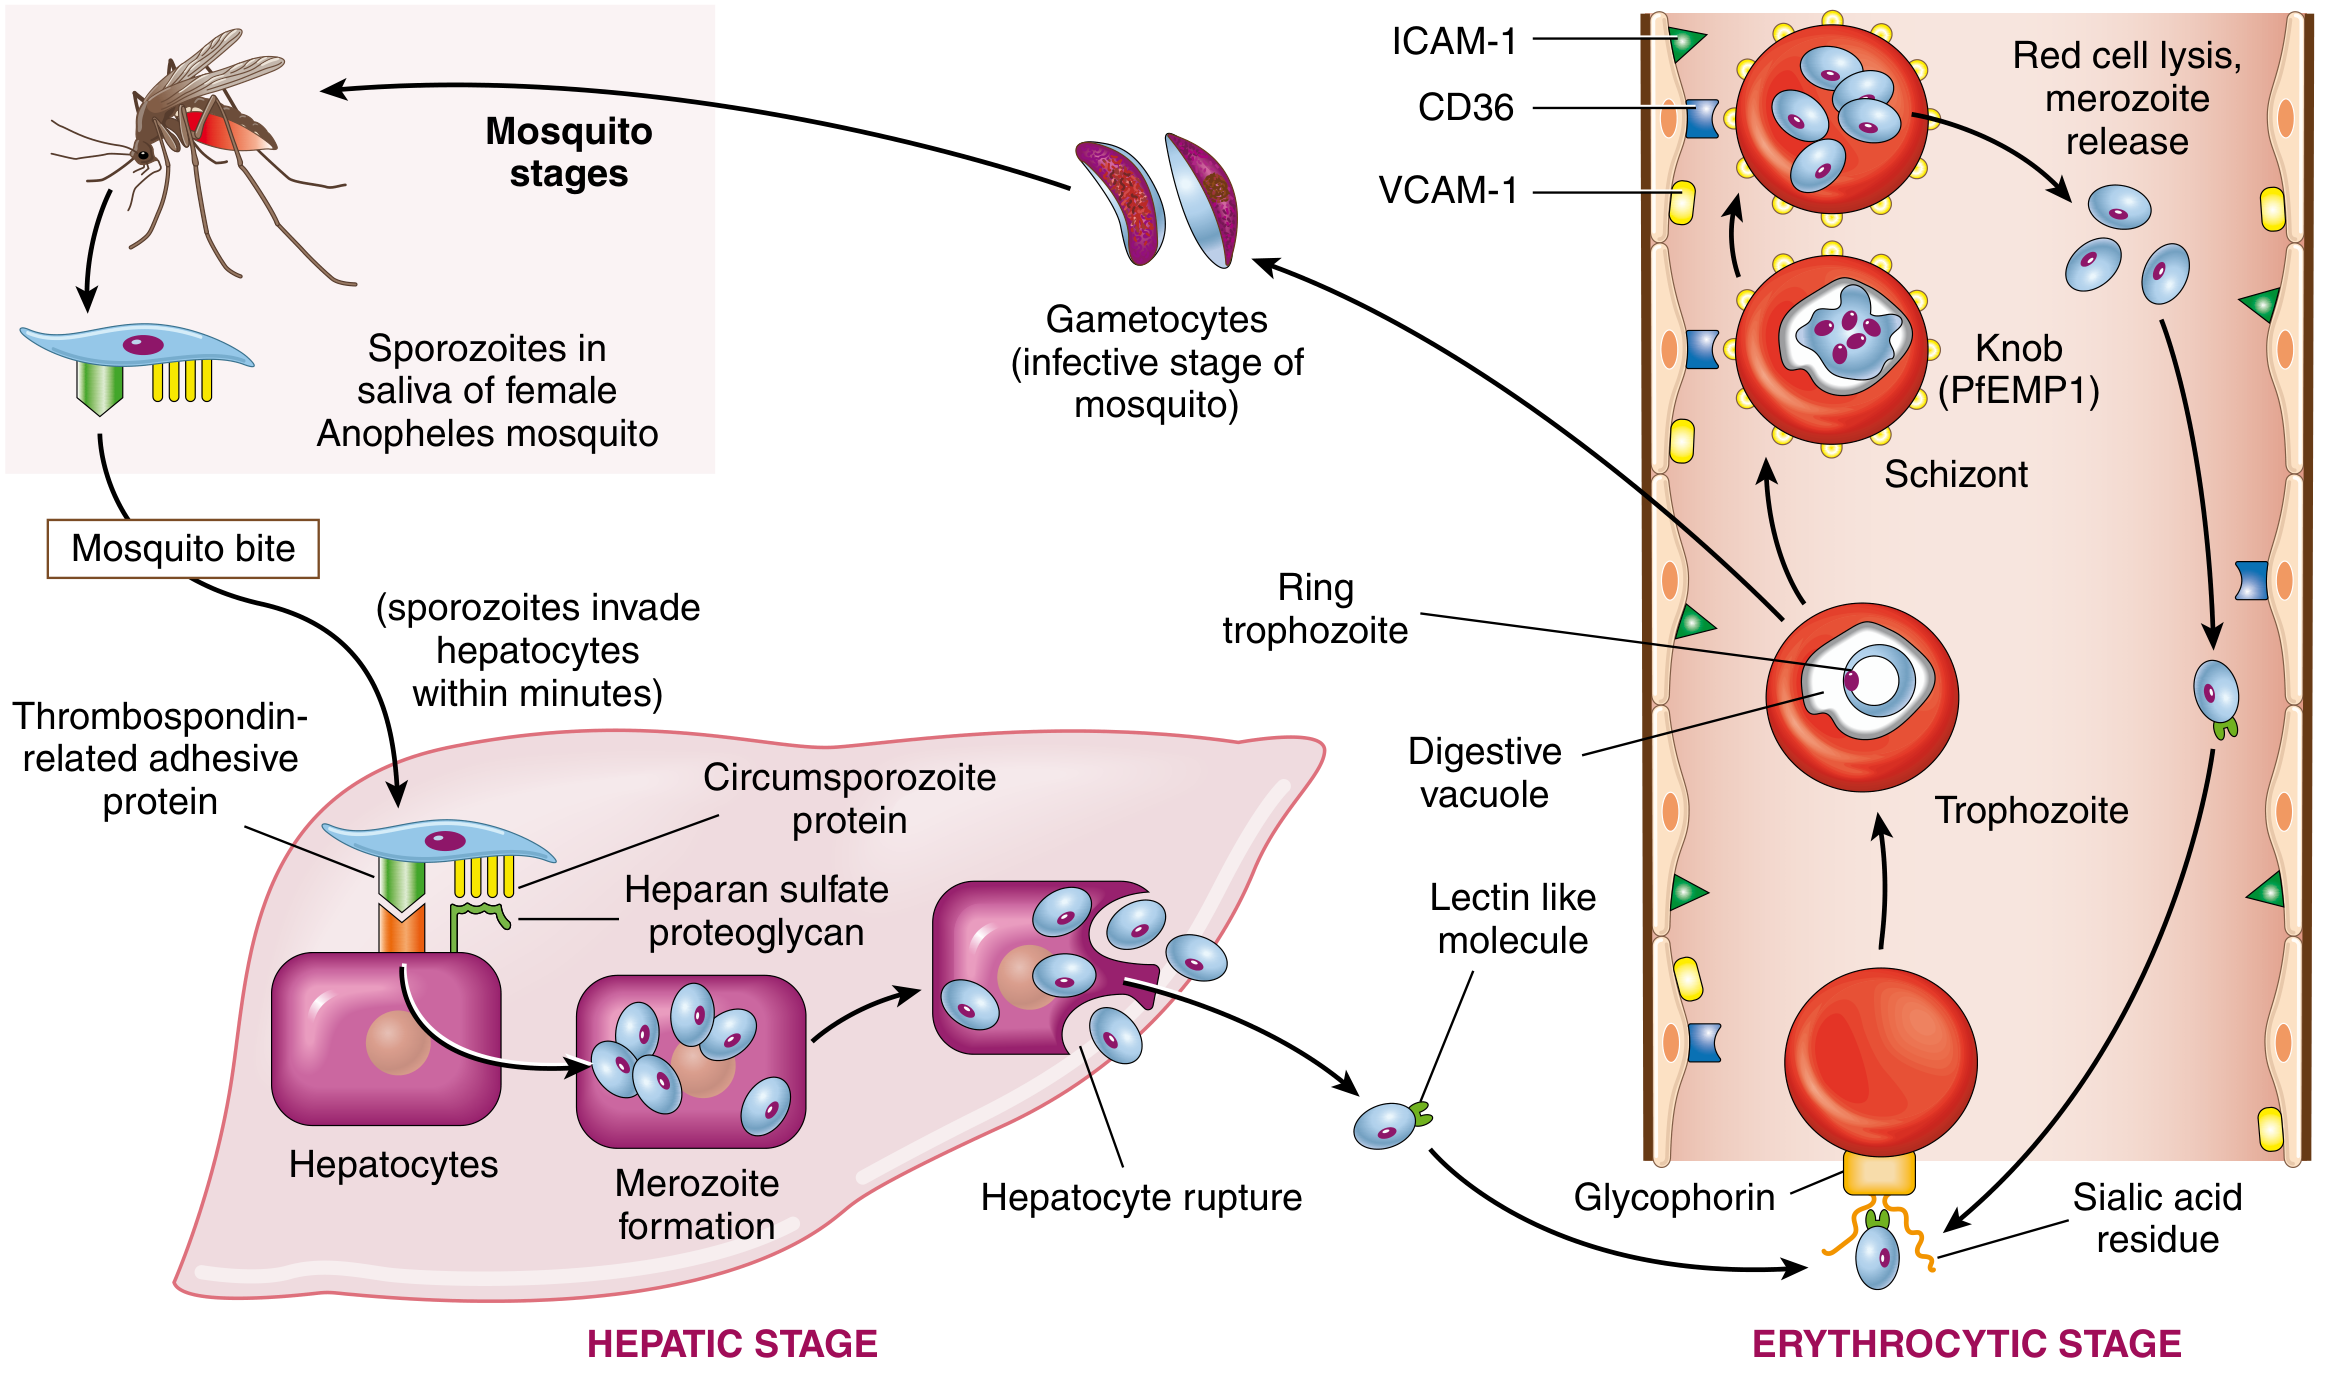
Why is it Periodic (Every 48 or 72 Hours)?
| Species | Erythrocytic Cycle | Fever Pattern | Name |
|---|---|---|---|
| P. vivax | 48 hours | Every 3rd day (days 1, 3, 5...) | Benign tertian |
| P. ovale | 48 hours | Every 3rd day | Ovale tertian |
| P. falciparum | 48 hours | Every 3rd day (often irregular) | Malignant tertian |
| P. malariae | 72 hours | Every 4th day (days 1, 4, 7...) | Quartan |
| P. knowlesi | 24 hours | Daily | Quotidian |
Why "every 3rd day" from a 48-hour cycle? The fever on day 1 + next fever 48 hours later = day 3, because both day 1 and day 3 are counted (the old counting convention is inclusive). So a 48-hour cycle = tertian (3rd day), and a 72-hour cycle = quartan (4th day).
Why P. falciparum is Often Irregular
- High-temperature-induced changes to the membrane architecture of infected RBCs disrupt synchronization
- Sequestration of infected RBCs in deep capillaries (via PfEMP1 binding to ICAM-1, CD36, VCAM-1) interferes with the normal cycle
- The fever can be more or less continuous in heavy infections
Classic Fever Paroxysm: 3 Stages
- Cold stage (rigors, chills) - lasting ~15-60 min - as merozoites flood the blood
- Hot stage (high fever, 40-41°C) - lasting ~2-6 hours - as cytokines peak
- Sweating stage - fever breaks, profuse sweating, exhaustion
- Sherris & Ryan's Medical Microbiology, 8th Ed. - Pathogenesis of Malaria, p. 1699
- Robbins, Cotran & Kumar: Pathologic Basis of Disease - Pathogenesis, p. 372