
DNA transcription
DNA transcription RNA polymerase diagram
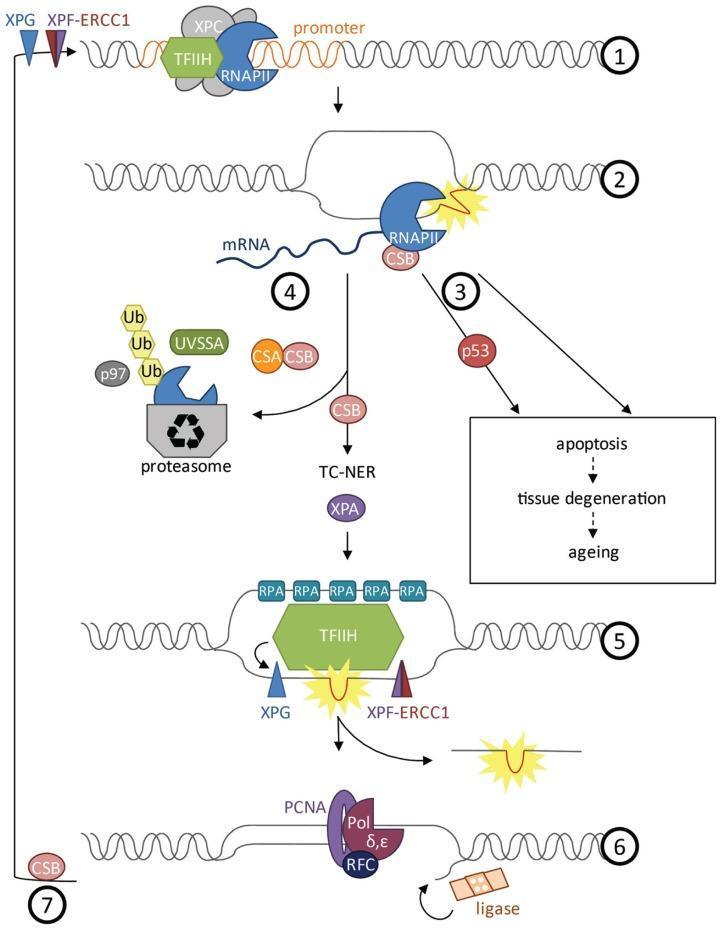
A detailed molecular pathophysiology diagram illustrating the Transcription-Coupled Nucleotide Excision Repair (TC-NER) pathway in human cells. The seven-step flowchart depicts the cellular response to DNA damage during transcription. (1) Initiation: RNA Polymerase II (RNAPII), TFIIH, and XPC assemble at the promoter. (2) Elongation and Stall: RNAPII and CSB encounter a DNA lesion (yellow starburst). (3) Signaling: Stalled polymerase triggers p53-dependent or independent apoptosis, contributing to aging and tissue degeneration. (4) Preparation for Repair: RNAPII undergoes polyubiquitylation (Ub) involving UVSSA and p97, leading to its degradation by the proteasome to clear the site. (5) Excision: TFIIH unwinds the DNA helix while RPA coats single-stranded segments. Endonucleases XPG and XPF-ERCC1 perform dual incisions to remove the damaged oligonucleotide. (6) Resynthesis: DNA polymerases delta/epsilon (Pol δ,ε), aided by PCNA and RFC, fill the gap, and DNA ligase seals the remaining nick. (7) Restoration: Re-initiation of transcription following successful repair. This diagram serves as an educational tool for genetics and molecular oncology, focusing on DNA maintenance mechanisms.
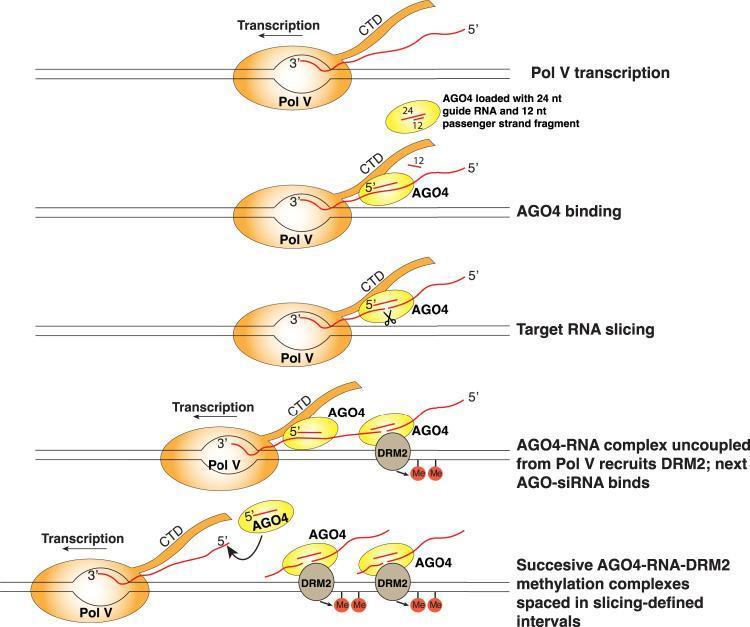
This molecular biology diagram illustrates a five-step model for discontinuous RNA-directed DNA methylation (RdDM) involving the coordination of Pol V, AGO4, and DRM2. 1) Pol V transcription: RNA polymerase V transcribes scaffold RNA from a DNA template. 2) AGO4 binding: An ARGONAUTE 4 (AGO4) protein, pre-loaded with a 24-nt guide RNA and a 12-nt passenger fragment, binds to the nascent Pol V transcript via protein-protein interactions with the Pol V C-terminal domain (CTD). 3) Target RNA slicing: AGO4 cleaves the Pol V transcript at specific sites. 4) Recruitment of DRM2: The sliced AGO4-RNA complex uncouples from the polymerase and recruits DRM2 (Domains Rearranged Methyltransferase 2), which initiates DNA methylation (indicated by 'Me' markers). 5) Formation of methylation intervals: The process repeats as Pol V continues elongation, resulting in multiple, successive AGO4-RNA-DRM2 complexes tethered along the DNA at slicing-defined intervals. This mechanism explains how cotranscriptional slicing by AGO4 facilitates the recruitment of the DNA methylation machinery in a spatially discrete manner.
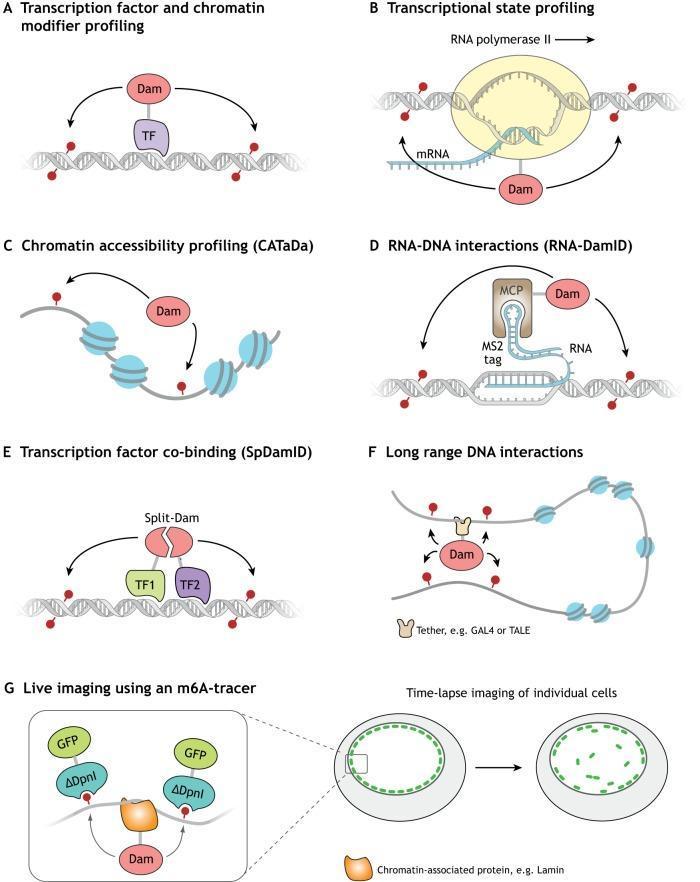
This molecular biology diagram illustrates the versatility of DNA adenine methyltransferase identification (DamID) technology in genomic research. The figure is organized into seven panels (A-G), depicting various schematic molecular interactions and live imaging applications. (A) Transcription factor (TF) and chromatin modifier profiling via Dam-TF fusion. (B) Transcriptional state profiling through Dam-RNA polymerase II fusion. (C) Chromatin accessibility profiling (CATaDa) using untethered Dam to mark open DNA. (D) RNA-DNA interaction profiling (RNA-DamID) utilizing an MCP-Dam fusion protein that targets MS2-tagged RNA. (E) Split-DamID for identifying transcription factor co-binding, where functional methylase is reconstituted upon TF1 and TF2 proximity. (F) Assessment of long-range DNA interactions and chromatin looping by tethering Dam to specific loci (e.g., using GAL4 or TALE). (G) Live-cell imaging using an m6A-tracer, where GFP-fused DpnI recognizes methylated GATC sites, allowing for time-lapse visualization of chromatin-associated proteins like lamin within the nucleus. The diagram highlights foundational epigenetics and transcriptomics research tools.
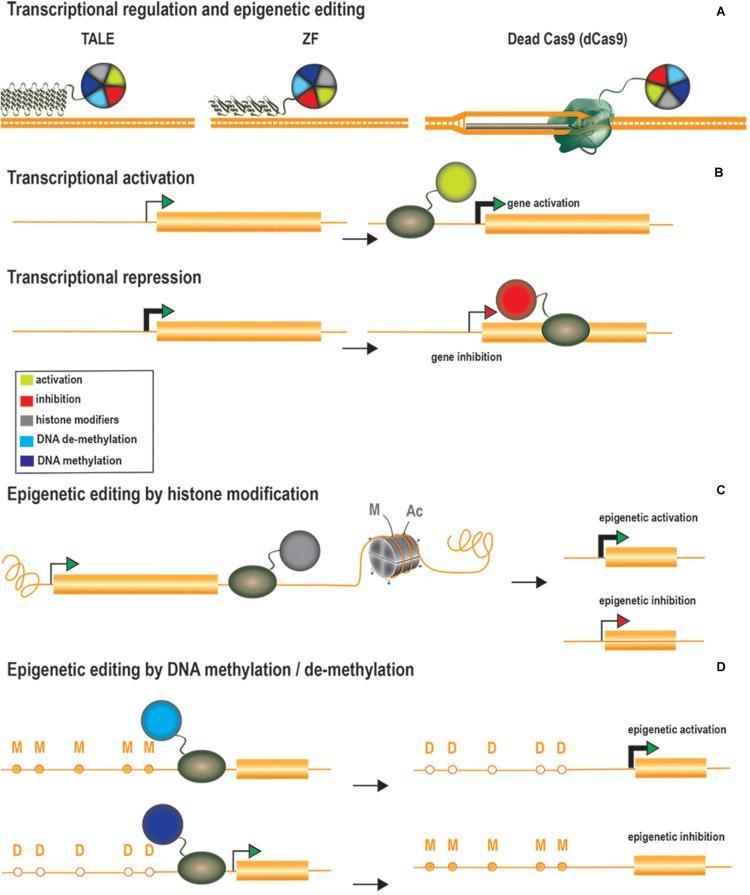
Educational diagram illustrating genome regulation and epigenetic editing technologies divided into four sections (A-D). Section A shows three DNA-binding platforms: Transcription Activator-Like Effectors (TALE), Zinc Fingers (ZF), and Dead Cas9 (dCas9) fused to colorful modulator spheres. Section B depicts transcriptional regulation; activation is shown with an effector (green circle) binding the promoter region to upregulate gene expression, while repression shows an inhibitor (red circle) binding downstream of the transcription start site to block RNA polymerase, resulting in gene inhibition. Section C illustrates epigenetic editing via histone modification, where grey spheres (histone modifiers) alter histone marks (M for methylation, Ac for acetylation) on nucleosomes to achieve epigenetic activation or inhibition. Section D details DNA methylation/de-methylation; demethylation (converting 'M' to 'D') leads to epigenetic activation, whereas methylation (converting 'D' to 'M') leads to epigenetic inhibition. This pathophysiology diagram demonstrates therapeutic strategies for modulating gene expression through site-specific recruitment of transcriptional and epigenetic modifiers.
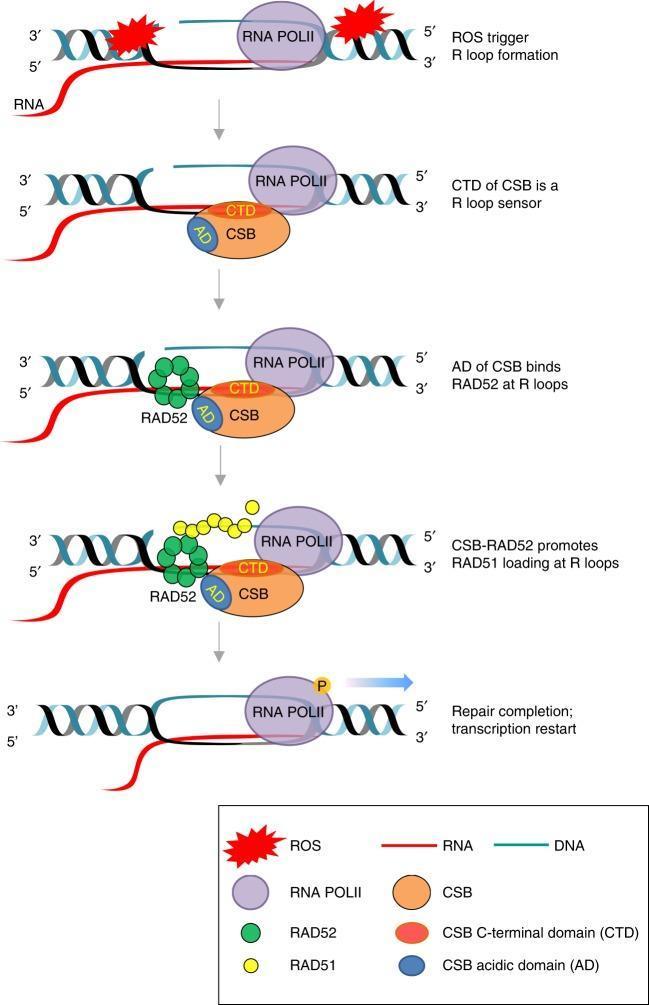
This pathophysiology diagram illustrates the sequential molecular mechanism of Transcription-Coupled Homologous Recombination (TC-HR) initiated by Reactive Oxygen Species (ROS). The process is depicted in five stages: 1) ROS exposure induces R-loop formation (DNA:RNA hybrids) in actively transcribed genomic regions where RNA Polymerase II (RNA POLII) is present. 2) The Cockayne Syndrome B (CSB) protein acts as a sensor, with its C-terminal domain (CTD) directly recognizing the R-loop. 3) The Acidic Domain (AD) of CSB recruits and binds the repair protein RAD52 to the site of damage. 4) The CSB-RAD52 complex facilitates the loading of RAD51 onto the displaced single-stranded DNA of the R-loop. 5) Following successful DNA repair, transcription restarts as indicated by the movement of RNA POLII and production of an RNA transcript. This model highlights a BRCA1/2-independent pathway for maintaining genomic stability during oxidative stress in transcribed regions, involving key proteins CSB, RAD52, and RAD51.
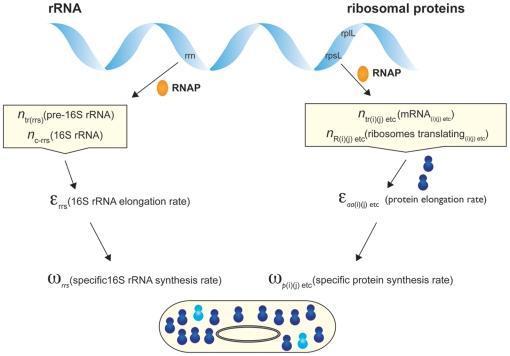
A pathophysiology diagram illustrating the synthesis pathways for ribosomal RNA (rRNA) and ribosomal proteins within a bacterial cell context. The diagram is split into two parallel flows originating from a double-stranded DNA helix. The left side depicts rRNA synthesis, showing RNA Polymerase (RNAP) interacting with 'rrn' operons to produce pre-16S rRNA and 16S rRNA. This process is quantified by the 16S rRNA elongation rate (ε_rrs) and the specific 16S rRNA synthesis rate (ω_rrs). The right side shows ribosomal protein synthesis, where RNAP transcribes 'rpsL' and 'rplL' genes into mRNA, followed by translation by ribosomes. This flow is quantified by the protein elongation rate (ε_aa) and the specific protein synthesis rate (ω_p). At the bottom, a schematic of a bacterium contains dark and light blue clusters representing mature and newly synthesized ribosomes, respectively. The diagram serves as an educational tool for understanding the rate-limiting steps in ribosome biogenesis and the coupling of transcription and translation in prokaryotic molecular biology.
eukaryotic transcription initiation TATA box RNA polymerase II promoter
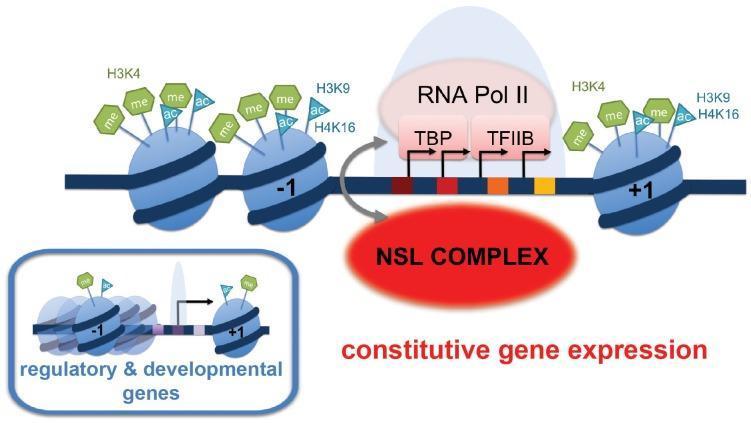
A pathophysiology diagram illustrating the molecular mechanisms of transcriptional regulation in Drosophila, specifically contrasting constitutive (housekeeping) genes with regulatory and developmental genes. The primary illustration depicts a housekeeping gene promoter characterized by a dispersed transcription start site (TSS) with multiple initiation points. Key components include the NSL complex, which facilitates the recruitment of the Pre-Initiation Complex (PIC), consisting of RNA Polymerase II, TBP, and TFIIB. The DNA is wrapped around nucleosomes labeled -1 and +1, showing enrichment of specific epigenetic marks: histone methylations (H3K4me2/3, represented by green 'me' hexagons) and acetylations (H3K9ac and H4K16ac, represented by blue 'ac' triangles). Core promoter elements like DRE, E-box, and motif 1 are shown as colored squares along the DNA. An inlay compares this to 'regulatory & developmental genes,' which feature a more compact nucleosome configuration, a focused TSS, and a characteristic TATA-box promoter element, demonstrating how promoter architecture dictates transcriptional recruitment strategies.
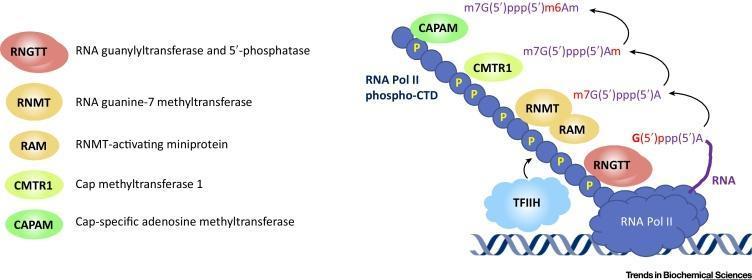
This pathophysiology diagram illustrates the sequential recruitment of mRNA capping enzymes to RNA polymerase II (Pol II) during eukaryotic transcription. The visual highlights the RNA Pol II C-terminal domain (CTD), which is shown as a chain of beads phosphorylated on serine 5 residues (indicated by 'P' circles). This phosphorylated CTD acts as a scaffold for the recruitment of four major enzyme complexes in a specific order: RNGTT (RNA guanylyltransferase and 5'-phosphatase), RNMT-RAM (RNA guanine-7 methyltransferase and its activating miniprotein), CMTR1 (cap methyltransferase 1), and CAPAM (cap-specific adenosine methyltransferase). As the nascent RNA (represented by a purple strand) emerges from Pol II, it undergoes a stepwise modification of its 5' end. The diagram depicts the chemical evolution of the cap structure from G(5')ppp(5')A to m7G(5')ppp(5')m6Am, with newly added chemical groups highlighted in red. This illustration demonstrates the structural and temporal coordination between transcription elongation and RNA processing, emphasizing the role of the phospho-CTD in organizing the mRNA capping machinery.
A detailed molecular pathophysiology diagram illustrating the Transcription-Coupled Nucleotide Excision Repair (TC-NER) pathway in human cells. The seven-step flowchart depicts the cellular response to DNA damage during transcription. (1) Initiation: RNA Polymerase II (RNAPII), TFIIH, and XPC assemble at the promoter. (2) Elongation and Stall: RNAPII and CSB encounter a DNA lesion (yellow starburst). (3) Signaling: Stalled polymerase triggers p53-dependent or independent apoptosis, contributing to aging and tissue degeneration. (4) Preparation for Repair: RNAPII undergoes polyubiquitylation (Ub) involving UVSSA and p97, leading to its degradation by the proteasome to clear the site. (5) Excision: TFIIH unwinds the DNA helix while RPA coats single-stranded segments. Endonucleases XPG and XPF-ERCC1 perform dual incisions to remove the damaged oligonucleotide. (6) Resynthesis: DNA polymerases delta/epsilon (Pol δ,ε), aided by PCNA and RFC, fill the gap, and DNA ligase seals the remaining nick. (7) Restoration: Re-initiation of transcription following successful repair. This diagram serves as an educational tool for genetics and molecular oncology, focusing on DNA maintenance mechanisms.
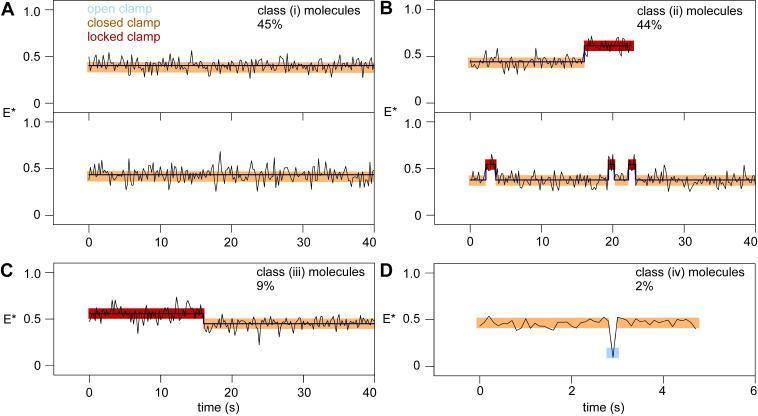
This figure presents single-molecule fluorescence resonance energy transfer (smFRET) time trajectories of RNA polymerase (RNAP) clamp dynamics during promoter binding and unwinding. The data is categorized into four classes based on the E* (apparent FRET efficiency) trajectories, which serve as a proxy for clamp conformational states. Class I (45%) shows a stable closed-clamp state (E* ≈ 0.40, highlighted in orange). Class II (44%) demonstrates a transition from a closed-clamp state to a higher E* 'locked-clamp' state (E* ≈ 0.48, highlighted in red). Class III (9%) begins in a locked-clamp state and reverts to a closed-clamp state. Class IV (2%) is rare, showing fluctuations between closed and 'open-clamp' states (E* ≈ 0.20, highlighted in cyan). The trajectories were analyzed using a Hidden Markov Model (HMM), with colored bands representing distinct structural states. This visualization illustrates the 'bind-unwind-load-and-lock' mechanism of bacterial transcription initiation, emphasizing that the RNAP clamp remains closed or locked throughout the promoter unwinding process.
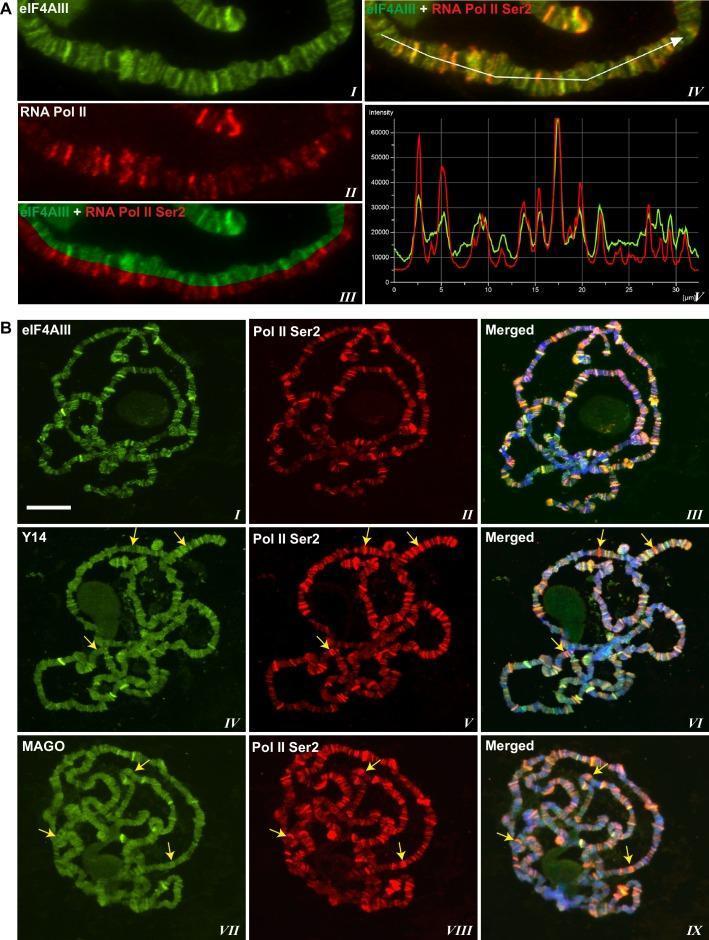
This figure contains fluorescence microscopy images and line-scan plots demonstrating the co-localization of Exon Junction Complex (EJC) proteins with active RNA polymerase II on Drosophila polytene chromosomes. Panel A shows a magnified chromosome segment using double immunostaining for eIF4AIII (green) and Pol II Ser2 (red), a marker for transcription elongation. A linear intensity profile (V) generated from a line scan (IV) confirms overlapping peaks, indicating spatial co-localization at transcriptionally active interbands. Panel B presents whole-chromosome spreads for three EJC components: eIF4AIII, Y14, and MAGO (green) compared with RNA Pol II Ser2 (red). While eIF4AIII shows high concordance with Pol II Ser2 sites, yellow arrows in the middle and bottom rows highlight specific transcription sites where Pol II Ser2 is present but Y14 and MAGO signals are absent or significantly weaker. The scale bar represents 20 µm. These visuals illustrate the differential recruitment and association patterns of EJC core proteins at active transcriptional sites within a eukaryotic nucleus.
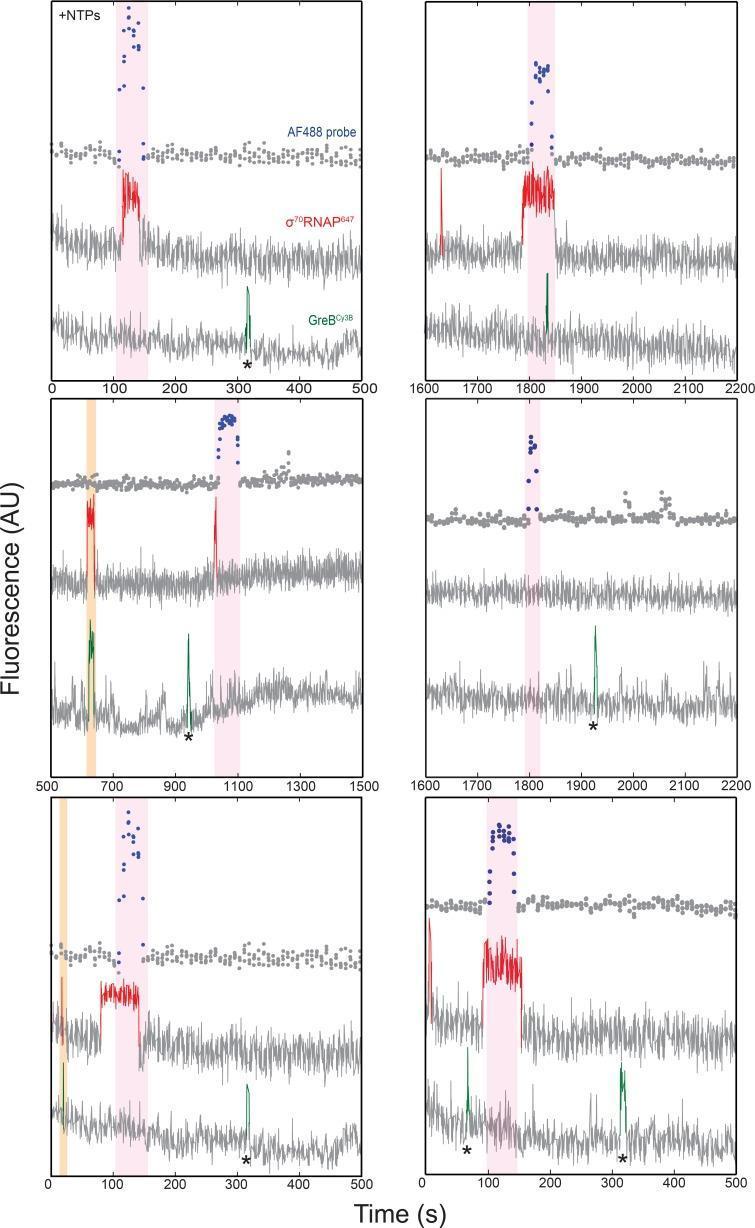
This scientific visualization presents fluorescence intensity records from single-molecule CoSMoS (Colocalization Single-Molecule Spectroscopy) experiments, used to study transcription initiation mechanisms at the rRNA promoter rrnB P1. The image contains six separate panels, each plotting fluorescence in Arbitrary Units (AU) over time in seconds (s). Within each panel, three distinct signal traces are vertically stacked: 1. Top (Grey): AF488-oligo probe signal, indicating transcript hybridization. 2. Middle (Red): σ70RNAP647 signal, indicating RNA polymerase holoenzyme presence at the DNA template. 3. Bottom (Green): GreBCy3B signal, indicating the presence of the transcript cleavage factor GreB. Two types of molecular interactions are highlighted with colored vertical bars: - Pink bars indicate transcription initiation events, characterized by a persistent increase in the red σ70RNAP647 trace followed by a spike in the top grey AF488 probe trace (successful transcription). - Orange bars indicate co-localization events where σ70RNAP647 and GreBCy3B arrive and depart simultaneously from the DNA, representing the formation of a polymerase-GreB complex that fails to initiate transcription (inhibitory interaction). These records demonstrate how GreB binding to the RNAP holoenzyme before DNA association introduces a barrier to initiation, effectively repressing rRNA synthesis.
DNA Transcription
What Is Transcription?
- Harper's Illustrated Biochemistry, 32nd Ed.
Prokaryotic vs. Eukaryotic Transcription
| Feature | Prokaryotes | Eukaryotes |
|---|---|---|
| Location | Cytoplasm | Nucleus |
| RNA polymerases | One (core + σ factor) | Three (Pol I, II, III) |
| Promoter elements | -10 (Pribnow) and -35 boxes | TATA box (~-25 to -30) and other elements |
| Transcript processing | Minimal | Extensive (capping, splicing, poly-A tail) |
| Coupling | Transcription + translation coupled | Physically separated |
-
RNA polymerase I - transcribes rRNA (28S, 18S)
-
RNA polymerase II - transcribes all protein-coding genes (mRNAs) and snRNAs
-
RNA polymerase III - transcribes tRNAs, 5S rRNA, and other small RNAs
-
Tietz Textbook of Laboratory Medicine, 7th Ed.
The Transcription Cycle (6 Steps)
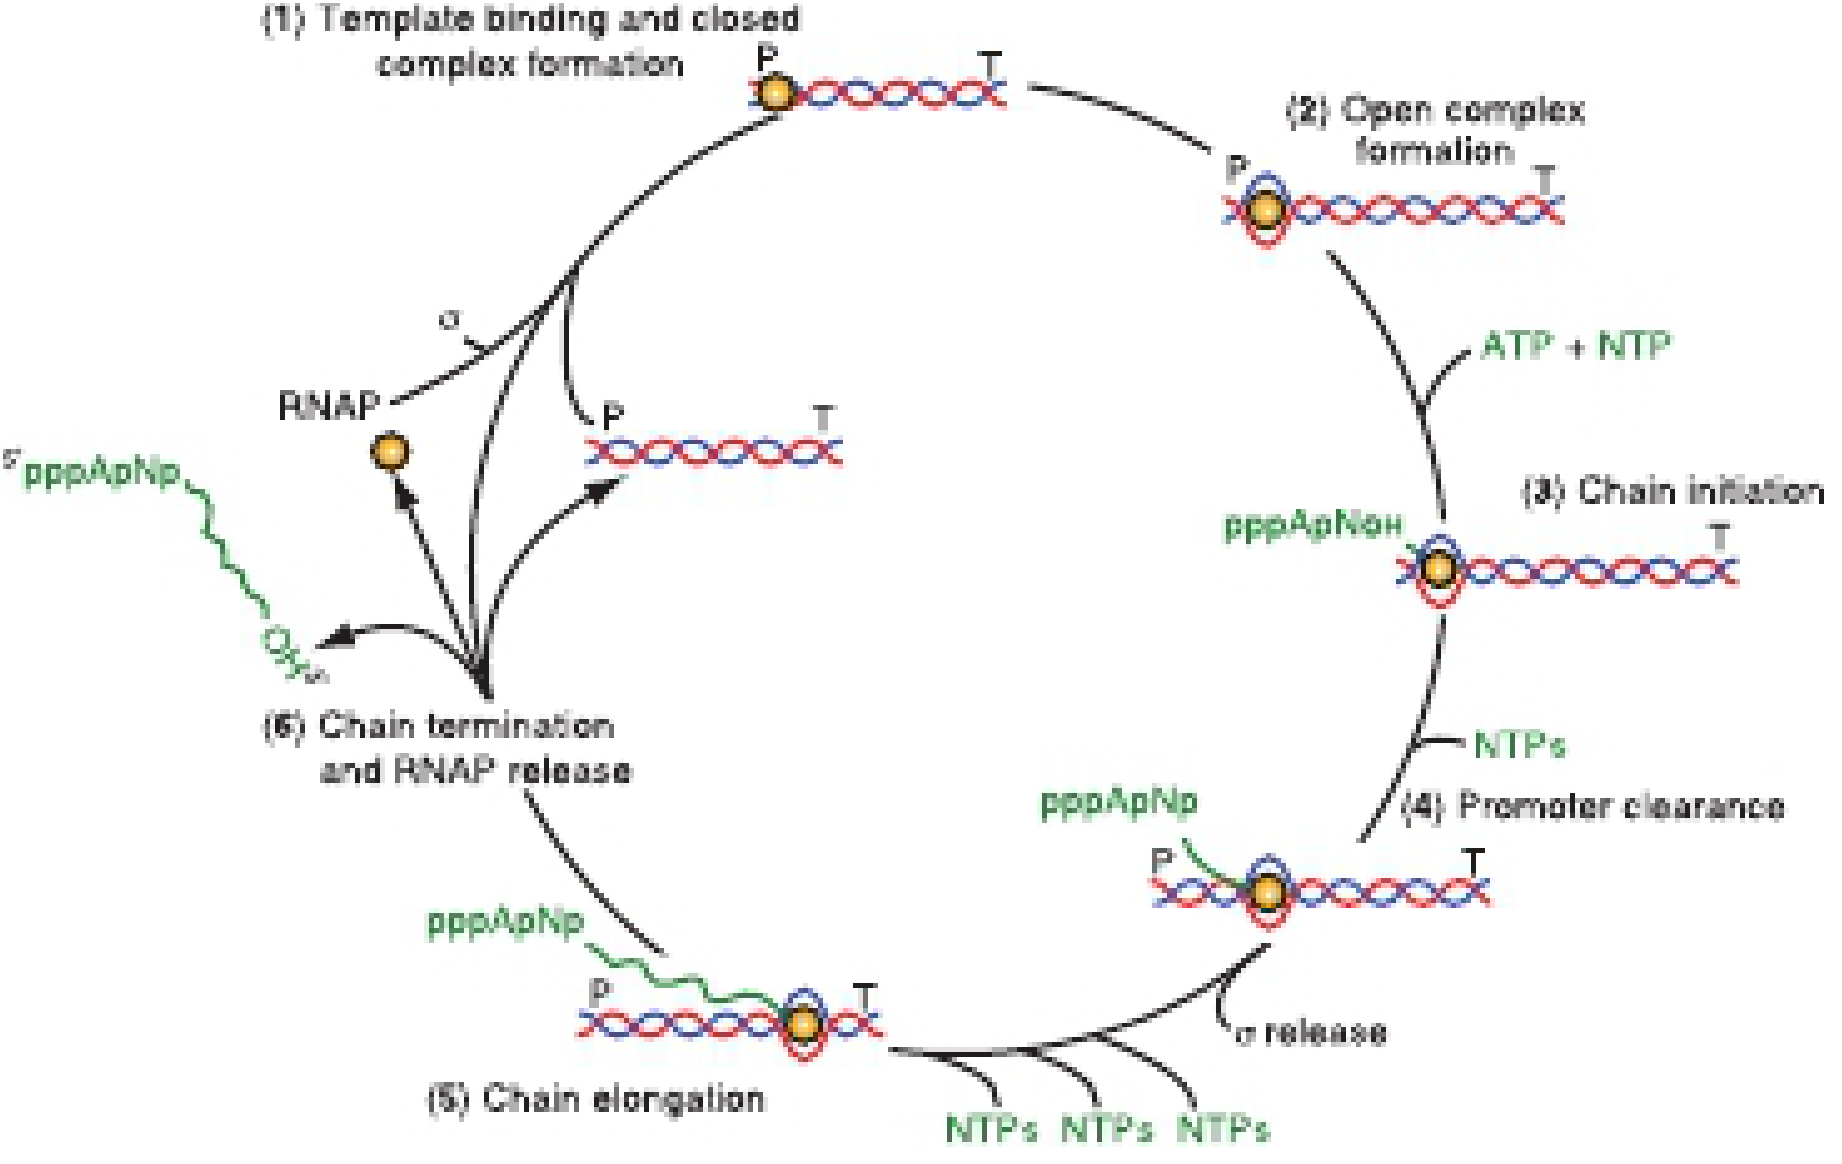
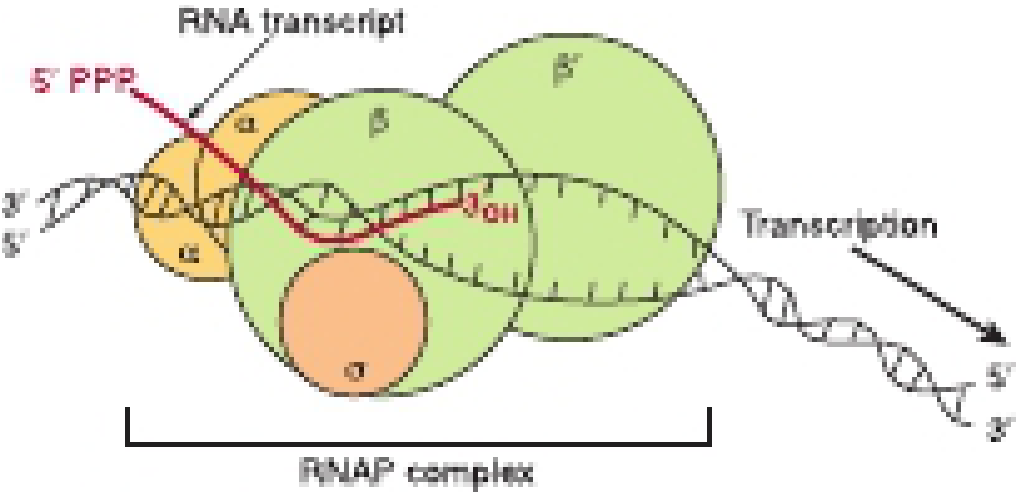
Step 1 - Template Binding and Closed Complex Formation
Step 2 - Open Complex Formation (Preinitiation Complex)
Step 3 - Chain Initiation
Step 4 - Promoter Clearance
Step 5 - Chain Elongation
Step 6 - Chain Termination and RNAP Release
-
Rho-independent (intrinsic): hairpin loop structure in the nascent RNA causes RNAP to pause and dissociate
-
Rho-dependent: Rho protein binds the RNA and translocates to catch the paused RNAP
-
Harper's Illustrated Biochemistry, 32nd Ed.
Eukaryotic Transcription Initiation in Detail
- TFIID binds to the TATA box (TATAAA sequence, located ~25-40 bp upstream of the TSS) - present in ~20-30% of promoters, especially highly regulated genes
- TFIID binding recruits other general transcription factors: TFIIA, TFIIB, TFIIE, TFIIF, and TFIIH
- Together with RNA Pol II, these form the pre-initiation complex (PIC)
- The double-stranded DNA separates at the promoter and the complex moves downstream
- Transcription factors bound at upstream enhancer or silencer elements (which can be thousands of bp away) loop back to interact with the PIC
- Tietz Textbook of Laboratory Medicine, 7th Ed.
Post-Transcriptional Processing (Eukaryotes)
| Modification | Location | Function |
|---|---|---|
| 5' Cap (7-methylguanosine) | 5' end | Protects from degradation; ribosome binding |
| Poly-A tail (adenosine stretch) | 3' end | Stability; nuclear export (signal: AAUAAA) |
| Splicing | Internal | Removes introns, joins exons via spliceosome |
| m6A methylation | Throughout | Coordinates processing and translation |
-
5' donor site - GU
-
3' acceptor site - AG
-
Tietz Textbook of Laboratory Medicine, 7th Ed. and Henry's Clinical Diagnosis and Management by Laboratory Methods
Types of RNA Produced
| RNA Class | Abundance | Stability | Role |
|---|---|---|---|
| mRNA | 2-5% of total | Unstable to very stable | Protein coding |
| rRNA (28S, 18S) | ~80% of total | Very stable | Ribosome structure |
| tRNA | ~15% of total | Very stable | Amino acid delivery |
| snRNA | ≤1% | Very stable | mRNA splicing |
| miRNA/siRNA | <1% | Stable | Gene silencing |
| lncRNA | ~1-2% | Variable | Gene regulation |
- Harper's Illustrated Biochemistry, 32nd Ed.
Key Points Summary
- Transcription reads the template strand 3'→5' and builds RNA 5'→3'
- The RNA product is identical to the coding strand (with U instead of T)
- No primer is needed - RNAP initiates de novo
- No proofreading - error rate is higher than DNA replication, but tolerated since many RNA copies are made per gene
- Promoters are upstream (5') regulatory sequences that define where RNAP binds
- Eukaryotic transcription requires general transcription factors and produces pre-mRNA that must be processed before translation