
Type 1 diabetes symptoms
type 1 diabetes symptoms signs clinical presentation
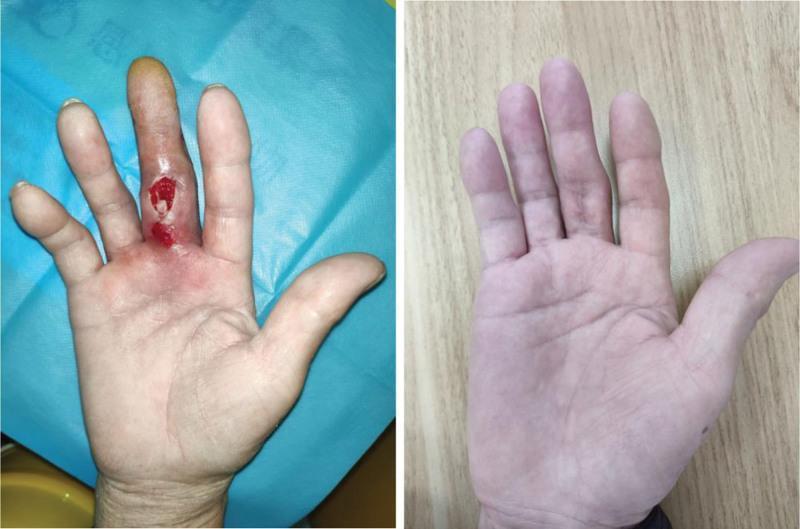
This clinical photograph set comprises two panels (A and B) comparing the presentation and resolution of a severe soft tissue infection on the right hand of a patient with type 2 diabetes. Panel A (Left) displays the palm and fingers during hospital admission, showing acute inflammatory signs localized to the middle finger. Findings include marked fusiform swelling, erythema, and a deep, irregular open wound over the proximal and middle phalanges with visible granulation tissue and purulent exudate. The distal aspect of the finger exhibits yellowish discoloration, suggesting impaired perfusion or advanced infection (pyogenic tenosynovitis). Panel B (Right) shows the same hand at a three-month follow-up after surgical debridement and targeted antibiotic therapy (Vancomycin). The image demonstrates complete resolution of edema and erythema, with a well-healed surgical scar on the volar surface of the middle finger and restoration of normal skin integrity and color. This comparison illustrates the clinical progression from an infected hand wound, complicated by Streptococcus gordonii, to successful recovery.
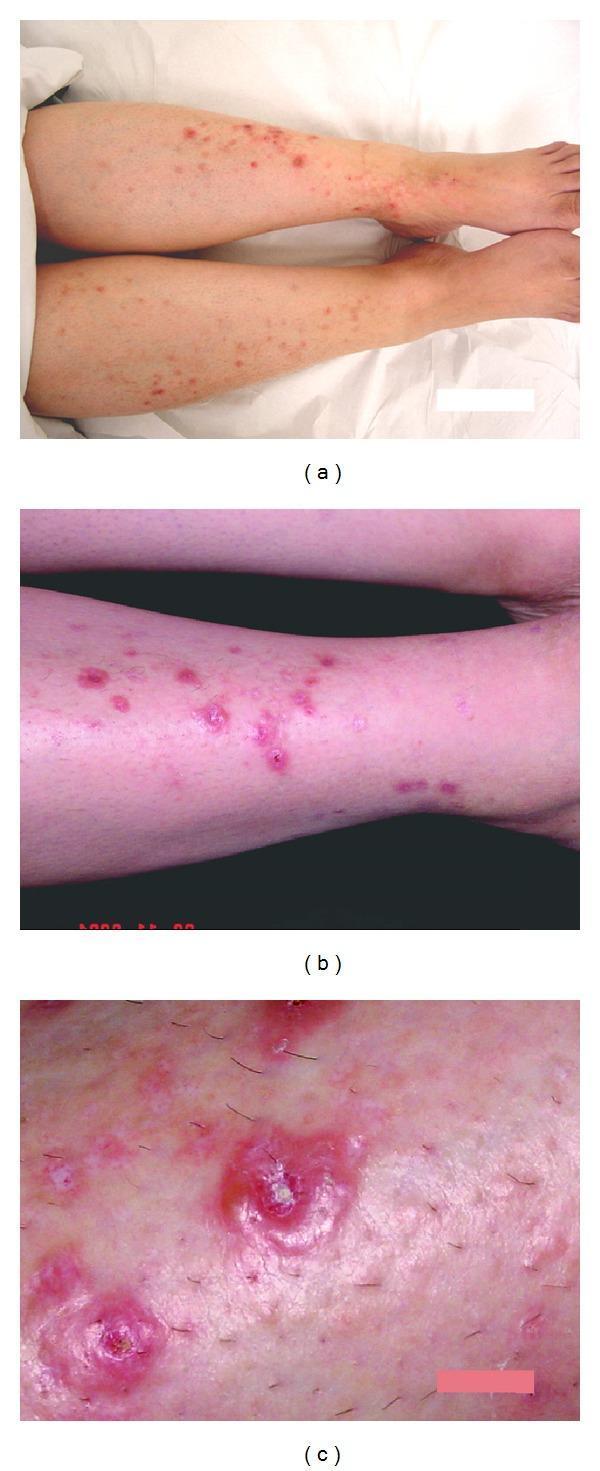
This set of clinical photographs demonstrates a bilateral and nearly symmetrical distribution of skin lesions on the anterior lower legs of a patient with uncontrolled type 2 diabetes. (a) An overview showing multiple, scattered, discrete vesicles and papules across the tibial surfaces. (b) A higher magnification view reveals tense, fluid-filled vesicles (3–7 mm) situated on an erythematous base, alongside lesions showing signs of umbilication and central crusting. (c) A close-up detail highlights the progression of the lesions from acute tense blistering to central crustations and the formation of fine, white, depressed (atrophic) scars in healed areas. The clinical presentation is characteristic of bullosis diabeticorum (diabetic bullae), illustrating the evolution from acute intraepidermal separation to scar formation in the context of poor metabolic control and impaired wound healing.
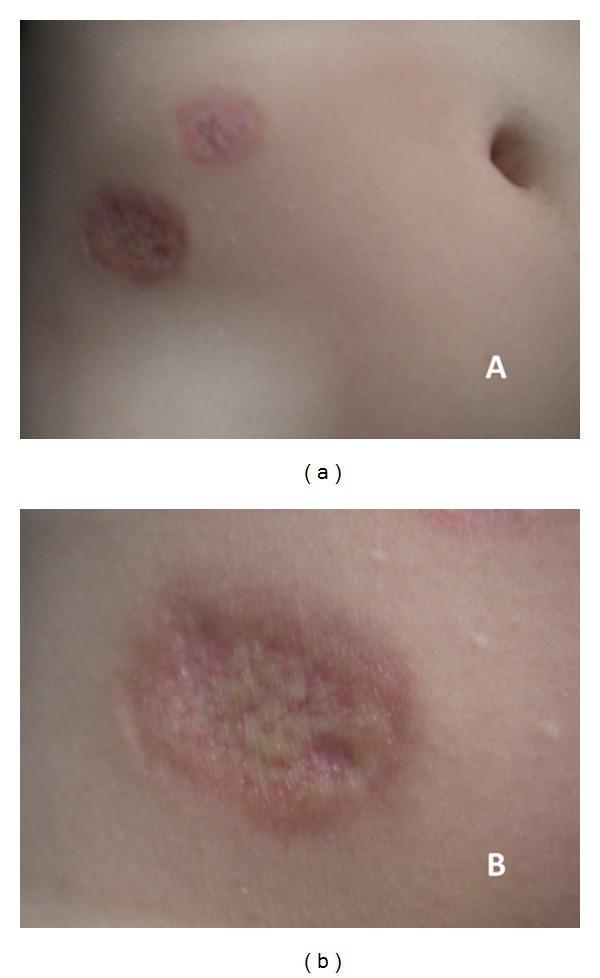
This clinical photograph displays two distinct, well-circumscribed skin lesions on the lower abdomen of a patient with type 1 diabetes, characteristic of Necrobiosis Lipoidica (NL). Panel (a) provides a wide view showing two oval-shaped plaques. Panel (b) offers a close-up macro view, highlighting the specific morphological features. The lesions demonstrate a central area of waxy, yellow-brown discoloration with visible cutaneous atrophy and telangiectasia. This central depression is sharply demarcated by a prominent, raised, and firm violaceous (purplish-red) border. The surrounding skin appears normal, emphasizing the clear margins of the inflammatory process. This visual presentation is a classic manifestation of NL, a granulomatous skin condition frequently associated with poor glycemic control. These educational images serve to illustrate the primary diagnostic features of the condition: atrophic center, yellowish hue, and peripheral violaceous elevation.
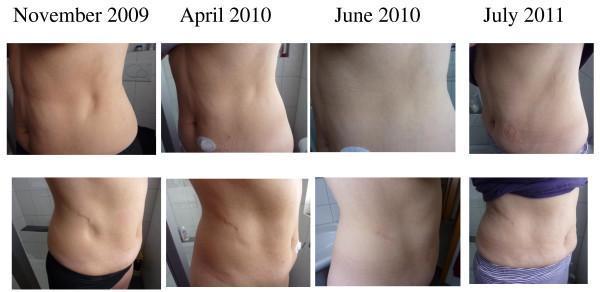
This clinical photographic timeline documents the progression and resolution of insulin-induced lipoatrophy in a 53-year-old female patient with type 1 diabetes. The series consists of eight panels arranged in two rows, comparing lateral and anterolateral views of the abdominal wall over four time points: November 2009, April 2010, June 2010, and July 2011. Initially, in November 2009, deep, well-demarcated cutaneous depressions and hollows are visible at previous insulin pump catheter insertion sites, indicating localized loss of subcutaneous adipose tissue. By April and June 2010, during and after low-dose prednisone therapy, these defects show progressive refilling and reduction in depth, with a return to a more even abdominal contour. The final images from July 2011 demonstrate clinical resolution of the lipoatrophic sites with some residual superficial skin wrinkling and laxity. The images illustrate the clinical presentation of lipoatrophy as a complication of subcutaneous insulin infusion and its response to corticosteroid treatment, emphasizing dermatological assessment in diabetic care.
"type 1 diabetes"[MeSH Terms] AND "symptoms"
Type 1 Diabetes - Symptoms
The Classic Triad
| Symptom | Mechanism |
|---|---|
| Polyuria (frequent, large-volume urination) | Glucose spills into urine, drawing water with it osmotically |
| Polydipsia (extreme thirst) | Fluid loss from polyuria triggers thirst |
| Polyphagia (excessive hunger) | Cells cannot take up glucose without insulin - the body perceives starvation |
Other Common Symptoms
- Rapid weight loss - both fat and lean muscle are broken down as the body burns alternative fuels; loss of extracellular fluid also contributes
- Fatigue and weakness - cells are starved of glucose despite high blood sugar
- Blurred vision - osmotic changes swell the lens of the eye
- Dry mouth and dry or itchy skin - from dehydration
- Poor wound healing and recurrent infections - hyperglycemia impairs immune function; genital candidiasis (yeast infections) is a classic early presentation, especially in women and toilet-trained children
- Secondary enuresis (bed-wetting in a previously dry child) - a well-known presentation in pediatric T1DM
- Vague abdominal discomfort - can precede or accompany DKA
Presentation with Diabetic Ketoacidosis (DKA)
- Nausea and vomiting
- Diffuse abdominal pain
- Deep, labored breathing (Kussmaul respirations) - the body exhales CO2 to compensate for metabolic acidosis
- Fruity or "nail polish" odor on the breath - from acetone produced as a ketone
- Altered consciousness - ranging from lethargy to coma in severe cases
- Tachycardia and hypotension - from severe dehydration
Key Physical and Demographic Features
- Patients are typically lean and young (diagnosis usually before age 40, often in childhood or adolescence)
- Plasma insulin and C-peptide levels are very low or undetectable
- Pancreatic autoantibodies (anti-GAD65, IAA, anti-IA-2, anti-ZnT8) are commonly present at diagnosis
- Unlike Type 2, symptoms do not develop gradually over years - the onset is usually rapid and symptomatic
Long-Term Complications (if uncontrolled)
- Cardiovascular disease (most common cause of death)
- Retinopathy - diabetic eye disease, leading cause of blindness
- Nephropathy - kidney damage
- Peripheral neuropathy - numbness, tingling, pain in feet/hands
- Foot ulcers and serious infections
- Necrobiosis lipoidica - a characteristic skin condition (waxy, yellowish-brown plaques with violaceous borders, typically on the shins)
When to Seek Emergency Care
What's the difference between Type 1 and Type 2 diabetes symptoms?
Type 1 vs. Type 2 Diabetes - Symptom Differences
Side-by-Side Comparison
| Feature | Type 1 | Type 2 |
|---|---|---|
| Onset of symptoms | Abrupt - days to weeks | Gradual - months to years |
| Typical age | Childhood / young adulthood | Over 40 (but rising in younger people) |
| Body habitus | Usually lean | Usually overweight/obese (but ~10% are not) |
| Classic triad (polyuria, polydipsia, polyphagia) | Present and pronounced | Present only with significant hyperglycemia (>180 mg/dL); often absent or mild |
| Weight loss | Rapid and prominent | May occur, but less dramatic |
| Fatigue | Yes | Yes (common but nonspecific) |
| Diagnosed how? | Usually symptomatic presentation | Often discovered on routine blood tests in an asymptomatic person |
| DKA risk | High - a common first presentation | Low (more likely to develop hyperosmolar hyperglycemic state) |
| Insulin levels | Very low or absent | Normal or high (but relatively insufficient) |
Type 1 - Key Symptom Features
- Polyuria, polydipsia, polyphagia appear rapidly and are severe
- Rapid weight loss - both fat and lean muscle break down as alternative fuel sources
- Paradox of polyphagia + weight loss - eating a lot yet losing weight is a strong red flag for diabetes
- Diabetic ketoacidosis (DKA) may be the first sign of the disease, with nausea, vomiting, abdominal pain, Kussmaul respirations (deep, labored breathing), fruity breath odor, and altered consciousness
- Secondary enuresis in children (bed-wetting after toilet training)
- Genital candidiasis (yeast infections) from sugar-rich urine
- Blurred vision from osmotic lens swelling
Type 2 - Key Symptom Features
- Most patients are asymptomatic for years - diagnosis is commonly made incidentally on blood work
- Classic symptoms of polyuria and polydipsia only appear when blood glucose exceeds the renal reabsorption threshold (~180 mg/dL)
- Thirst and frequent urination may develop so slowly the patient barely notices
- Fatigue is the most common presenting complaint
- Recurrent infections (urinary tract, skin, yeast) from chronic hyperglycemia
- Slow wound healing
- Blurred vision, dry skin, numbness/tingling in feet can all be early or late features
- Due to the insidious onset, many Type 2 patients are first diagnosed when long-term complications are already present - retinopathy, neuropathy, or nephropathy
Shared Symptoms (Both Types)
- Polyuria and polydipsia (when glucose exceeds the renal threshold)
- Fatigue
- Blurred vision
- Recurrent infections (skin, urinary, genital)
- Slow wound healing
- Dry mouth and dry skin
A Practical Rule of Thumb
- Sudden, dramatic symptoms in a young lean person → think Type 1
- Incidentally found high glucose in an older overweight person with no symptoms → think Type 2
- Any patient with polyphagia AND weight loss simultaneously → diabetes until proven otherwise
What tests confirm Type 1 vs Type 2 diabetes?
Tests That Confirm Diabetes - and Distinguish Type 1 from Type 2
Step 1 - Confirming the Diagnosis of Diabetes (Both Types)
| Test | Normal | Prediabetes | Diabetes |
|---|---|---|---|
| Fasting plasma glucose (FPG) | <100 mg/dL | 100-125 mg/dL | ≥126 mg/dL |
| 2-hour OGTT (75g oral glucose load) | <140 mg/dL | 140-199 mg/dL | ≥200 mg/dL |
| Random plasma glucose | - | - | ≥200 mg/dL + symptoms |
| HbA1c | <5.7% | 5.7-6.4% | ≥6.5% |
- Diagnosis requires 2 abnormal results (same day or two different days), OR
- A single random glucose ≥200 mg/dL with classic symptoms is sufficient on its own
- Point-of-care fingerstick glucometers and continuous glucose monitors cannot be used to diagnose diabetes - laboratory plasma glucose must confirm it
"The diagnosis of diabetes can be confirmed by the presence of two abnormal tests (fasting, 2-hour OGTT, or HbA1c) or by finding both unequivocal hyperglycemia (random plasma glucose >200 mg/dL) plus typical symptoms." - Goldman-Cecil Medicine
Step 2 - Distinguishing Type 1 from Type 2
C-Peptide (most practical differentiator)
- C-peptide is co-secreted with insulin by beta cells and reflects endogenous insulin production
- Type 1: Very low or undetectable C-peptide (beta cells destroyed)
- Type 2: Normal or elevated C-peptide (insulin is being made, but not working well)
- This is the most reliable single test to distinguish the two types
Pancreatic Autoantibodies (specific for Type 1)
| Antibody | Notes |
|---|---|
| Anti-GAD65 (glutamic acid decarboxylase) | Highest sensitivity (~91%) as a single marker; more common in adults |
| Anti-IA-2 / ICA512 (islet antigen-2) | Tyrosine phosphatase on beta cell granules |
| Anti-ZnT8 (zinc transporter 8) | On surface of beta cell secretory granules |
| IAA (insulin autoantibodies) | More common in young children with T1DM |
| ICA (islet cell antibodies) | Older test; now largely replaced by the above |
- Having ≥2 autoantibodies significantly raises the probability of T1DM
- Absence of antibodies does not exclude T1DM (some antibody-negative T1DM exists)
- These tests are not for routine screening of asymptomatic people - they are used when the type is genuinely uncertain
Fasting Insulin Level
- Type 1: Absent or very low
- Type 2: Normal to high (but lower than expected for the glucose level)
- Less commonly used than C-peptide as it can be exogenously administered
HbA1c (monitoring, not typing)
- Once diabetes is diagnosed, HbA1c is used every 3-6 months to monitor glucose control over the preceding ~3 months
- Caution: HbA1c is unreliable in hemolytic anemia, hemoglobinopathies (e.g. sickle cell), uremia, or after blood transfusions - use direct glucose measurements instead
- HbA1c also varies by race (higher in Black patients at the same glucose level), though diagnostic cutoffs remain the same
Urine/Blood Ketones
- Ketonemia/ketonuria is far more prominent in Type 1 (absolute insulin deficiency enables unchecked fat breakdown)
- Blood beta-hydroxybutyrate is the preferred test (more accurate than urine ketone strips, which miss beta-hydroxybutyrate)
Summary: Test Roles at a Glance
| Purpose | Test(s) to Use |
|---|---|
| Confirm any diabetes | FPG, HbA1c, OGTT, random glucose |
| Distinguish T1 from T2 | C-peptide, pancreatic autoantibodies, fasting insulin |
| Monitor glucose control over time | HbA1c (every 3-6 months) |
| Detect DKA (T1 emergency) | Blood beta-hydroxybutyrate, anion gap, blood gas |
| Prediabetes screening | FPG 100-125, HbA1c 5.7-6.4%, OGTT 140-199 |