
ARVD diagnostic criteria
"Arrhythmogenic Right Ventricular Dysplasia"[MeSH Terms] AND "diagnostic criteria"
ARVC 2010 Task Force criteria major minor; 2023 International expert consensus ARVC diagnostic criteria Padua criteria
https://pmc.ncbi.nlm.nih.gov/articles/PMC11440389
sed -n '617,640p' /textbooks/9780323930345/9780323930345_block6.md | sed 's/<\/tr>/\n/g; s/<[^>]*>/ | /g' | head -120
ARVC/ARVD diagnostic criteria
How the diagnosis is made
| Diagnosis | Requirement |
|---|---|
| Definite | 2 major, or 1 major + 2 minor, or 4 minor |
| Borderline | 1 major + 1 minor, or 3 minor |
| Possible | 1 major, or 2 minor |
The six categories
- Major
- Echo: regional RV akinesia, dyskinesia or aneurysm, plus one of:
- PLAX RVOT ≥32 mm (PLAX/BSA ≥19 mm/m²)
- PSAX RVOT ≥36 mm (PSAX/BSA ≥21 mm/m²)
- Fractional area change ≤33%
- MRI: regional RV akinesia, dyskinesia or dyssynchronous contraction, plus one of:
- RV end-diastolic volume/BSA ≥110 mL/m² (male) or ≥100 mL/m² (female)
- RVEF ≤40%
- RV angiography: regional akinesia, dyskinesia or aneurysm
- Echo: regional RV akinesia, dyskinesia or aneurysm, plus one of:
- Minor
- Echo: regional akinesia or dyskinesia, plus one of:
- PLAX RVOT 29 to <32 mm
- PSAX RVOT 32 to <36 mm
- FAC >33% to ≤40%
- MRI: regional akinesia, dyskinesia or dyssynchrony, plus one of:
- RV end-diastolic volume/BSA 100 to <110 mL/m² (male) or 90 to <100 mL/m² (female)
- RVEF >40% to ≤45%
- Echo: regional akinesia or dyskinesia, plus one of:
- Major: residual myocytes <60% by morphometry (or <50% if estimated), with fibrous replacement of the RV free wall in at least 1 sample, with or without fatty replacement.
- Minor: residual myocytes 60 to 75% (50 to 65% if estimated), with the same fibrous replacement.
- Major: inverted T waves in V1-V3 or beyond in people older than 14 years, without complete RBBB (QRS ≥120 ms).
- Minor:
- Inverted T waves in V1-V2 (no complete RBBB), or in V4-V6.
- Inverted T waves in V1-V4 when complete RBBB is present.
- Major: epsilon wave (low-amplitude signals between the end of the QRS and the onset of the T wave) in V1-V3.
- Minor: late potentials on signal-averaged ECG in at least 1 of 3 parameters, with QRS <110 ms:
- Filtered QRS ≥114 ms
- Terminal QRS under 40 µV lasting ≥38 ms
- Terminal 40 ms RMS voltage ≤20 µV
- Minor: terminal activation duration of QRS ≥55 ms in V1-V3, without complete RBBB.
- Major: sustained or non-sustained VT with LBBB morphology and superior axis.
- Minor:
- VT with LBBB morphology and inferior or unknown axis (RVOT-type).
- More than 500 PVCs per 24 hours.
- Major:
- ARVC confirmed in a first-degree relative by Task Force criteria.
- ARVC confirmed pathologically at autopsy or surgery in a first-degree relative.
- A pathogenic mutation in the patient.
- Minor:
- A first-degree relative with probable ARVC in whom Task Force criteria cannot be applied.
- Premature sudden death (<35 years) in a first-degree relative with suspected ARVC.
- ARVC confirmed pathologically or by Task Force criteria in a second-degree relative.
Practical points from the textbooks
- Work-up includes a 12-lead ECG, 24-hour and exercise ECG, and echocardiography with dedicated RV views. Cardiac MRI assesses RV volumes, function and fibrofatty tissue (Goldman-Cecil Medicine, p. 518).
- Typical arrhythmias are VT with LBBB morphology, which indicates an RV origin.
- Because the criteria miss early disease, modified, more sensitive criteria are used for first-degree relatives of known cases (Goldman-Cecil, Table 47-6).
- Imaging criteria are graded by severity into major and minor, and follow-up is important in doubtful cases (Grainger & Allison's Diagnostic Radiology).
Newer criteria (2020 Padua and 2023 European Task Force)
- The 2010 criteria do not capture left-sided or biventricular disease. The 2020 Padua criteria and the 2023 European Task Force criteria cover the broader entity, arrhythmogenic cardiomyopathy (ACM), including arrhythmogenic left ventricular cardiomyopathy (ALVC).
- They use six categories, with CMR late gadolinium enhancement (scar) now included.
- Any ACM diagnosis requires at least one morpho-functional or structural criterion, major or minor.
- The same counting rules apply: definite is 2 major, 1 major + 2 minor, or 4 minor. Borderline is 1 major + 1 minor, or 3 minor. Possible is 1 major or 2 minor (2023 criteria review).
- If only the RV is affected, the diagnosis is ARVC. If only the LV is affected, it is ALVC. If both are affected, it is biventricular ACM.
Make a presentation on ARVC diagnostic criteria
arrhythmogenic right ventricular cardiomyopathy epsilon wave ECG
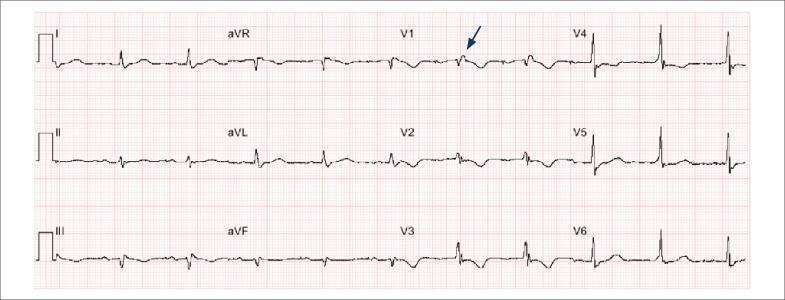
This diagnostic image is a 12-lead electrocardiogram (ECG) demonstrating key diagnostic features of Arrhythmogenic Right Ventricular Cardiomyopathy (ARVC). The tracing shows a normal sinus rhythm with low voltage in the frontal plane leads (I, II, III, aVR, aVL, aVF). A pathognomonic 'epsilon wave' is identified by a blue arrow in lead V1, appearing as a small, low-amplitude notch or positive deflection at the end of the QRS complex and the beginning of the ST segment. Significant repolarization abnormalities are present, specifically deep T-wave inversions across the right precordial leads (V1, V2, and V3). These findings, particularly the combination of terminal notch depolarization (epsilon wave) and precordial T-wave inversion, serve as major diagnostic criteria for ARVC. The educational focus of the image is to illustrate ECG manifestations of right ventricular disease and structural heart conditions associated with sudden cardiac arrest.
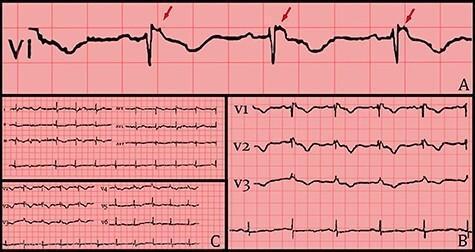
This diagnostic image contains three panels of electrocardiogram (ECG) tracings illustrating the electrical manifestations of Arrhythmogenic Right Ventricular Cardiomyopathy (ARVC). Panel A provides a high-magnification view of lead V1, where red arrows indicate the hallmark Epsilon wave—a low-amplitude notch or 'blip' occurring at the end of the QRS complex and the start of the ST segment. Panel B displays precordial leads V1 through V3, demonstrating a right bundle branch block (RBBB) morphology characterized by widened QRS complexes and persistent T-wave inversions. Panel C presents a standard 12-lead ECG overview following hemodynamic stabilization. The collection emphasizes key diagnostic criteria including repolarization abnormalities (T-wave inversion in V1-V3) and depolarization abnormalities (Epsilon waves). These visual findings are critical for medical students and clinicians in identifying structural right ventricular disease and assessing sudden cardiac death risk.
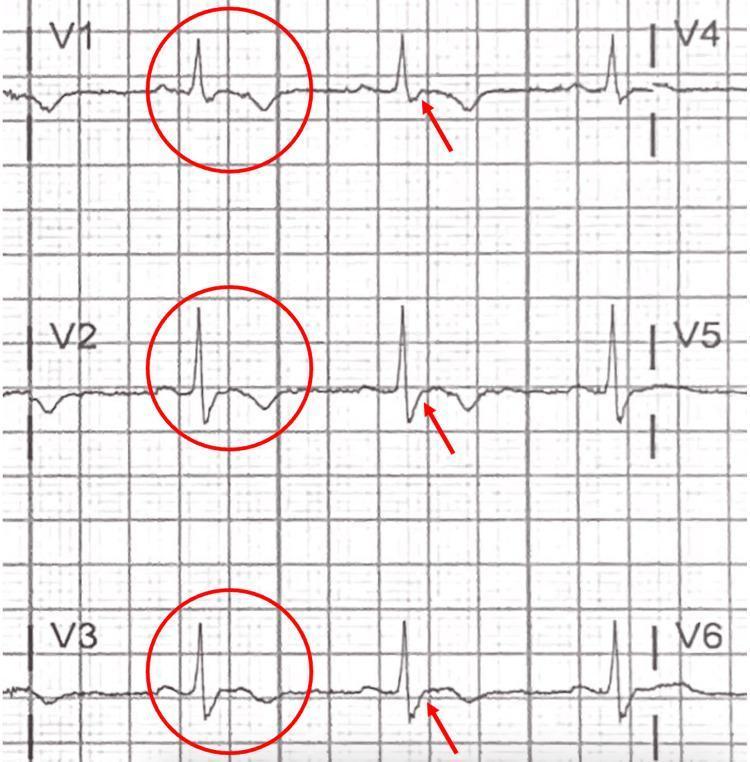
This diagnostic image displays a focused 12-lead electrocardiogram (ECG) tracing specifically highlighting the precordial leads V1 through V6. The visual focuses on the right precordial leads (V1, V2, and V3), which are marked with red circles and arrows to indicate diagnostic abnormalities. Key morphological features include prominent T-wave inversions in leads V1-V3, while the lateral leads V4-V6 show upright T-waves. A critical finding is the presence of an 'epsilon wave,' identified as a small positive deflection or notch at the terminal end of the QRS complex, occurring between the end of the S-wave and the start of the T-wave. These electrocardiographic signs—T-wave inversion in right precordial leads beyond V1 and the presence of epsilon waves—are highly characteristic of Arrhythmogenic Right Ventricular Cardiomyopathy (ARVC). This image serves as a clinical teaching tool for identifying subtle depolarization and repolarization abnormalities associated with fibrofatty replacement of the right ventricular myocardium.
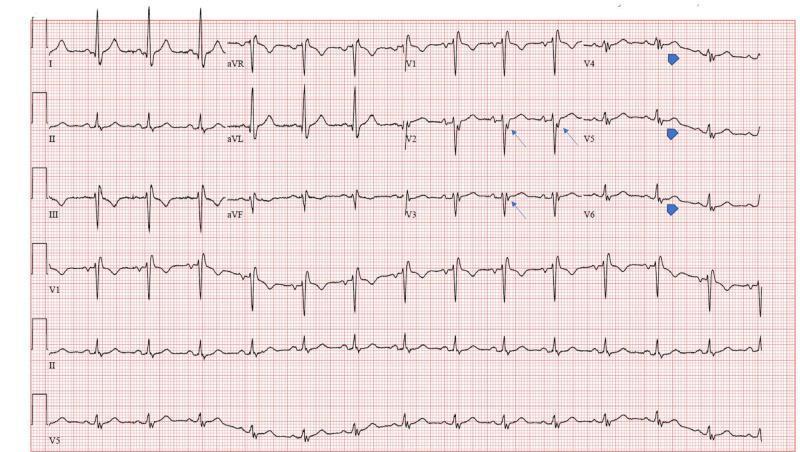
A 12-lead electrocardiogram (ECG) displayed on standard grid paper, demonstrating a regular rhythm with a heart rate of approximately 100 beats per minute, consistent with sinus tachycardia. The primary diagnostic feature is the presence of Epsilon waves, which are low-amplitude positive deflections occurring at the end of the QRS complex and the start of the ST segment. Blue arrows highlight these Epsilon waves in the precordial leads V2 and V3, while blue arrowheads indicate similar post-excitation signals in leads V4 through V6. Other notable findings include a non-specific intraventricular conduction delay and T-wave inversions in the right precordial leads (V1-V3). These visual signs are classical hallmarks of arrhythmogenic right ventricular cardiomyopathy (ARVC) but can also be seen in other conditions causing right ventricular structural abnormalities. This ECG is a critical educational resource for cardiology students and clinicians to recognize subtle terminal QRS abnormalities linked to right ventricular pathology.
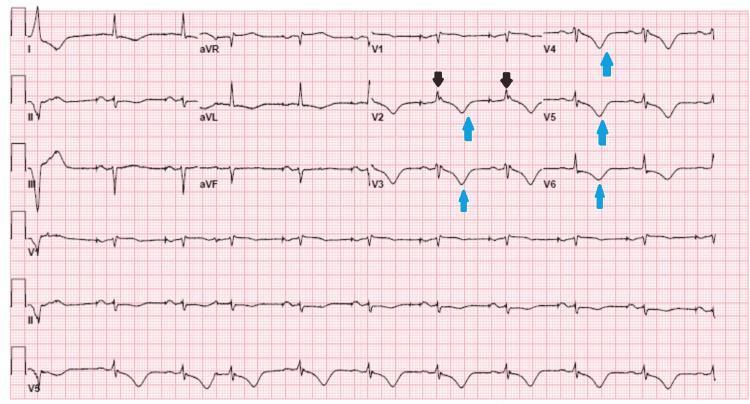
This diagnostic image is a 12-lead electrocardiogram (ECG) demonstrating pathognomonic findings of Arrhythmogenic Right Ventricular Dysplasia/Cardiomyopathy (ARVD/C). The tracing shows a sinus rhythm with two distinctive abnormal features highlighted by colored markers. Black arrows in lead V2 point to 'epsilon waves,' which are low-amplitude positive deflections occurring at the end of the QRS complex (terminal notch), representing delayed right ventricular activation. Blue arrows highlight widespread T-wave inversions (TWI) extending from the right to the lateral precordial leads (V2 through V6). These repolarization abnormalities are a major diagnostic criterion for ARVD. The ECG provides critical educational value in identifying high-risk cardiac markers for sudden cardiac death (SCD) and illustrating the electrical manifestations of fibrofatty replacement of the myocardium. Target audience: medical students and cardiology residents.
arrhythmogenic right ventricular cardiomyopathy MRI fatty infiltration
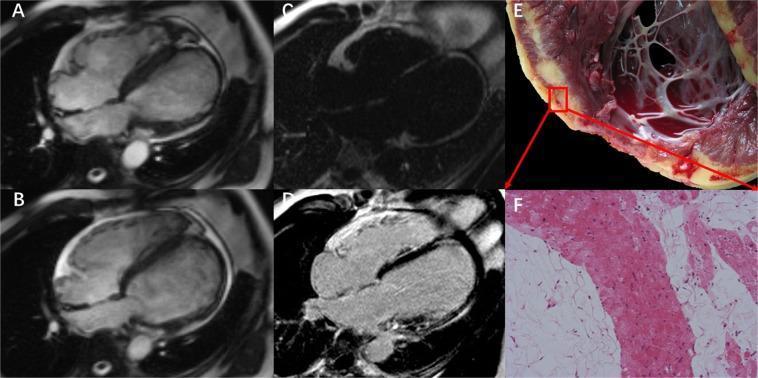
This composite figure illustrates a case of Arrhythmogenic Left Ventricular Cardiomyopathy (ALVC) with biventricular involvement using multimodal imaging and pathology. (A) and (B) are cardiac MRI 4-chamber steady-state free precession (SSFP) cine images in diastole and systole, demonstrating significant left ventricular (LV) dilation and mild-to-moderate right ventricular (RV) dilation. Notably, the LV apex shows marked wall thinning and an aneurysmal contour. (C) A fat-only image from water-fat separation MRI sequence confirms intramyocardial fat infiltration within the LV walls. (D) Late Gadolinium Enhancement (LGE) imaging reveals extensive hyperenhancement (fibrosis) in the LV basal-to-mid lateral wall, the interventricular septum, and the apex. (E) Macroscopic gross pathology of the explanted heart shows a dilated chamber with distinct yellow fatty infiltration and pale fibrotic areas replacing the myocardium. (F) H&E stained histopathology confirms the diagnosis, showing extensive fibro-fatty replacement of cardiac myocytes. The case highlights the educational findings of LV-dominant arrhythmogenic cardiomyopathy, characterized by structural remodeling and tissue characterization evidence of myocardial replacement.
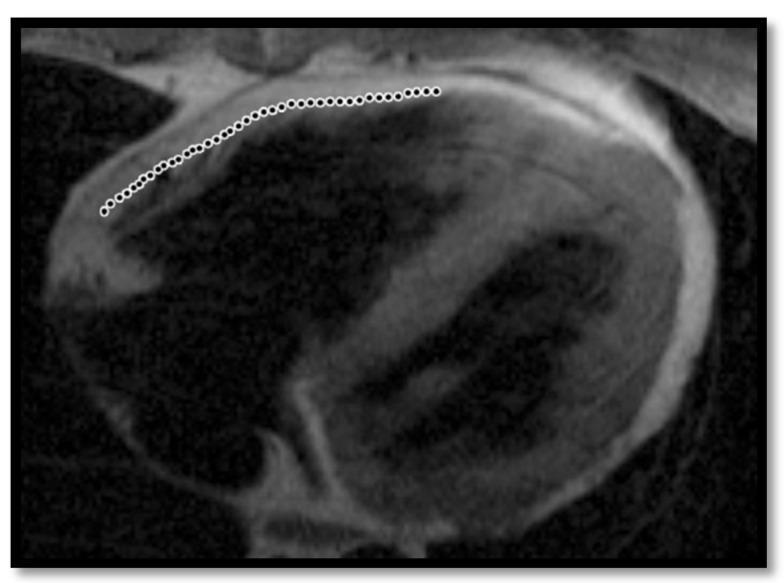
This diagnostic image is a T1-weighted cardiac MRI (axial view) illustrating the right and left ventricles. The primary educational focus is the visual demonstration of fatty infiltration within the right ventricular (RV) free wall, a finding often associated with Arrhythmogenic Right Ventricular Cardiomyopathy (ARVC). Within the RV free wall, there is a prominent area of high signal intensity (hyperintense/bright), which corresponds to adipose tissue replacing the normal darker myocardium. A dotted white line highlights the subepicardial region where the infiltration is most concentrated. Despite the presence of fat, the myocardium retains a relatively preserved thickness. The boundary between the epicardium and the myocardium is obscured in the affected areas due to the high-intensity signal merging with the epicardial fat. This image serves as a clinical example of myocardial structural remodeling and tissue characterization in the diagnostic evaluation of cardiomyopathies.
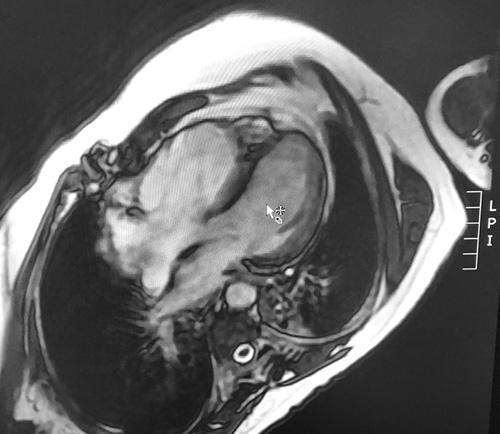
This diagnostic image is a T1-weighted cardiac Magnetic Resonance Imaging (MRI) scan in a four-chamber horizontal long-axis view. The image demonstrates characteristic findings associated with Arrhythmogenic Right Ventricular Cardiomyopathy (ARVC). Visible pathology includes significant dilation of the right ventricle (RV) compared to the left ventricle (LV). A hallmark finding is the presence of high-intensity signal hyperintensities within the myocardium, specifically localized to the apical free wall and the apical interventricular septum, which is highly suggestive of intramyocardial fatty infiltration (fibrofatty replacement). The RV free wall appears thinned and irregular. These visual markers are critical for the diagnostic evaluation of structural heart disease, particularly in patients presenting with ventricular arrhythmias or symptoms of right-sided heart failure. This educational visual serves as a classic example of using T1-weighted sequences to detect abnormal tissue composition in the myocardium.
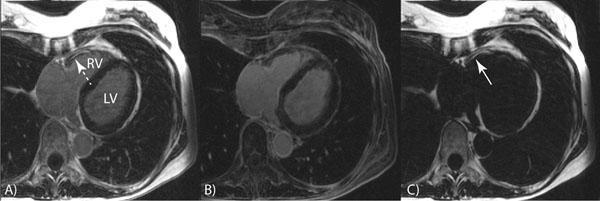
This Comparison Chart displays three axial cardiac Magnetic Resonance Imaging (MRI) panels used for water-fat separation in a patient with suspected Arrhythmogenic Right Ventricular Cardiomyopathy (ARVC). Panel A shows the 'first echo' image, providing a baseline view of the left ventricle (LV) and right ventricle (RV). Panel B is the 'water image,' highlighting the myocardial tissue and blood pool while suppressing fat signals. Panel C is the 'fat image,' which specifically isolates fatty tissue. An arrow in Panel C points to a region of hyperintensity (bright signal) localized in the RV free wall, indicating significant fatty infiltration. This diagnostic sequence demonstrates the utility of water-selective inversion recovery (IR) techniques for characterizing myocardial tissue composition. The educational focus is on the detection of intramyocardial fat, a hallmark finding in ARVC, and the technical application of Dixon-based or water-fat separation imaging to distinguish between normal cardiac anatomy and pathology.
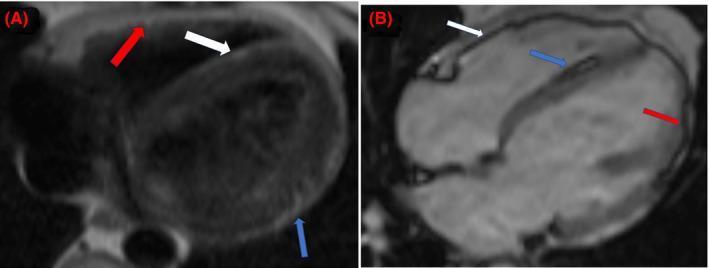
This diagnostic image consists of two panels showcasing cardiac Magnetic Resonance Imaging (MRI) sequences used to identify intramyocardial lipomatous replacement. Panel A displays a pre-contrast axial Half-Fourier Single-shot Turbo Spin-Echo (HASTE) sequence. It reveals linear hyperintensities (increased signal) along the right ventricular (RV) free wall (red arrow), the right ventricular side of the interventricular septum (white arrow), and the lateral left ventricular (LV) epicardium (blue arrow). Panel B provides a four-chamber balanced Steady-State Free Precession (bSSFP) scout image demonstrating characteristic black-line chemical shift artifacts in the corresponding anatomical regions: the RV free wall (white arrow), the interventricular septum (blue arrow), and the lateral LV epicardium (red arrow). These findings are highly suggestive of fat infiltration within the myocardium, often associated with conditions like arrhythmogenic cardiomyopathy. The comparison between the hyperintensity on HASTE and the chemical shift artifact on bSSFP is a key educational feature for identifying fatty replacement in cardiac tissue.
sed -n 1,400p /tmp/skills/pptx/python-pptx.md; ls -la /tmp/workspace/
mkdir -p /tmp/workspace/arvc-ppt/assets /tmp/workspace/arvc-ppt/output && cd /tmp/workspace/arvc-ppt && python /tmp/skills/shared/scripts/fetch_images.py "https://cdn.orris.care/cdss_images/pmc_clinical_VQA_330758af9dbf99f014efe99288408e401039e8a6d16bd59683cdf1cd20942740.jpg" "https://cdn.orris.care/cdss_images/pmc_clinical_VQA_5a247185d128adda808a794f5b6e539bbd6b670edd2b8b3cfe4b7f9ddf7b9849.jpg" > assets/imgs.json && python - <<'E' import json,base64 from PIL import Image from io import BytesIO d=json.load(open('assets/imgs.json')) for i,x in enumerate(d): print(x['error']) raw=base64.b64decode(x['base64'].split(',',1)[1]); open(f'assets/img{i}.jpg','wb').write(raw) print(Image.open(BytesIO(raw)).size) E
cd /tmp/workspace/arvc-ppt && cat > build.py <<'E' from pptx import Presentation from pptx.util import Inches, Pt from pptx.dml.color import RGBColor from pptx.enum.text import PP_ALIGN, MSO_ANCHOR from pptx.enum.shapes import MSO_SHAPE from PIL import Image NAVY=RGBColor(0x0B,0x1F,0x3A); RED=RGBColor(0xB3,0x20,0x2F); BG=RGBColor(0xF6,0xF4,0xF1) GRAY=RGBColor(0x5B,0x65,0x73); WHITE=RGBColor(255,255,255); INK=RGBColor(0x22,0x2B,0x38) TEAL=RGBColor(0x1F,0x6F,0x78); LIGHT=RGBColor(0xE6,0xEA,0xEF); PALE_RED=RGBColor(0xF8,0xE3,0xE5) FONT="Calibri" prs=Presentation(); prs.slide_width=Inches(13.333); prs.slide_height=Inches(7.5) blank=prs.slide_layouts[6]; N=[0] def rect(s,x,y,w,h,fill,shape=MSO_SHAPE.RECTANGLE): r=s.shapes.add_shape(shape,Inches(x),Inches(y),Inches(w),Inches(h)) r.fill.solid(); r.fill.fore_color.rgb=fill; r.line.fill.background(); r.shadow.inherit=False; return r def text(s,x,y,w,h,t,size=16,bold=False,color=INK,align=PP_ALIGN.LEFT,anchor=MSO_ANCHOR.TOP,italic=False): tb=s.shapes.add_textbox(Inches(x),Inches(y),Inches(w),Inches(h)); tf=tb.text_frame; tf.word_wrap=True tf.margin_left=tf.margin_right=Inches(0.05); tf.margin_top=tf.margin_bottom=Inches(0.03); tf.vertical_anchor=anchor lines=t if isinstance(t,list) else [t] for i,l in enumerate(lines): p=tf.paragraphs[0] if i==0 else tf.add_paragraph(); p.alignment=align r=p.add_run(); r.text=l; f=r.font; f.name=FONT; f.size=Pt(size); f.bold=bold; f.italic=italic; f.color.rgb=color if i>0: p.space_before=Pt(6) return tb def bullets(s,x,y,w,h,items,size=16,color=INK,gap=8): tb=s.shapes.add_textbox(Inches(x),Inches(y),Inches(w),Inches(h)); tf=tb.text_frame; tf.word_wrap=True for i,it in enumerate(items): p=tf.paragraphs[0] if i==0 else tf.add_paragraph() p.space_after=Pt(gap) pPr=p._p.get_or_add_pPr(); pPr.set('marL','285750'); pPr.set('indent','-285750') from lxml import etree ns='http://schemas.openxmlformats.org/drawingml/2006/main' bc=etree.SubElement(pPr,'{%s}buClr'%ns); c=etree.SubElement(bc,'{%s}srgbClr'%ns); c.set('val','B3202F') bu=etree.SubElement(pPr,'{%s}buChar'%ns); bu.set('char','\u25A0') if isinstance(it,tuple): r=p.add_run(); r.text=it[0]; r.font.bold=True; r.font.size=Pt(size); r.font.name=FONT; r.font.color.rgb=NAVY r=p.add_run(); r.text=it[1]; r.font.size=Pt(size); r.font.name=FONT; r.font.color.rgb=color else: r=p.add_run(); r.text=it; r.font.size=Pt(size); r.font.name=FONT; r.font.color.rgb=color return tb def new(title,sub=None): s=prs.slides.add_slide(blank); N[0]+=1 s.background.fill.solid(); s.background.fill.fore_color.rgb=BG rect(s,0,0,0.18,7.5,RED) text(s,0.6,0.35,12,0.8,title,30,True,NAVY) if sub: text(s,0.6,1.05,12,0.4,sub,15,False,GRAY) text(s,0.6,7.05,8,0.3,"ARVC diagnostic criteria",10,False,GRAY) text(s,12.0,7.05,0.8,0.3,str(N[0]),10,False,GRAY,PP_ALIGN.RIGHT) return s def table(s,x,y,w,colw,rows,hdr_fill=NAVY,size=12.5,rowh=None): nr=len(rows); nc=len(rows[0]) gs=s.shapes.add_table(nr,nc,Inches(x),Inches(y),Inches(w),Inches(0.4*nr)); t=gs.table tblPr=gs._element.graphic.graphicData.tbl.tblPr # remove style banding tblPr.set('bandRow','0'); tblPr.set('firstRow','0') for i,cw in enumerate(colw): t.columns[i].width=Inches(cw) for r in range(nr): if rowh: t.rows[r].height=Inches(rowh[r]) for c in range(nc): cell=t.cell(r,c); val=rows[r][c] cell.margin_left=cell.margin_right=Inches(0.1); cell.margin_top=cell.margin_bottom=Inches(0.05) cell.vertical_anchor=MSO_ANCHOR.MIDDLE tf=cell.text_frame; tf.word_wrap=True lines=val if isinstance(val,list) else [val] for k,l in enumerate(lines): p=tf.paragraphs[0] if k==0 else tf.add_paragraph() if k>0: p.space_before=Pt(3) rr=p.add_run(); rr.text=l; rr.font.name=FONT; rr.font.size=Pt(size) if r==0: rr.font.bold=True; rr.font.color.rgb=WHITE; rr.font.size=Pt(14) elif c==0: rr.font.bold=True; rr.font.color.rgb=NAVY else: rr.font.color.rgb=INK cell.fill.solid() if r==0: cell.fill.fore_color.rgb = (RED if c==1 else (TEAL if c==2 else hdr_fill)) elif c==0: cell.fill.fore_color.rgb=LIGHT else: cell.fill.fore_color.rgb = WHITE return t # 1 Title s=prs.slides.add_slide(blank); N[0]+=1 s.background.fill.solid(); s.background.fill.fore_color.rgb=NAVY rect(s,0.8,2.3,0.12,2.3,RED) text(s,1.2,2.2,11,1.4,"Diagnostic Criteria for Arrhythmogenic Right Ventricular Cardiomyopathy",40,True,WHITE) text(s,1.2,3.95,11,0.6,"2010 revised Task Force Criteria, with the Padua (2020) and European (2023) updates",20,False,RGBColor(0xC9,0xD3,0xE0)) text(s,1.2,6.5,11,0.4,"ARVC / ARVD | Cardiology teaching deck",14,False,RGBColor(0x9A,0xA8,0xBA)) # 2 Overview s=new("Why we need criteria","No single test diagnoses ARVC") bullets(s,0.6,1.7,6.3,5,[ ("Disease: ","fibrofatty replacement of RV myocardium, causing ventricular arrhythmia, RV dysfunction and sudden cardiac death."), ("Overlap: ","ECG and arrhythmia findings are not specific and overlap with RVOT VT, sarcoidosis and dilated cardiomyopathy."), ("Solution: ","a scored system of major and minor criteria across six categories."), ("Limitation: ","highly specific but insensitive for early disease, so relatives are assessed with modified criteria."), ],17) # timeline text(s,7.4,1.6,5.4,0.4,"Evolution of the criteria",16,True,NAVY) items=[("1994","Original Task Force criteria"),("2010","Revised criteria: quantitative imaging cut-offs, genetics, borderline and possible categories"),("2020","Padua criteria: right, left and biventricular disease"),("2023","European Task Force criteria for arrhythmogenic cardiomyopathy (ACM)")] y=2.15 rect(s,7.78,2.3,0.04,3.9,RED) for yr,d in items: c=rect(s,7.6,y+0.05,0.4,0.4,RED,MSO_SHAPE.OVAL) text(s,8.15,y-0.02,1.0,0.5,yr,20,True,RED) text(s,9.2,y,3.7,0.95,d,14,False,INK) y+=1.15 # 3 Algorithm s=new("How the diagnosis is made","Count criteria from different categories") text(s,0.6,1.6,12,0.4,"Six categories",16,True,NAVY) cats=["I Structure and function","II Tissue characterization","III Repolarization (ECG)","IV Depolarization (ECG)","V Arrhythmias","VI Family history / genetics"] for i,cname in enumerate(cats): x=0.6+i*2.05 b=rect(s,x,2.05,1.95,0.95,WHITE,MSO_SHAPE.ROUNDED_RECTANGLE); b.line.color.rgb=NAVY; b.line.width=Pt(1.25) text(s,x+0.05,2.05,1.85,0.95,cname,13,True,NAVY,PP_ALIGN.CENTER,MSO_ANCHOR.MIDDLE) cards=[("DEFINITE",RED,["2 major","or 1 major + 2 minor","or 4 minor"]), ("BORDERLINE",TEAL,["1 major + 1 minor","or 3 minor"]), ("POSSIBLE",GRAY,["1 major","or 2 minor"])] for i,(h,col,ls) in enumerate(cards): x=0.6+i*4.15 rect(s,x,3.45,3.9,0.65,col) text(s,x,3.45,3.9,0.65,h,20,True,WHITE,PP_ALIGN.CENTER,MSO_ANCHOR.MIDDLE) rect(s,x,4.1,3.9,1.75,WHITE) text(s,x+0.1,4.2,3.7,1.6,ls,19,False,INK,PP_ALIGN.CENTER,MSO_ANCHOR.MIDDLE) text(s,0.6,6.1,12.2,0.8,"Alternative points score used by some sources (ACC): major = 2, minor = 1. Definite = 4 points or more, borderline = 3 points.",14,False,GRAY,italic=True) # 4 Cat I s=new("Category I: global or regional dysfunction and structural alteration","Regional RV akinesia, dyskinesia or aneurysm, plus a size or function threshold") rows=[["Modality","Major","Minor"], ["2D echo",["Regional RV akinesia, dyskinesia or aneurysm, plus one of:","PLAX RVOT \u226532 mm (PLAX/BSA \u226519 mm/m\u00b2)","PSAX RVOT \u226536 mm (PSAX/BSA \u226521 mm/m\u00b2)","Fractional area change \u226433%"], ["Regional RV akinesia or dyskinesia, plus one of:","PLAX RVOT 29 to <32 mm (16 to <19 mm/m\u00b2)","PSAX RVOT 32 to <36 mm (18 to <21 mm/m\u00b2)","Fractional area change >33% to \u226440%"]], ["MRI",["Regional RV akinesia, dyskinesia or dyssynchronous contraction, plus one of:","RV EDV/BSA \u2265110 mL/m\u00b2 (male) or \u2265100 mL/m\u00b2 (female)","RVEF \u226440%"], ["Same wall motion finding, plus one of:","RV EDV/BSA 100 to <110 (male) or 90 to <100 (female) mL/m\u00b2","RVEF >40% to \u226445%"]], ["RV angiography","Regional RV akinesia, dyskinesia or aneurysm","None"]] table(s,0.6,1.65,12.1,[1.7,5.5,4.9],rows,size=12.5,rowh=[0.45,1.75,1.55,0.7]) # 5 II-IV s=new("Categories II to IV: tissue, repolarization, depolarization") rows=[["Category","Major","Minor"], ["II Tissue characterization (biopsy)","Residual myocytes <60% by morphometry (<50% if estimated), with fibrous replacement of RV free wall in \u22651 sample, \u00b1 fatty replacement","Residual myocytes 60 to 75% (50 to 65% if estimated), with fibrous replacement in \u22651 sample"], ["III Repolarization","Inverted T waves in V1 to V3 or beyond, age >14 years, no complete RBBB (QRS \u2265120 ms)",["Inverted T waves in V1 to V2 (no complete RBBB), or V4 to V6","Inverted T waves in V1 to V4 with complete RBBB"]], ["IV Depolarization / conduction","Epsilon wave (low-amplitude signals between end of QRS and onset of T wave) in V1 to V3",["Late potentials on signal-averaged ECG in \u22651 of 3 parameters (QRS <110 ms):","Filtered QRS \u2265114 ms; terminal QRS <40 \u00b5V \u226538 ms; RMS of last 40 ms \u226420 \u00b5V","Terminal activation duration \u226555 ms in V1 to V3, no complete RBBB"]]] table(s,0.6,1.5,12.1,[2.5,4.8,4.8],rows,size=12.5,rowh=[0.45,1.3,1.35,1.9]) # 6 V-VI s=new("Categories V and VI: arrhythmia and family history") rows=[["Category","Major","Minor"], ["V Arrhythmias","Sustained or non-sustained VT with LBBB morphology and superior axis",["VT with LBBB morphology and inferior or unknown axis (RVOT-type)",">500 PVCs per 24 hours"]], ["VI Family history and genetics",["ARVC confirmed in a first-degree relative by Task Force criteria","ARVC confirmed pathologically at autopsy or surgery in a first-degree relative","Pathogenic mutation identified in the patient"], ["First-degree relative with probable ARVC, criteria cannot be applied","Premature sudden death (<35 years) in a first-degree relative with suspected ARVC","ARVC confirmed in a second-degree relative"]]] table(s,0.6,1.5,12.1,[2.5,4.8,4.8],rows,size=13.5,rowh=[0.45,1.5,2.4]) text(s,0.6,6.2,12.1,0.7,"Tip: LBBB-morphology VT points to an RV origin. Superior axis suggests an inferior wall focus and counts as major.",14,False,GRAY,italic=True) # 7 ECG image s=new("ECG findings: epsilon wave and T wave inversion","Categories III and IV on one tracing") im=Image.open('assets/img0.jpg'); w,h=im.size; W=8.0; H=W*h/w s.shapes.add_picture('assets/img0.jpg',Inches(0.6),Inches(1.9),width=Inches(W)) text(s,0.6,1.9+H+0.1,8,0.5,"12-lead ECG: epsilon wave in V1 (arrow) with deep T wave inversion in V1 to V3.",12,False,GRAY,italic=True) bullets(s,9.0,1.9,3.9,4.8,[ ("Epsilon wave: ","major depolarization criterion (V1 to V3)."), ("T wave inversion V1 to V3: ","major, if age >14 and no complete RBBB."), ("Up to 90% ","of patients have a repolarization or depolarization abnormality (ACC)."), ("Exclude ","athlete variants: T wave inversion preceded by J-point elevation can be benign."), ],15) # 8 MRI image s=new("Imaging: cardiac MRI","Category I (wall motion, volumes, EF) and structural myocardial changes") im=Image.open('assets/img1.jpg'); w,h=im.size; H=4.6; W=H*w/h s.shapes.add_picture('assets/img1.jpg',Inches(0.6),Inches(1.8),height=Inches(H)) text(s,0.6,1.8+H+0.1,W,0.6,"T1-weighted four-chamber MRI: dilated RV with thinned, irregular free wall and high-signal fat.",12,False,GRAY,italic=True) bullets(s,0.6+W+0.5,1.8,12.7-(0.6+W+0.5),4.8,[ ("MRI criteria: ","regional akinesia, dyskinesia or dyssynchrony plus RV EDV/BSA or RVEF threshold."), ("Echo first: ","use dedicated RV views; contrast helps endocardial definition."), ("Fat and fibrosis: ","MRI shows them, but fat alone is not a Task Force criterion. Biopsy is the formal tissue criterion."), ("Prognosis: ","tissue characterization also informs risk (Goldman-Cecil)."), ],15) # 9 Newer criteria s=new("Newer criteria: arrhythmogenic cardiomyopathy (ACM)","Padua 2020 and European Task Force 2023") lw=5.9 rect(s,0.6,1.7,lw,4.9,WHITE) text(s,0.8,1.8,lw-0.4,0.4,"What changed",18,True,RED) bullets(s,0.8,2.3,lw-0.4,4.2,[ "Covers left-sided and biventricular disease, not only ARVC.", "Cardiac MRI late gadolinium enhancement (scar) is now a criterion.", "Same six categories and the same counting rules.", "At least one morpho-functional or structural criterion is required.", ],15) rect(s,0.6+lw+0.3,1.7,lw,4.9,WHITE) text(s,0.6+lw+0.5,1.8,lw-0.4,0.4,"Phenotype labels",18,True,RED) for i,(a,b) in enumerate([("ARVC","Only RV morpho-functional or structural criteria met"),("ALVC","Only LV criteria met"),("Biventricular ACM","Both ventricles involved")]): y=2.4+i*1.35 r=rect(s,0.6+lw+0.5,y,1.9,1.1,NAVY,MSO_SHAPE.ROUNDED_RECTANGLE) text(s,0.6+lw+0.5,y,1.9,1.1,a,15,True,WHITE,PP_ALIGN.CENTER,MSO_ANCHOR.MIDDLE) text(s,0.6+lw+2.55,y,lw-2.9,1.1,b,14,False,INK,PP_ALIGN.LEFT,MSO_ANCHOR.MIDDLE) # 10 Take-home s=new("Practical points and take-home messages") pts=[("1","Definite = 2 major, 1 major + 2 minor, or 4 minor, from different categories."), ("2","Work-up: 12-lead and exercise ECG, Holter, echo with RV views, cardiac MRI."), ("3","Criteria are specific but miss early disease; use modified criteria in first-degree relatives."), ("4","A pathogenic mutation is a major criterion; offer cascade family screening."), ("5","For left-sided or biventricular disease, apply Padua or 2023 ACM criteria.")] for i,(n,t) in enumerate(pts): y=1.5+i*1.0 rect(s,0.6,y,0.7,0.8,RED); text(s,0.6,y,0.7,0.8,n,26,True,WHITE,PP_ALIGN.CENTER,MSO_ANCHOR.MIDDLE) rect(s,1.3,y,11.4,0.8,WHITE); text(s,1.5,y,11.1,0.8,t,17,False,INK,PP_ALIGN.LEFT,MSO_ANCHOR.MIDDLE) # 11 Sources s=new("Sources") bullets(s,0.6,1.5,12,5,[ "Goldman-Cecil Medicine, International Edition: Table 47-5, Revised Task Force Criteria for ARVC in probands, p. 518.", "Grainger & Allison's Diagnostic Radiology: Arrhythmogenic Right Ventricular Cardiomyopathy.", "Marcus FI et al. Diagnosis of ARVD/C: proposed modification of the Task Force Criteria. Circulation 2010 (thresholds recalled from the original paper; verify before clinical use).", "2023 European Task Force Criteria for Diagnosis of Arrhythmogenic Cardiomyopathy (PMC11440389).", "American College of Cardiology, Understanding Arrhythmogenic RV Cardiomyopathy: Key Points (2023).", "Graziano F et al. The 2020 Padua Criteria. J Clin Med 2022.", "Images: Orris medical image library (PMC clinical figures).", ],14) prs.save('output/ARVC_Diagnostic_Criteria.pptx') E python build.py && ls -la output
cd /tmp/workspace/arvc-ppt && sed -i 's/H=4.6; W=H\*w\/h/H=4.2; W=H*w\/h/' build.py && python build.py && python - <<'E' from pptx import Presentation p=Presentation('output/ARVC_Diagnostic_Criteria.pptx') for i,s in enumerate(p.slides,1): for sh in s.shapes: if sh.left+sh.width>p.slide_width+10 or sh.top+sh.height>p.slide_height+10: print('overflow',i,sh.shape_type,sh.top/914400,sh.height/914400) print(len(p.slides.__iter__.__self__._sldIdLst),'slides') E
ARVC Diagnostic Criteria
Presentation · PPTX
- Title
- Why criteria are needed, with a timeline from the 1994 criteria to the 2023 European criteria
- How the diagnosis is made: the six categories, and the counts for definite, borderline and possible
- Category I: structure and function (echo, MRI, RV angiography), with the major and minor thresholds
- Categories II to IV: biopsy, T wave inversion, epsilon wave and late potentials
- Categories V and VI: arrhythmias, family history and genetics
- ECG showing an epsilon wave and T wave inversion in V1 to V3
- Cardiac MRI showing a dilated RV with fat signal in the thinned free wall
- Newer Padua (2020) and European Task Force (2023) criteria for arrhythmogenic cardiomyopathy
- Practical points and take-home messages
- Sources