
eeg basics and changes during anaesthesia detailed from standard anaesthesia textbooks and sources
Reading File
Now let me run parallel searches across the medical library database and web for comprehensive coverage.
Finding Sources
Finding Sources
Searching the Web
EEG basics changes during anaesthesia monitoring Miller anesthesia textbook
Let me try broader search terms in the library database:
Finding Sources
Finding Sources
Finding Sources
Reading Web Page
https://www.openanesthesia.org/keywords/eeg-monitoring-and-a…
Found Miller's Anesthesia block. Now let me read it and search for more specific content:
Finding Sources
Reading File
Excellent content found in Miller's Anesthesia. Let me read the earlier sections of this block (the EEG basics), and also read the neurology/neuroscience textbook EEG sections simultaneously:
Reading File
Reading File
Reading File
Excellent content. Let me now read the key EEG anesthesia sections from Miller's block 14 (which has the main EEG chapter) and block 15 (continued), and also get the Neuroscience textbook EEG rhythms section:
Reading File
Reading File
Reading File
Now let me read the key Miller's block 14 EEG section (the nomenclature/basics section) and the block 15 sections on induction/emergence and specific agents:
Reading File
Reading File
Now let me read the Miller's block 14 section on EEG nomenclature/basics and the block 15 induction/emergence sections:
Reading File
Reading File
I now have very rich content from Miller's Anesthesia (both block 14 and 15) along with supporting material from Adams & Victor's Neurology and Neuroscience: Exploring the Brain. Let me read the Miller's block 14 section on EEG changes with anesthesia (the nomenclature section and induction section):
Reading File
Reading File
I now have very comprehensive content from Miller's Anesthesia chapters 35 and 36. Let me also fetch a couple of the key EEG diagrams for visual reference, and get the Adams & Victor section on normal EEG patterns:
Loading Image
Reading File
Reading File
I now have a comprehensive, rich set of textbook content from Miller's Anesthesia (Chapters 35 & 36), Adams & Victor's Principles of Neurology, and Neuroscience: Exploring the Brain. Let me now compile the full detailed answer.
EEG Basics and Changes During Anaesthesia
Sources: Miller's Anesthesia 10th ed. (Chapters 35 & 36), Adams and Victor's Principles of Neurology 12th ed., Neuroscience: Exploring the Brain 5th ed.
1. What the EEG Measures
The electroencephalogram (EEG) is a surface recording of the summation of excitatory and inhibitory postsynaptic potentials spontaneously generated by pyramidal cells in the cerebral cortex. The signal reflects extracellular currents produced by transmembrane ion flows and is heavily modulated by subcortical structures - especially the thalamus and the brainstem reticular activating system, which entrain the cortex into characteristic rhythmic patterns such as alpha rhythm and sleep spindles. The EEG therefore serves as an indirect marker of deeper subcortical activity as well.
Key signal properties:
- Amplitude: 5-500 µV (roughly 1/1000th of the ECG)
- Frequency range: 0.5-30 Hz (traditional range), up to 600 Hz for some fast oscillations
- Excellent temporal resolution (milliseconds) but poor spatial resolution (~6 cm² per electrode)
- Decreases in amplitude with normal aging (neuronal loss)
(Miller's Anesthesia, p. 5214; Adams & Victor's Neurology, p. 40)
2. Electrode Placement: The 10-20 System
Electrodes are placed on the scalp using the International 10-20 System - a symmetric array based on distances from the nasion to inion and between the pretragal bony landmarks:
- F = Frontal, P = Parietal, T = Temporal, O = Occipital, C = Central
- Odd numbers = left hemisphere, even numbers = right hemisphere, Z = midline
- Standard diagnostic EEG: at least 16 channels
- Intraoperative recordings: 1-32 channels; processed EEG monitors (BIS, SedLine) typically use 4 frontal channels
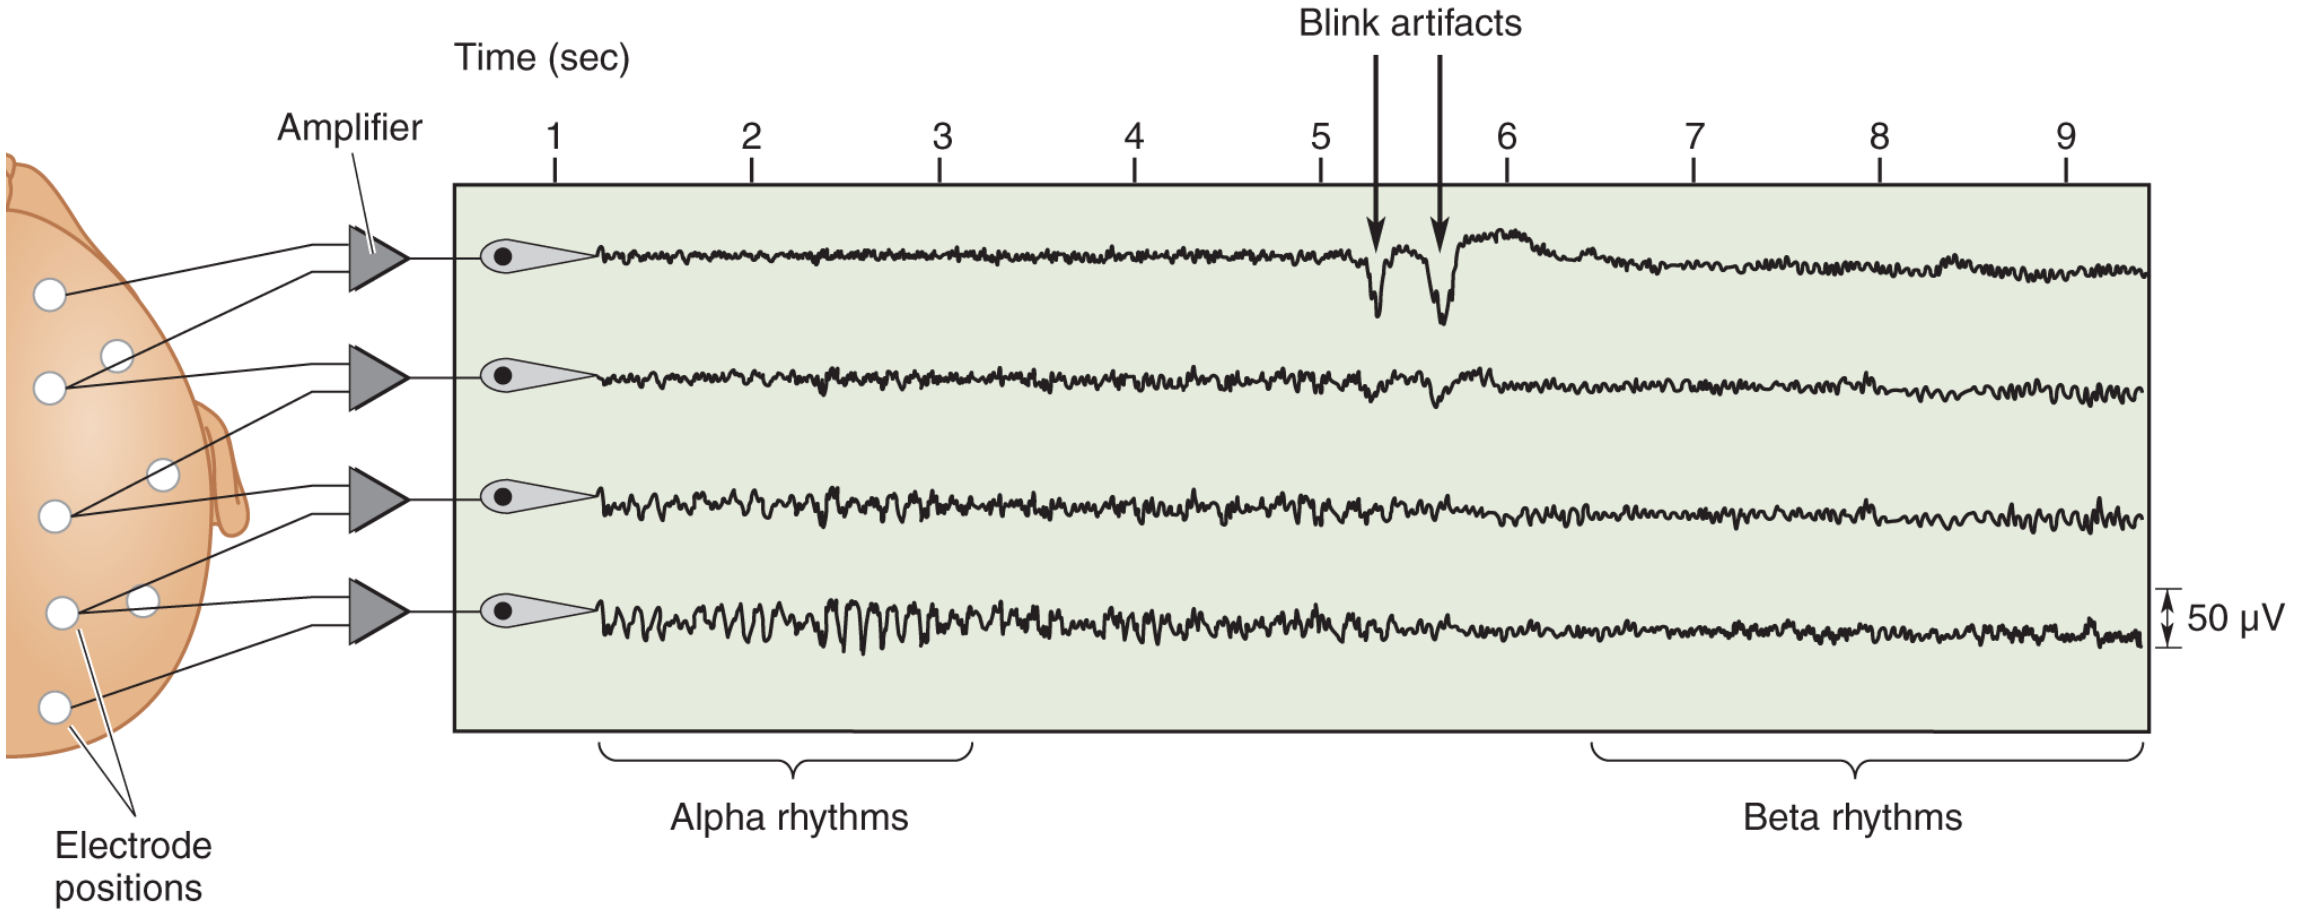
A normal EEG. Alpha rhythms (8-13 Hz) are seen at rest; after eye opening (blink artifacts shown), alpha is replaced by faster beta rhythms. - Neuroscience: Exploring the Brain, p. 1710
3. EEG Frequency Bands: Nomenclature
| Band | Frequency | Amplitude | Normal Associations |
|---|---|---|---|
| Delta (δ) | <4 Hz (0.5-3 Hz) | 50-350 µV (large) | Deep sleep, anesthesia, pathology |
| Theta (θ) | 4-7 Hz | Medium | Drowsiness, temporal regions (normal in elderly) |
| Alpha (α) | 8-13 Hz | ~50 µV | Relaxed, eyes closed; occipital dominant |
| Mu (μ) | 8-13 Hz | Similar to alpha | Sensorimotor regions (at rest) |
| Beta (β) | 13-30 Hz | 10-20 µV (low) | Awake, alert, frontal; increased by benzodiazepines |
| Gamma (γ) | 30-90 Hz | Low | Attentive/activated cortex |
| Sleep spindles | 8-14 Hz | Brief bursts | NREM sleep, dexmedetomidine |
| K complexes | Broad | Large transients | NREM sleep (often with spindles) |
(Neuroscience: Exploring the Brain, p. 1710; Adams & Victor, p. 44; Miller's Anesthesia, p. 5369)
4. The Normal EEG (Awake Baseline)
- Eyes open, alert: Low amplitude, high frequency beta activity (>13 Hz) from frontal regions - the hallmark of an alert, attentive brain
- Eyes closed, relaxed: Higher amplitude alpha activity (8-13 Hz), largest over occipital and posterior parietal regions; waxes and wanes spontaneously. This "eyes-closed resting pattern" is the accepted baseline when describing anesthetic effects
- Eye opening immediately suppresses alpha - the "alpha block" or desynchronization response
- Normal sleep: Alpha rhythm slows and is replaced by vertex sharp waves, sleep spindles (8-14 Hz), and K complexes. Small theta activity may appear over temporal regions (more in patients >60 years)
- Delta activity is absent in the normal waking adult
(Adams & Victor, p. 44; Miller's Anesthesia, p. 5218)
5. From Raw EEG to the Spectrogram
Raw EEG: Voltage vs. time, displayed in a continuously updating 5-10 second window. Shows waveform morphology in detail but is difficult to trend over time.
Fourier transformation: Converts the raw signal (voltage vs. time) into component sine waves of identifiable frequency and amplitude - converting it to a power spectrum (frequency vs. power in µV² or decibels). Power decreases with increasing frequency as a background trend, with oscillatory peaks at specific frequencies (e.g., alpha peak).
Spectrogram (Density Spectral Array, DSA): Power-frequency spectra stacked over time (typically ~1 hour), with:
- X-axis = time
- Y-axis = frequency (Hz)
- Color = power (red = high power; blue = low power)
This is the most practical display format for anaesthesia monitoring - it shows the entire case at a glance and is "as fundamentally important for EEG monitoring of anaesthesia as cardiac ultrasound is for cardiology." - Miller's Anesthesia, p. 5365
6. EEG Changes During Anaesthesia: The Sequential Pattern
A. Induction (GABAergic agents - propofol or volatile agents)
Stage 1 - Awake state: Small amplitude, high frequency activity (~5-10 µV), often with eye blink and muscle artifacts.
Stage 2 - Mild sedation ("Beta buzz"): At the first sedative doses, broad oscillations in the beta range (~15-25 Hz) begin to appear. This often represents an excitatory/disinhibitory phase.
Stage 3 - Loss of responsiveness ("Anteriorization"): When responsiveness is lost, the occipital alpha (present during eyes-closed wakefulness) disappears, and alpha activity appears in frontal areas - a phenomenon called anteriorization. This is a hallmark of early GABA-ergic anesthesia.
(Miller's Anesthesia, p. 5369)
B. Maintenance: The "Alpha-Delta" Pattern
At surgical doses:
- Marked decrease in beta and gamma power
- EEG becomes dominated by slow-wave (0.1-2 Hz) and delta (0.5-4 Hz) oscillations, combined with an alpha (8-12 Hz) oscillation - the characteristic "alpha-delta pattern"
- In the spectrogram, this appears as two horizontal red bands (high power) in the delta and alpha frequency ranges, persisting throughout maintenance
The alpha-delta pattern is:
- The primary target for titration of anaesthesia in almost all cases
- Easily recognized in the spectrogram
- Correlated with loss of responsiveness and suppression of cortical responses to noxious stimuli
- Similar to natural sleep patterns, reflecting thalamocortical hyperpolarization
- Associated with a "resilient brain" unlikely to suffer postoperative cognitive disturbances
However, it does not completely preclude connected consciousness, and its guarantee of amnesia is not fully established.
(Miller's Anesthesia, p. 5373-5374)
C. Burst Suppression
At higher anesthetic doses:
- EEG alternates between low-amplitude suppression periods (<5 µV, isoelectric) and high-amplitude bursts
- This is burst suppression (BS)
- With increasing dose, the suppression periods lengthen until the EEG becomes fully isoelectric
- All EEG monitors display a Suppression Ratio (SR): the fraction of time spent in suppression over a 30-60 second window
A precursor state ("forme fruste") before full burst suppression shows brief, vertical "stripes" of power loss across all frequencies above ~2 Hz while 0.5-2 Hz slow delta continues - seen on the spectrogram.
Burst suppression is NOT physiological. Causes include:
- High anesthetic doses
- Hypothermia
- Hypoxia / ischemia
- Toxic metabolic states
Clinical significance: Observational studies show a clear link between intraoperative burst suppression and impaired postoperative cognitive recovery, including postoperative delirium.
Recommended targets: BIS 40-60; PSI 25-50 (to avoid burst suppression). (Miller's Anesthesia, p. 5374-5375; CSA, 2024)
D. Isoelectric (Flat) EEG
- Complete suppression at maximal anesthetic doses
- Also seen in deep hypothermia (used deliberately in some cardiac surgery), profound ischemia/hypoxia, and brain death
- Important diagnostic distinction: anesthetic-induced isoelectric EEG is reversible, whereas brain death EEG suppression is permanent
7. Emergence
The process is essentially a reversal of induction changes:
- Power in slow-delta and alpha bands decreases
- Peak frequency of the alpha oscillation increases before alpha power fully dissipates
- During late emergence: a period of absent delta and alpha where the patient is unresponsive but in disconnected consciousness (often dreaming)
- ~1/3 of patients abruptly lose high delta power and transition directly to responsiveness
- Immediately on return of responsiveness: occipital alpha reappears (with eyes closed)
- Beta power increases and the power spectrum slope flattens
Neural Inertia
An important asymmetry: patients require higher concentrations of hypnotic drug to become unresponsive during induction than the concentrations at which they emerge. This pharmacodynamic hysteresis is termed "neural inertia" - the brain's resistance to changes in state of consciousness. It means EEG-guided titration during emergence behaves differently from induction.
(Miller's Anesthesia, p. 5381-5382)
8. EEG Responses to Noxious Stimulation
During maintained anaesthesia, surgical stimulation can cause:
- Beta arousal: Increased high-frequency power suggesting cortical arousal (seen with low-dose hypnosis, inadequate opioid)
- Alpha dropout: Decreased alpha band power (seen with balanced techniques)
- Delta arousal: Increased delta power following painful stimulus (paradoxical arousal pattern)
- Shift to higher-frequency desynchronized activity resembling emergence
- Abrupt onset of burst suppression (paradoxical effect)
These EEG changes indicate incomplete anesthetic suppression of surgical stimuli, but their long-term consequences are not fully defined.
(Miller's Anesthesia, p. 5380; SNACC, 2024)
9. Drug-Specific EEG "Fingerprints"
Propofol (and Volatile Agents - GABAergic)
| Phase | EEG Change |
|---|---|
| Induction | Beta buzz → anteriorization (frontal alpha) |
| Maintenance | Alpha-delta pattern (red bands in spectrogram) |
| Higher dose | Burst suppression → isoelectric |
| Emergence | Decreasing delta/alpha, increasing beta, return of occipital alpha |
Nitrous Oxide (N₂O)
- Different mechanism from GABAergic drugs (NMDA antagonism)
- Given alone at atmospheric pressure: minimal, inconsistent EEG changes (rarely produces full unconsciousness)
- Large abrupt concentration changes: large short-lived delta waves + loss of alpha waves
- This pattern can occur with sudden withdrawal (in the wakeful patient) or sudden introduction on a background of ether-based anesthesia
- Most EEG indices (including BIS) are insensitive to N₂O, making its contribution to anesthesia difficult to detect
Xenon
- Dominated by delta power with reductions in all other frequency bands
- Not commonly used clinically
Ketamine (NMDA antagonist)
- Sub-hypnotic doses: Loss of alpha power, increased theta and gamma activity
- Full hypnotic doses: Large slow waves alternating with gamma bursts
- In clinical supplemental doses (25-50 mg bolus/infusion): Decreases alpha oscillatory activity; may increase beta/gamma power
- Mechanism: thalamocortical depolarization secondary to cholinergic, aminergic, and glutamatergic dysregulation
- Important: Ketamine causes spurious elevation of depth-of-anaesthesia indices (e.g., BIS reads higher = apparently "lighter") despite providing real antinociception
(Miller's Anesthesia, p. 5388-5389)
Dexmedetomidine (α₂-agonist)
- Most closely replicates natural sleep EEG patterns of all agents
- Mechanism: suppresses aminergic arousal → thalamocortical hyperpolarization (primarily subcortical action)
- EEG shows sleep spindles (9-15 Hz) superimposed on delta background
- More easily awakened than equivalent propofol sedation (propofol has both subcortical AND direct cortical inhibitory actions)
- Does NOT reliably produce alpha-delta pattern of GABAergic agents
- Spindles are the distinguishing hallmark
(Miller's Anesthesia, p. 5389-5390)
10. Processed EEG (pEEG) Monitors
| Monitor | Index | Target Range |
|---|---|---|
| BIS (Bispectral Index) | 0-100 (100=awake) | 40-60 for GA |
| SedLine (PSI) | 0-100 | 25-50 for GA |
| Entropy (SE/RE) | 0-100 | ~40-60 |
These monitors use proprietary algorithms incorporating:
- Power in different frequency bands (weighted)
- Burst suppression ratio
- Coherence between channels
- Autoregressive parameters
Key limitations of pEEG monitors:
- Artifacts processed along with true signal (can give false readings)
- Only 4 or fewer channels = limited cerebral territory
- Cannot distinguish unilateral from bilateral changes unless bilateral leads placed
- Validated on young, healthy populations - may not apply to all surgical patients
- A BIS of 50 in one patient ≠ BIS of 50 in another; patients become aware at BIS values from 40-90
- Ketamine, dexmedetomidine, and N₂O can give misleading index values
- Index values lag behind real-time EEG changes (time delay of ~30-60 seconds)
(Miller's Anesthesia, p. 5221-5222, 5400)
11. Intraoperative Uses of EEG
- Monitor for cerebral ischemia - e.g., during carotid endarterectomy (regional EEG slowing with preserved, then lost voltage indicates progressing ischemia); reduction in CBF by 50% causes EEG slowing; reduction by 75% causes complete suppression
- Guide anesthetic-induced cerebral metabolic reduction - burst suppression or isoelectric EEG for neuroprotection during anticipated ischemia or raised ICP
- Predict neurologic outcome after brain insult
- Optimize anesthetic delivery - depth of anesthesia monitoring, prevention of awareness and over-sedation
Important caveat: Many normal drug-induced EEG changes (delta slowing, amplitude loss) are indistinguishable from pathological changes caused by ischemia or hypoxemia. Careful anesthetic technique is essential when EEG is used for neural integrity monitoring.
(Miller's Anesthesia, p. 5214, 5219)
12. Key Summary Table: EEG Stages During Anaesthesia
| State | EEG Pattern | Spectrogram | BIS Approx. |
|---|---|---|---|
| Awake (eyes open) | Low amp, high freq beta | Diffuse blue with frontal activity | ~90-100 |
| Awake (eyes closed) | Occipital alpha (8-13 Hz) | Alpha band in occipital | ~85-95 |
| Mild sedation | Frontal beta buzz (15-25 Hz) | Frontal beta power increase | ~70-85 |
| Loss of consciousness | Frontal alpha anteriorization | Frontal alpha band appears | ~55-70 |
| Surgical maintenance | Alpha-delta pattern | Red bands in delta AND alpha | 40-60 |
| Overdose - precursor | Loss of frequencies >2 Hz | Vertical stripes of low power | <40 |
| Burst suppression | Alternating bursts + isoelectric | Intermittent power loss | <40 |
| Isoelectric | Flat line | No power in any band | ~0 |
| Emergence | Delta/alpha ↓, beta ↑ | Bands dissolving, beta reappears | Rising to >60 |
References:
- Miller's Anesthesia, 2-Volume Set, 10th ed., Chapter 35 (Neuromonitoring) pp. 5214-5222; Chapter 36 (EEG Monitoring of Anaesthesia) pp. 5363-5410
- Adams and Victor's Principles of Neurology, 12th ed., Chapter 2 (EEG) pp. 40-45
- Neuroscience: Exploring the Brain, 5th ed., Chapter 19 (EEG Rhythms) pp. 1710-1712
BIS MONITORING IN DETAIL
The BIS (Bispectral Index) monitor processes frontal EEG into a dimensionless 0-100 scale to quantify depth of hypnosis. It combines multiple EEG features - power spectrum, bispectrum, and burst suppression - into a single number. Target range for general anaesthesia is 40-60; below 40 risks burst suppression, above 60 risks awareness.
Searching sources...
Finding Sources
Finding Sources
Searching the Web
BIS bispectral index monitoring depth anaesthesia algorithm components limitations 2024
Let me now find the specific BIS sections in the anaesthesia textbooks and read them in detail:
Finding Sources
Finding Sources
Reading Web Page
https://www.ncbi.nlm.nih.gov/books/NBK539809
Found BIS sections in Miller's block 20 and block 15. Let me now read them in full, along with the Barash textbook and Morgan & Mikhail sections:
Reading File
Reading File
Finding Sources
Let me now read the core BIS sections from Miller's Chapter 36 (block 15) - specifically the processed EEG indices section:
Reading File
Finding Sources
Finding Sources
Now let me read the Barash clinical anesthesia section on BIS, and the Morgan & Mikhail section:
Finding Sources
Reading File
Now let me read the Morgan & Mikhail section, and the Barash BIS section, plus fetch the BIS image:
Reading File
Reading File
Loading Image
I now have comprehensive textbook content. Let me do one more targeted read to get the Barash section and the clinical significance/deep anaesthesia harms section:
Finding Sources
Reading File
I now have all the material needed for a comprehensive, detailed answer on BIS monitoring. Let me compile it:
BIS (Bispectral Index) Monitoring - Detailed
Sources: Miller's Anesthesia 10th ed. (Chapters 35 & 36), Morgan & Mikhail's Clinical Anesthesiology 7th ed., Miller's Cardiac Anaesthesia chapter
1. Background and Development
The BIS monitor was introduced in the early 1990s as the first commercially successful processed EEG device for intraoperative use. Its development was driven primarily by the need to prevent intraoperative awareness with recall (AWR) - one of the most feared complications of anaesthesia, with an estimated incidence of 1-2 per 1000 cases under general anaesthesia (rising to 1.5% in cardiac surgery and up to 43% in major trauma cases).
It was a significant advance because it was:
- Relatively robust to noise
- Capable of reliably detecting burst suppression
- Capable of detecting and rejecting artifacts
- Showed reasonable correlation with commonly used GABAergic anesthetic drugs
- Made routine EEG monitoring accessible to operating room practitioners without specialist training
(Miller's Anesthesia, p. 5408; Morgan & Mikhail, p. 2347)
2. The BIS Number: What It Is
The BIS is a dimensionless number from 0 to 100 derived from the frontal EEG:
| BIS Value | Clinical Interpretation |
|---|---|
| 100 | Fully awake, alert |
| 80-100 | Awake/light sedation |
| 60-80 | Moderate sedation; possible recall |
| 40-60 | General anaesthesia - target range for surgery |
| < 40 | Deep hypnotic state; risk of burst suppression |
| 0 | Complete cortical silence (isoelectric EEG) |
The number is obtained by analyzing the EEG waveform, considering frequency, phase, and power spectrum through a proprietary mathematical algorithm.
(StatPearls - BIS; Miller's Anesthesia, p. 5400)
3. The BIS Algorithm: How It Works
The BIS algorithm is proprietary, but its general structure is known. It was derived empirically by observing EEG transitions into and out of anaesthesia and using statistical algorithms to maximize prediction of consciousness vs. unconsciousness.
Three Core Mathematical Components
A. Power Spectrum Analysis (Spectral Analysis)
- The raw EEG undergoes Fourier transformation, converting the voltage-vs-time signal into frequency components
- The power in different frequency bands is quantified
- As depth of anaesthesia increases, there is progressive slowing of the EEG (shift from beta/gamma to alpha/delta)
- The relative beta ratio - comparing power in the 30-47 Hz range to the 11-20 Hz range - is a key sub-component. As anaesthesia deepens, beta power falls relative to lower frequencies
B. Bispectral Analysis (the defining innovation)
- The standard power spectrum captures the amplitude (power) of each frequency component but discards phase information - it cannot detect whether different frequency components are synchronized with each other
- Bispectral analysis measures the phase coupling (synchrony) between different EEG frequencies - i.e., whether two different frequencies interact to produce a third frequency (e.g., f1 + f2 = f3)
- The degree of this cross-frequency coupling (called bicoherence) changes markedly with anaesthetic depth
- In the awake state, EEG frequencies are largely independent (low bicoherence)
- During anaesthesia, EEG frequencies become highly coupled (high bicoherence), particularly the synchronization between slow and fast oscillations in the alpha-delta pattern
- This is the unique feature that differentiates BIS from simple spectral analysis
C. Burst Suppression Detection
- The algorithm detects and quantifies burst suppression via the QUAZI suppression sub-algorithm
- It calculates a Suppression Ratio (SR): the percentage of time in the last 63 seconds where the EEG amplitude is less than 5 µV (i.e., in suppression)
- SR is incorporated into the final BIS number (increasing SR drives BIS towards 0)
- A "forme fruste" pre-burst-suppression state is also detected where power at all frequencies above ~2 Hz abruptly decreases for short periods
D. EMG Incorporation
- High-frequency (70-110 Hz) electromyographic (EMG) activity is also incorporated into the BIS calculation
- This has been controversial: EMG activity (from facial/frontalis muscle contraction) increases the BIS value
- The system partially uses EMG as a marker of cortical arousal, but it also means that muscular artifact causes falsely elevated BIS values
The final BIS number is a weighted composite of all these sub-parameters, with the specific weights being proprietary.
(Miller's Anesthesia, p. 5398-5400; LITFL BIS monitoring)
4. Hardware: The BIS System
Components
| Component | Description |
|---|---|
| BIS Sensor (Electrode) | Disposable adhesive strip with 4 electrodes placed on the forehead and temple |
| BIS Interface Cable | Connects sensor to the monitoring module |
| BIS Module/Monitor | Processes EEG signals; displays BIS number, raw EEG, trend, SR, SQI, EMG bar |
| DSC (Digital Signal Converter) | Analog-to-digital conversion |
Electrode Placement
- A single strip placed on the forehead (frontal) and temple (frontotemporal)
- 4 electrode contacts: reference, 2 active EEG channels, ground
- The placement uses the frontotemporal region because GABAergic drugs cause anteriorization of EEG activity into frontal areas, maximizing the signal detectable at these sites
- Skin impedance must be < 5 kΩ (ideally similar at all electrodes) for reliable signal
Displayed Parameters on the BIS Monitor
| Parameter | Meaning |
|---|---|
| BIS number | Main index, 0-100 |
| SQI (Signal Quality Index) | 0-100%; quality of the EEG signal. Values >50% generally required for reliable BIS |
| SR (Suppression Ratio) | % of last 63 s where EEG is isoelectric. Target: 0% (>0% means too deep) |
| EMG bar | Indicator of high-frequency EMG activity (30-300 Hz); elevated bar warns of muscle artifact |
| Raw EEG | Continuous waveform display (5-10 second window) |
| BIS trend | History of BIS over time (typically last 30-60 min) |
| Smoothing rate | 10 s (default) or 30 s; determines how rapidly BIS responds to changes |
(StatPearls - BIS; CSA Neuromonitoring 2024)
5. How BIS Is Used in Clinical Practice
During Induction
- BIS starts at ~90-100 (awake)
- At mild sedation: BIS 70-85
- At loss of consciousness: typically BIS drops to 60-70
- Note: There is a time delay of up to 104 seconds between actual EEG changes and the displayed BIS value due to the signal processing algorithm. This lag means the displayed BIS during induction often underestimates the depth already achieved
During Maintenance
- Target: BIS 40-60 for general anaesthesia
- In this range, the underlying EEG typically shows the alpha-delta pattern (appropriate thalamocortical hyperpolarization)
- BIS-guided titration allows drug dose reduction: studies show ~25% reduction in volatile agent consumption and faster recovery times when BIS is used
- A BIS consistently < 40 warrants reducing anaesthetic dose to prevent burst suppression
- A BIS consistently > 60 during surgical stimulation warrants increasing the anaesthetic
During Emergence
- BIS begins rising as drug effect wears off
- Return of responsiveness typically occurs at BIS 60-70, though with wide inter-individual variation (patients have been known to emerge at BIS values from 40 to 90)
- The neural inertia phenomenon means patients emerge at lower drug concentrations than required for induction - so emergence BIS correlates with emergence but not with induction pharmacology
(Miller's Anesthesia, p. 5400-5401)
6. Validation: The Major Clinical Trials
| Trial | Year | Design | Finding |
|---|---|---|---|
| B-Aware | 2004 | RCT, high-risk patients; BIS vs standard care | BIS reduced awareness (0.17% vs 0.91%) - landmark but criticized for low fragility index |
| B-Unaware | 2008 | RCT, high-risk patients; BIS vs ETAG (≥0.7 MAC) | No difference between BIS and end-tidal agent monitoring |
| BAG-RECALL | 2011 | RCT; BIS vs ETAG (≥0.7 MAC) | No difference in awareness rates |
| Mashour et al. | 2012 | Large RCT, 18,836 unselected patients; BIS vs ETAG | No significant overall difference; post-hoc analysis showed benefit when BIS equipment functioned properly |
| PONV/TIVA study | 2014 | RCT, TIVA with propofol | Marked reduction: awareness from 0.65% to 0.14% with BIS guidance |
Meta-analysis summary (52 studies, 41,331 participants, Miller's 2024): BIS monitoring more than halves AWR compared to clinical monitoring alone (OR 0.36, 95% CI 0.21-0.60). Incidence: 3 per 1000 with BIS vs 9 per 1000 with clinical signs - but no significant benefit over end-tidal anesthetic agent monitoring.
Key interpretation: BIS appears most valuable for TIVA (propofol-based), where there is no reliable end-tidal measurement of hypnotic depth. For inhalational anaesthesia, an adequate MAC (≥0.7) combined with standard clinical monitoring performs equivalently.
(Miller's Anesthesia, p. 5408-5409; Morgan & Mikhail, p. 2348)
7. Clinical Applications
1. Prevention of Awareness with Recall (AWR)
- The primary indication
- Especially valuable in TIVA cases, cardiac surgery (reduced volatile due to haemodynamic compromise), obstetric anaesthesia, major trauma surgery
- Incidence of awareness is higher in: women, cardiac surgery, caesarean section, patients on chronic opioids/benzodiazepines, emergency cases
2. Prevention of Excessive (Deep) Anaesthesia
- Deep anaesthesia (BIS <40, burst suppression) is associated with:
- Postoperative delirium (POD)
- Postoperative neurocognitive dysfunction (PNCD)
- Possible excess mortality (though the Balanced Anaesthesia Study failed to show mortality benefit from BIS titration)
- BIS guidance reduces total drug consumption, facilitating faster recovery and reducing PACU time
3. Fast-tracking and Efficiency
- BIS-guided anaesthesia associated with shorter time to eye opening, faster PACU discharge
- Particularly useful in ambulatory surgery with propofol and desflurane
4. Detection of Cerebral Ischaemia (Intraoperative)
- During carotid endarterectomy or cardiac surgery: sudden unilateral or bilateral EEG slowing may indicate ischaemia
- BIS is less sensitive for this application than multichannel raw EEG; it monitors primarily frontal regions only
- However, sudden EEG changes during CPB can signal correctable problems (SVC obstruction, severe CO reduction)
5. ICU Sedation
- BIS can guide sedation in critically ill/ventilated patients
- Target range: 60-70 for light sedation; 40-60 for deeper sedation
(Miller's Anesthesia, p. 5214, 5709; Morgan & Mikhail, p. 2348)
8. Factors That Falsely INCREASE BIS (Falsely "Light")
These cause the BIS to read higher than expected for the actual anaesthetic depth - risking under-dosing if relied upon exclusively:
| Factor | Mechanism |
|---|---|
| EMG artifact | Frontalis/facial muscle contraction (EMG 30-300 Hz) is included in BIS calculation; most common cause of spuriously high BIS |
| Ketamine | NMDA antagonism depolarizes thalamocortical circuits; increases beta/gamma power, decreases alpha oscillation → BIS rises despite adequate anaesthesia |
| Nitrous oxide | NMDA mechanism, not GABAergic; minimal impact on EEG → BIS insensitive to N₂O contribution |
| Epidural/spinal anaesthesia without sedation | Patient awake but not moving - BIS may be 90+ but surgery is possible |
| Electrode impedance mismatch | Poor electrode contact generates artifact |
| Pacemaker signals | Electrical interference |
| Patient movement | Causes muscle artifact |
9. Factors That Falsely DECREASE BIS (Falsely "Deep")
These cause BIS to read lower than expected - risking under-treatment of a potentially awake patient:
| Factor | Mechanism |
|---|---|
| Hypothermia | Cerebral metabolic suppression → EEG slowing → low BIS even at light anaesthetic doses |
| Cerebral ischaemia/hypoxia | EEG slowing/suppression mimics anaesthetic effect |
| Severe hypoglycaemia | Metabolic encephalopathy |
| High-voltage delta from pathology | Brain injury, encephalopathy |
| Dexmedetomidine | Produces sleep-like patterns that may cause underestimation of depth (see below) |
| Propofol bolus artifact | Rapid EEG change creates transient false low BIS before algorithm catches up |
10. Drug-Specific BIS Behaviour
| Agent | BIS Effect | Clinical Note |
|---|---|---|
| Propofol | Good correlation; BIS 40-60 at surgical depth | Best validated agent for BIS |
| Volatile agents (iso, sevo, des) | Reasonable correlation; BIS 40-60 at 0.7-1.0 MAC | ETAG monitoring equivalent to BIS for volatiles |
| Thiopental | Correlates well | Deep suppression at high doses |
| Nitrous oxide | Poor correlation - BIS insensitive to N₂O; can give normal BIS at 50-70% N₂O | Always account for N₂O separately |
| Ketamine | Falsely elevates BIS - increases beta/gamma despite sedation | BIS unreliable; interpret with caution |
| Dexmedetomidine | Produces spindle-based sleep patterns; indices tend to correlate but may underestimate depth | Patients more easily awakened at same BIS as propofol |
| Opioids alone | Minimal effect on BIS at analgesic doses | BIS primarily reflects hypnotic component |
| Benzodiazepines | Increase fast (beta) activity → may transiently raise BIS before lowering it | |
| Neuromuscular blockers | Paralysis eliminates EMG artifact → may decrease BIS by several points even though no change in consciousness | A real clinical trap |
(Miller's Anesthesia, p. 5388-5390)
11. Limitations of BIS Monitoring
Technical Limitations
- Proprietary algorithm - exact weightings unknown; cannot be independently validated or modified
- Time delay: up to 104 seconds lag between actual brain state change and displayed value (due to epoch-based processing, typically 30-second smoothing window)
- Only 4 frontal channels - monitors a very small fraction of total brain tissue; misses posterior cortex (where consciousness may partially reside) and subcortical structures
- Cannot detect unilateral ischaemia unless bilateral leads placed
- Validated on young healthy populations - application to elderly, paediatric, neurologically impaired patients requires caution
Clinical Limitations
- A BIS of 50 in one patient ≠ BIS of 50 in another - significant inter-individual variability; patients become aware at BIS values from 40 to 90
- Cannot predict response to surgical incision - poor correlation of EEG indices with movement response to incision
- No opioid information - BIS reflects only the hypnotic component of anaesthesia; does not measure antinociception
- "Graded consciousness" problem - binary classification of "aware/not aware" does not reflect the reality of graded, continuous states of consciousness
- Not a gold standard for awareness - as Miller's states: "a single number is analogous to getting only the heart rate from the ECG"
- Neural inertia asymmetry - BIS values during emergence do not mirror induction values due to pharmacodynamic hysteresis
Specific Conditions
- Hypothermia, ischaemia, and hypoxia produce changes identical to deep anaesthesia - extremely important in cardiac surgery and neurosurgery
- EMG contamination - the most common cause of falsely elevated BIS in clinical practice; neuromuscular blockade artificially lowers BIS
- Paediatric limitations - immature EEG patterns in neonates and infants; BIS values less reliable
(Miller's Anesthesia, p. 5221, 5400-5402; StatPearls - BIS; Miller's Cardiac, p. 7422)
12. EEG Artifacts Affecting BIS (with illustration)
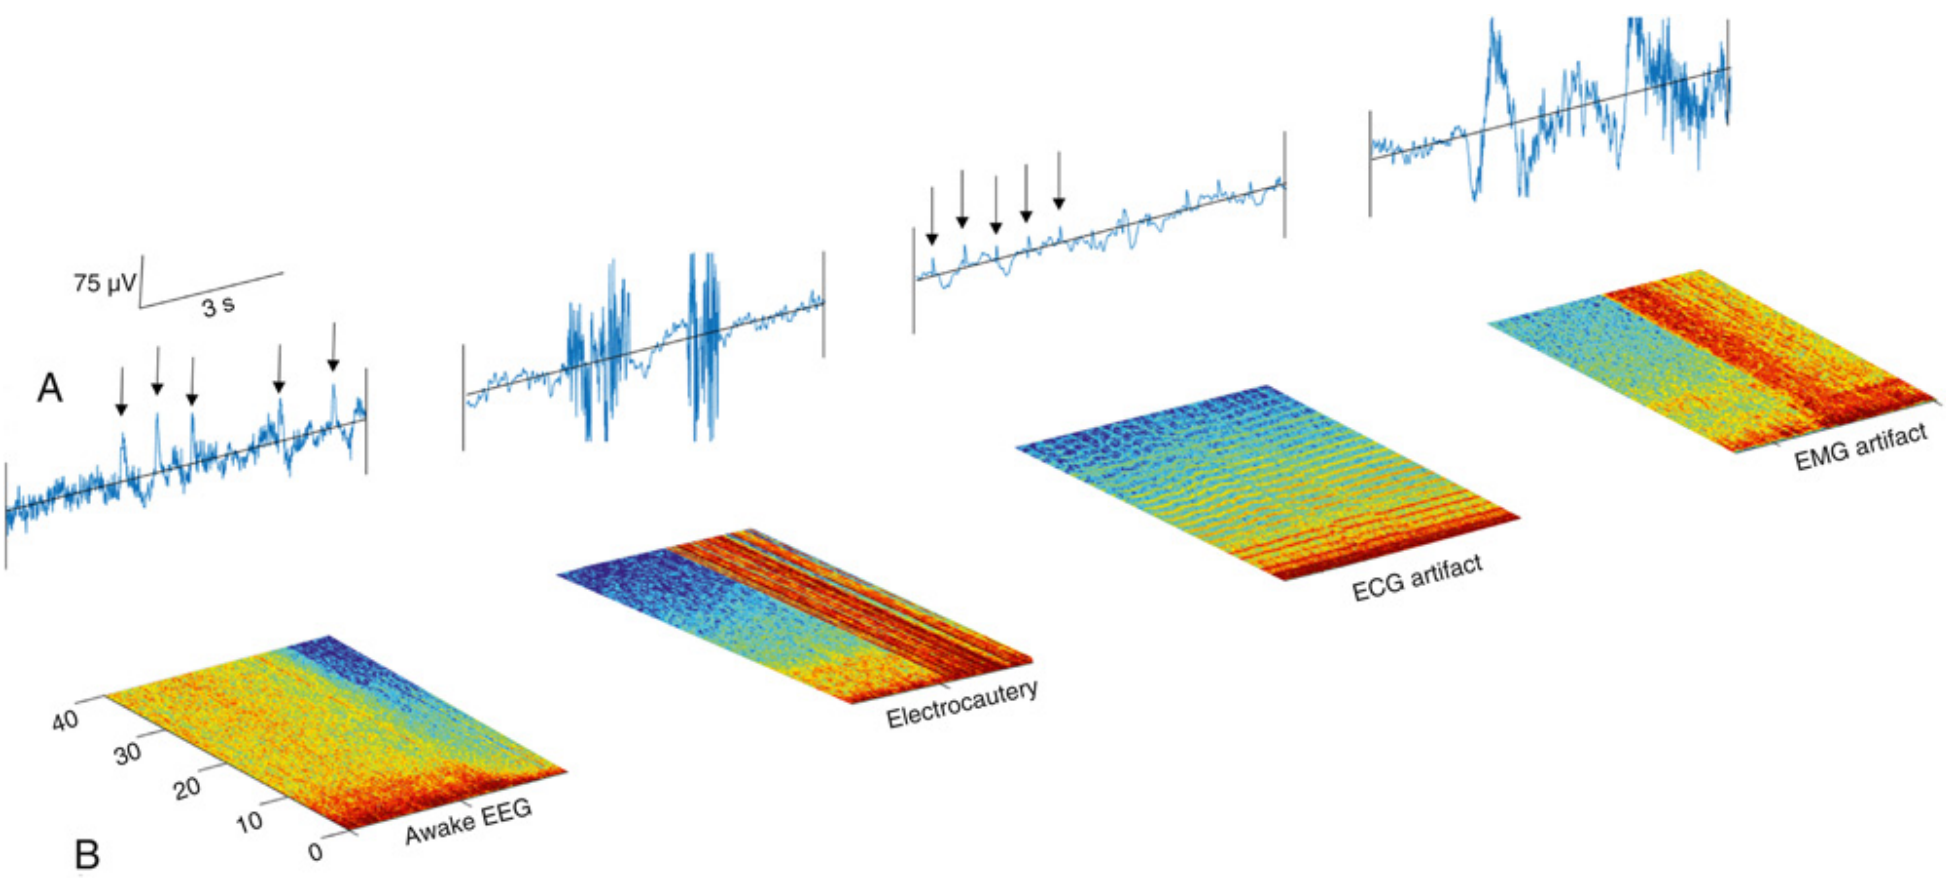
FIG. 36.10 (Miller's Anesthesia): Four types of artifacts shown in raw EEG (A) and spectrogram (B). From left: (1) eye-blink artifacts (thin red vertical lines in spectrogram); (2) electrocautery (block of cross-frequency red regions); (3) ECG artifact (horizontal stripes shifting with heart rate); (4) EMG artifact during emergence (vertical red bands). Each of these can cause spurious BIS readings.
13. Alternatives to BIS
| Monitor | Index | Method | Note |
|---|---|---|---|
| SedLine (Masimo) | PSI (Patient State Index) | 4 frontal channels; power spectrum | Target PSI 25-50 for GA |
| Entropy (GE) | SE (State Entropy), RE (Response Entropy) | SE uses 32-47 Hz; RE adds EMG 32-47 Hz | RE-SE gap indicates EMG/arousal |
| Narcotrend | A-F stages / numeric 0-100 | Pattern recognition | Common in Europe |
| qCON (Quantium) | qCON 0-99 | Power spectrum + coherence | |
| Raw EEG + Spectrogram | None - visual interpretation | Full EEG information | Most information-rich; requires training |
The key conceptual advantage of raw EEG + spectrogram over all processed indices is that the full signal contains far more information: the spectrogram shows the alpha-delta pattern, burst suppression, anteriorization, emergence changes, and drug-specific fingerprints that a single number cannot capture.
14. The "Deep Anaesthesia Is Harmful" Debate
This is now a major area of BIS research:
Evidence for harm from deep anaesthesia:
- Observational studies consistently show an association between deep anaesthesia (low BIS, burst suppression) and:
- Postoperative delirium
- Postoperative neurocognitive dysfunction/decline
- Possible increased 1-year mortality (observational)
Counterarguments:
- These associations may reflect confounding - patients with more comorbidities and older/frailer brains naturally require less drug to achieve low BIS (they're more sensitive) AND are more prone to poor outcomes
- The Balanced Anaesthesia Study (large RCT): randomised patients to deep (BIS 35-45) vs light (BIS 50-60) anaesthesia and found no mortality difference
- EEG monitoring may simply reveal "sensitive" brains rather than causing harm through deep anaesthesia itself
Current recommendation: Avoid burst suppression (SR > 0, or BIS < 40 for prolonged periods) especially in the elderly, given observational evidence of cognitive harm, even if causal mechanism is unproven.
(Miller's Anesthesia, p. 5410)
Summary
BIS monitoring provides an objective, real-time measure of the hypnotic component of anaesthesia by processing frontal EEG into a 0-100 dimensionless index. It is most useful in TIVA, high-risk patients, and situations where end-tidal monitoring is unavailable or unreliable. The optimal target is BIS 40-60 during surgery. Its principal limitations are: single-number reductionism, time lag, EMG artifact, drug-specific unreliability (especially ketamine and N₂O), and significant inter-individual variability. It should always be interpreted alongside the raw EEG, clinical signs, and haemodynamic data - not used as a standalone depth monitor.
References:
- Miller's Anesthesia, 10th ed., Chapters 35 (pp. 5214-5222) and 36 (pp. 5398-5413)
- Miller's Anesthesia, Cardiac Chapter 20 (pp. 7421-7422)
- Morgan & Mikhail's Clinical Anesthesiology, 7th ed., pp. 2347-2348
- StatPearls: Bispectral Index
This is a shared conversation. Sign in to Orris to start your own chat.