
Normal ecg waves interval and segment boxes and time interval
Reading File
A normal ECG has clearly defined waves (P, Q, R, S, T), segments (PR segment, ST segment), and intervals (PR interval, QRS duration, QT interval). On standard ECG paper, each small box = 0.04 sec horizontally and 0.1 mV vertically; each large box = 0.2 sec.
Searching sources...
Finding Sources
Searching the Web
normal ECG waves intervals segments time values boxes
Finding Sources
Loading Image
Loading Image
Finding Sources
Loading Image
Here is a complete, structured breakdown of normal ECG waves, segments, and intervals - with the standard ECG grid boxes reference.
ECG Paper - The Grid

| Box | Time (horizontal) | Voltage (vertical) |
|---|---|---|
| Small box | 0.04 sec (40 ms) | 0.1 mV |
| Large box (5 small) | 0.20 sec (200 ms) | 0.5 mV |
| 5 large boxes | 1.0 sec | 1 mV (standard calibration) |
Standard paper speed: 25 mm/sec
Waves, Segments & Intervals Diagram
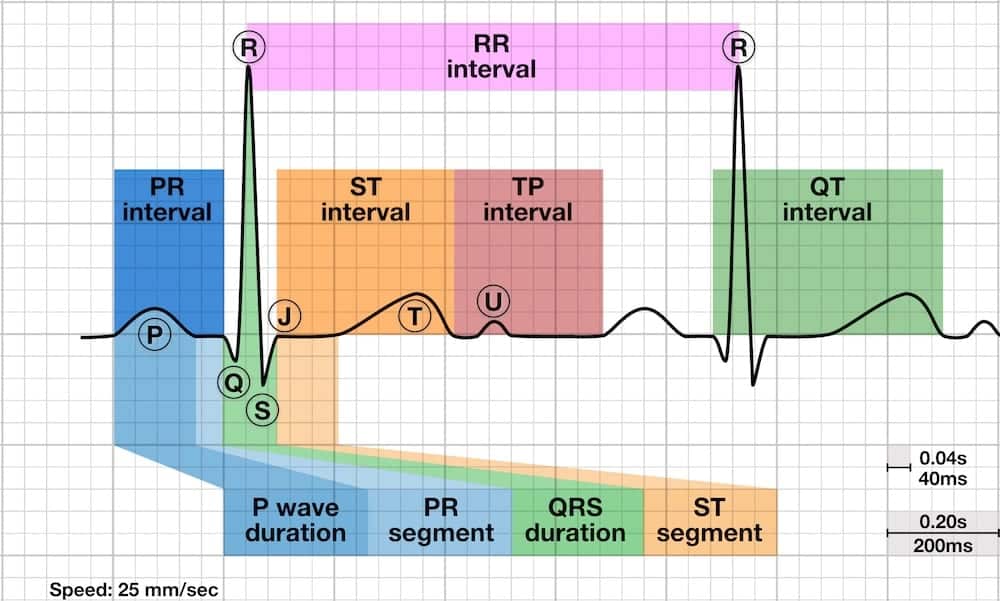
Individual Waves
| Wave | Represents | Normal Duration | Normal Amplitude |
|---|---|---|---|
| P wave | Atrial depolarization | 0.08 - 0.10 sec (2 - 2.5 small boxes) | < 2.5 mm tall, < 0.12 sec wide |
| Q wave | Septal depolarization (initial) | < 0.04 sec (< 1 small box) | < 25% of R wave height |
| R wave | Ventricular depolarization (main) | Part of QRS | Varies by lead |
| S wave | Terminal ventricular depolarization | Part of QRS | Varies by lead |
| T wave | Ventricular repolarization | 0.16 sec approx | Upright in most leads |
| U wave | Purkinje repolarization (if visible) | Small, follows T | Same direction as T wave |
Segments (isoelectric lines between waves)
| Segment | From - To | Normal Duration | Significance |
|---|---|---|---|
| PR segment | End of P wave → Start of QRS | 0.06 - 0.10 sec | AV nodal conduction delay; normally at baseline |
| ST segment | End of QRS (J point) → Start of T wave | 0.08 - 0.12 sec | Ventricular repolarization start; should be at baseline (±1 mm) |
| TP segment | End of T wave → Start of next P wave | Varies with heart rate | True isoelectric baseline reference |
Intervals (include waves + segments together)
| Interval | From - To | Normal Duration | Boxes (small) | Significance |
|---|---|---|---|---|
| PR interval | Start of P wave → Start of QRS | 0.12 - 0.20 sec | 3 - 5 small boxes | AV conduction time; prolonged = 1st degree block |
| QRS duration | Start of Q → End of S | < 0.12 sec | < 3 small boxes | Ventricular depolarization; wide = bundle branch block |
| QT interval | Start of QRS → End of T wave | 0.35 - 0.45 sec (rate-dependent) | 9 - 11 small boxes at 60 bpm | Ventricular depolarization + repolarization; prolonged = torsades risk |
| QTc (corrected) | QT corrected for heart rate (Bazett) | < 0.44 sec (men), < 0.46 sec (women) | - | Normal upper limit |
| RR interval | R peak to next R peak | 0.60 - 1.0 sec (60 - 100 bpm) | 3 - 5 large boxes | Heart rate: 300 ÷ number of large boxes |
| PP interval | P wave to next P wave | Same as RR in sinus rhythm | - | Atrial rate |
Quick Box-Counting Rules
| What you're measuring | Rule |
|---|---|
| Heart rate | 300 ÷ large boxes between R waves (or 1500 ÷ small boxes) |
| PR interval normal | 3 to 5 small boxes |
| QRS normal | Less than 3 small boxes |
| P wave width normal | Less than 3 small boxes |
| ST elevation/depression | Measured 1 small box after J point; abnormal if > 1 mm |
Summary Visual (ECG with grid)
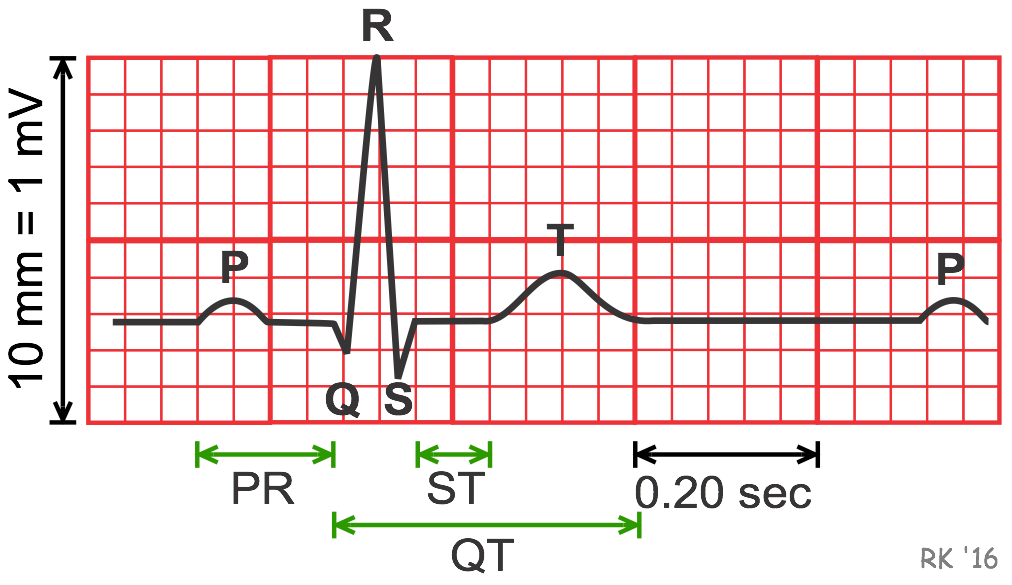
Key takeaways:
- Small box = 0.04 sec / 0.1 mV
- PR interval: 3-5 small boxes (0.12-0.20 sec)
- QRS: under 3 small boxes (< 0.12 sec)
- QT interval: roughly 9-11 small boxes at normal heart rates
- ST segment sits at the isoelectric line (baseline)
Wbat about significant height
On ECG paper, the vertical axis measures voltage (amplitude/height). Each small box = 0.1 mV and each large box = 0.5 mV. Wave heights have specific normal and abnormal thresholds.
Searching sources...
Finding Sources
Searching the Web
ECG wave amplitude height normal values mV boxes P wave R wave T wave
Reading Web Page
https://pmc.ncbi.nlm.nih.gov/articles/PMC1122394
Loading Image
Here is the complete guide to ECG wave heights (amplitude/voltage) - the vertical axis measurements.
ECG Vertical Scale (Voltage)
| Box | Voltage |
|---|---|
| 1 small box | 0.1 mV (1 mm) |
| 1 large box (5 small) | 0.5 mV (5 mm) |
| 2 large boxes | 1.0 mV (10 mm) = standard calibration mark |
Normal Wave Heights (Amplitude)
P Wave
| Parameter | Normal Value | Boxes |
|---|---|---|
| Height (amplitude) | ≤ 2.5 mm (0.25 mV) | ≤ 2.5 small boxes |
| Width (duration) | < 0.12 sec | < 3 small boxes |
| Abnormal: tall P (P pulmonale) | > 2.5 mm in lead II | Right atrial enlargement |
| Abnormal: wide/bifid P (P mitrale) | > 0.12 sec, notched | Left atrial enlargement |
Q Wave
| Parameter | Normal Value |
|---|---|
| Depth | < 2 small boxes (< 2 mm / < 0.2 mV) |
| Width | < 1 small box (< 0.04 sec) |
| Relative size | < 25% of corresponding R wave height |
| Pathological Q | ≥ 2 mm deep AND ≥ 0.04 sec wide = old MI |
R Wave
| Lead | Normal Height |
|---|---|
| Limb leads (I, II, III) | Varies; R in lead I < 13 mm |
| Precordial (V1-V6) | Progressive increase V1 → V5 |
| V1 | Small r wave normal; tall R = RVH |
| V5/V6 | Usually < 27 mm |
| S wave depth | Should not exceed 30 mm |
| R + S (Sokolow-Lyon for LVH) | S in V1 + R in V5/V6 > 35 mm = LVH |
| R wave in aVL | > 11 mm = LVH |
R wave progression - R wave gets taller from V1 to V5, then may decrease slightly in V6. Transition (where R = S) usually at V3 or V4.
T Wave
| Parameter | Normal Value |
|---|---|
| Limb leads | Rarely > 6 mm |
| Chest leads V2-V3 (men) | Up to 10 mm |
| Chest leads V2-V3 (women) | Up to 8 mm |
| Relative to R wave | ≥ 1/8 and < 2/3 of corresponding R wave amplitude |
| Direction | Upright in I, II, V3-V6; inverted in aVR; variable in III, aVL, V1 |
| Abnormal: tall peaked T | > 10 mm (men) or > 8 mm (women) - think hyperkalemia |
| Abnormal: inverted T | Ischemia, strain, or bundle branch block |
ST Segment Height
| Parameter | Normal Value |
|---|---|
| ST elevation | ≤ 1 mm in limb leads |
| ST elevation | ≤ 2 mm in precordial leads (men), ≤ 1.5 mm in women |
| ST depression | < 0.5 mm (> 1 mm is significant) |
| Measured at | 1 small box (0.04 sec) after the J point |
Quick Summary Table
| Wave | Max Normal Height | Abnormal if |
|---|---|---|
| P wave | 2.5 mm (0.25 mV) | > 2.5 mm = atrial enlargement |
| Q wave | < 2 mm deep, < 25% of R | ≥ 2 mm + wide = pathological Q |
| R wave (V5/V6) | < 27 mm | > 27 mm or Sokolow > 35 mm = LVH |
| T wave | < 6 mm (limb), < 10 mm (chest) | Peaked = hyperkalemia; inverted = ischemia |
| ST segment | ≤ 1 mm elevation | > 1-2 mm elevation = MI / > 1 mm depression = ischemia |
| U wave | < 1.5 mm | > 1.5 mm or inverted = hypokalemia/ischemia |
Key rule: On standard ECG paper, 10 mm = 1 mV (calibration pulse). So every millimeter of height = 0.1 mV. Wave height is measured from the isoelectric baseline (TP segment) to the peak of the wave.
This is a shared conversation. Sign in to Orris to start your own chat.