
Explained in easy way , include indication, mode , settings, all waveform with figure and diagram, stop or wean off, all things thoroughly and indetailed,
cd /tmp/workspace/attachments/6baaca0f-1aee-4888-8310-0164e6079c8b/ && python3 -c " import pdfplumber files = [ 'Ventilator_Waveforms.pdf', 'Discontinuation_of_Mechanical_Ventilation.pdf', 'Modes_of_Mechanical_Ventilation.pdf' ] for fname in files: print(f'\n\n========== {fname} ==========\n') with pdfplumber.open(fname) as pdf: print(f'Total pages: {len(pdf.pages)}') for i, page in enumerate(pdf.pages): text = page.extract_text() if text: print(f'--- Page {i+1} ---') print(text[:3000]) print() " 2>&1 | head -500
cd /tmp/workspace/attachments/6baaca0f-1aee-4888-8310-0164e6079c8b/ && python3 -c " from pypdf import PdfReader import base64, os # Check if PDFs have images or are text-based for fname in ['Ventilator_Waveforms.pdf', 'Discontinuation_of_Mechanical_Ventilation.pdf', 'Modes_of_Mechanical_Ventilation.pdf']: reader = PdfReader(fname) print(f'\n{fname}: {len(reader.pages)} pages') page = reader.pages[0] print(' Resources:', list(page.get('/Resources', {}).keys()) if page.get('/Resources') else 'None') # Try raw text try: raw = page.extract_text() print(' Text sample:', raw[:200] if raw else 'NO TEXT') except: print(' Text extraction failed') "
python3 -c " from pypdf import PdfReader import io, os base = '/tmp/workspace/attachments/6baaca0f-1aee-4888-8310-0164e6079c8b/' out = '/tmp/workspace/mv_images/' os.makedirs(out, exist_ok=True) files = { 'waveforms': 'Ventilator_Waveforms.pdf', 'discontinuation': 'Discontinuation_of_Mechanical_Ventilation.pdf', 'modes': 'Modes_of_Mechanical_Ventilation.pdf' } for key, fname in files.items(): reader = PdfReader(base + fname) os.makedirs(f'{out}{key}/', exist_ok=True) for pg_num, page in enumerate(reader.pages): resources = page.get('/Resources', {}) xobjects = resources.get('/XObject', {}) if hasattr(xobjects, 'get_object'): xobjects = xobjects.get_object() for img_name, obj in xobjects.items(): if hasattr(obj, 'get_object'): obj = obj.get_object() if obj.get('/Subtype') == '/Image': data = obj.get_data() ext = 'jpg' if obj.get('/Filter') in ['/DCTDecode', 'DCTDecode'] else 'png' img_path = f'{out}{key}/pg{pg_num+1}_{img_name.replace(\"/\",\"\")}.{ext}' with open(img_path, 'wb') as f: f.write(data) print(f'Saved: {img_path} ({len(data)} bytes)') " 2>&1 | head -60
mechanical ventilation modes waveforms pressure volume flow time
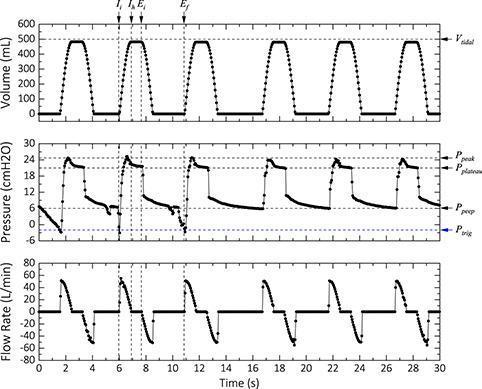
This diagnostic graphic displays three stacked ventilator waveforms (Volume, Pressure, and Flow Rate) over a 30-second interval, demonstrating mechanical ventilation in assisted mode. The top graph shows Tidal Volume (Vt) pulsing consistently to approximately 500 mL with a distinct plateau indicating an end-inspiratory hold. The middle Pressure-time waveform illustrates critical respiratory parameters: a negative deflection reaching the trigger pressure (Ptrig) of -2 cmH2O initiates each breath, followed by a rapid rise to a peak inspiratory pressure (Ppeak) of ~25 cmH2O. An inspiratory hold reveals a plateau pressure (Pplateau) of ~22 cmH2O, with the cycle concluding at a positive end-expiratory pressure (PEEP) of ~5 cmH2O. The bottom Flow Rate graph displays corresponding inspiratory and expiratory flow pulses. Annotations mark key temporal points: initial inspiration (Ii), inspiratory hold (Ih), end-inspiration (Ei), and end-expiration (Ef). This visualization is essential for understanding ventilator-patient synchrony, mechanical lung properties (compliance and resistance), and the functioning of pressure-triggered assisted ventilation modes.
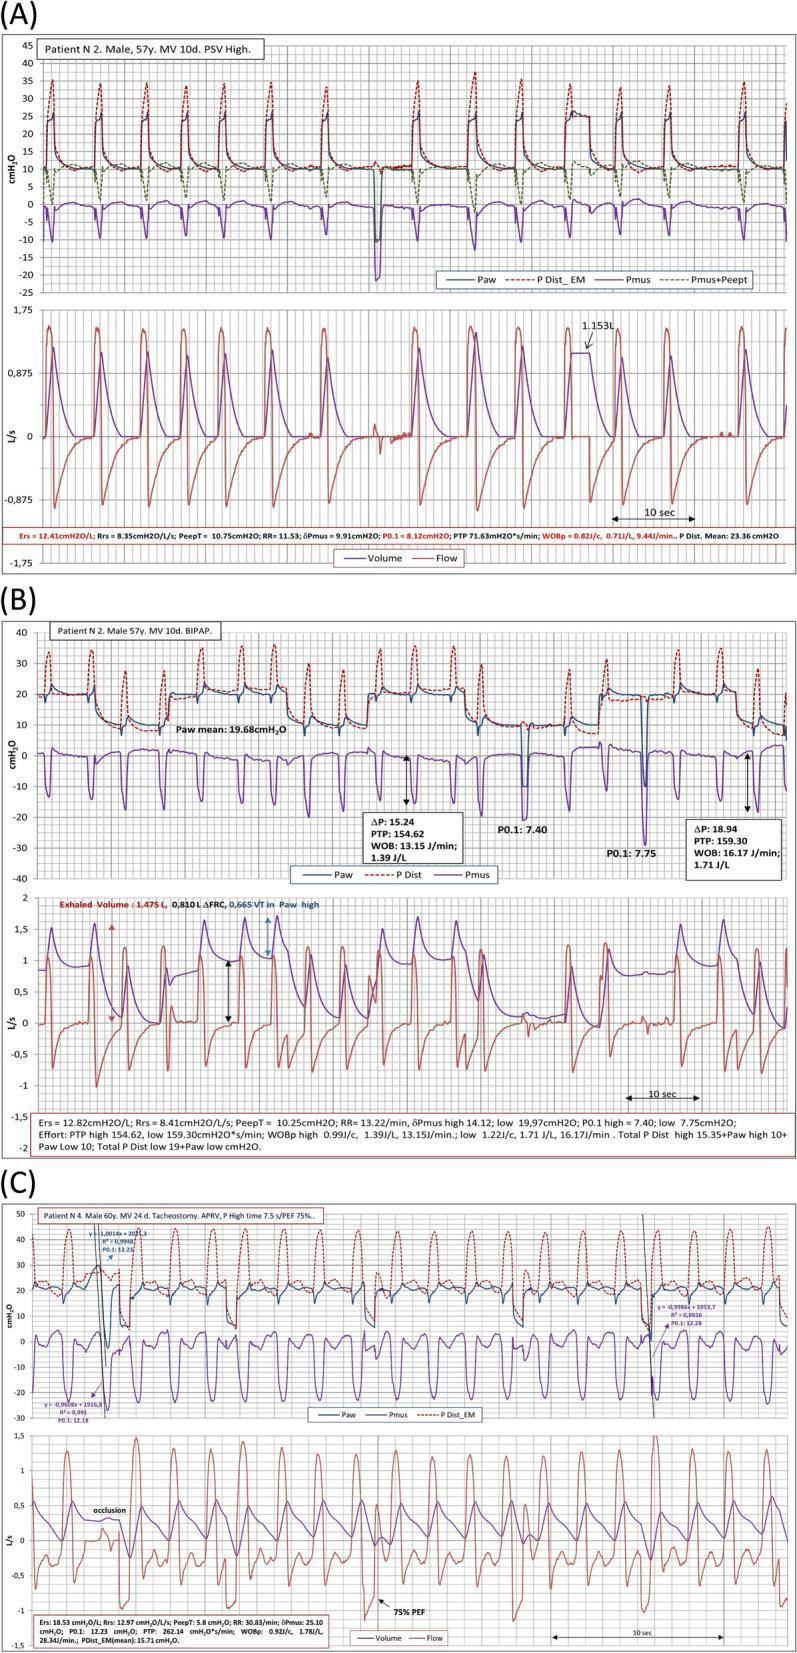
This physiological monitoring graphic displays mechanical ventilation waveforms across three distinct modes: Pressure Support Ventilation (PSV) in panel A, Biphasic Positive Airway Pressure (BIPAP) in panel B, and Airway Pressure Release Ventilation (APRV) in panel C. Each panel illustrates time-synced tracings of airway pressure (Paw), muscle pressure (Pmus), distending pressure (PDist_EM), flow (L/s), and tidal volume (L). In PSV (A), the waveforms show regular, patient-triggered breaths with stable tidal volumes and consistent Pmus deflections. BIPAP (B) reveals two levels of baseline pressure with significant spontaneous effort (negative Pmus) during the lower pressure phase, resulting in more variable flow and volume patterns. APRV (C) demonstrates prolonged high-pressure phases with brief releases, characterized by high respiratory drive and frequent, irregular spontaneous breathing efforts superimposed on the ventilator cycle. Key metrics provided below the graphs include respiratory system elastance (Ers), airway occlusion pressure (P0.1), and patient work of breathing (WOBp), used to analyze patient-ventilator synchrony and inspiratory effort in critically ill patients, such as those with COVID-19 ARDS.
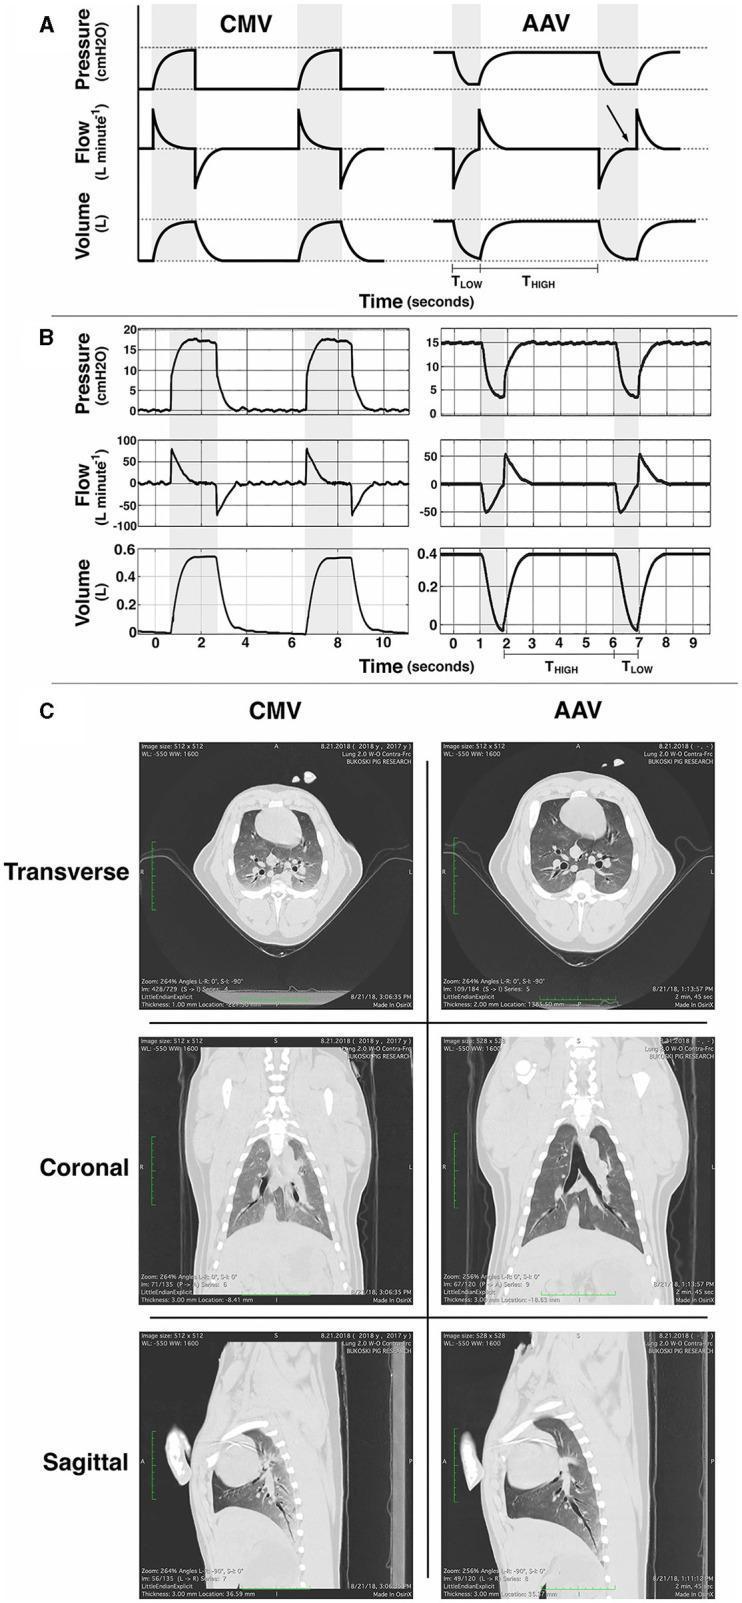
This multi-panel figure illustrates a comparative analysis of two mechanical ventilation modes: Conventional Mechanical Ventilation (CMV) and Apneustic Anesthesia Ventilation (AAV). Section A provides idealized schematic waveforms for pressure, flow, and volume over time. CMV is characterized by intermittent pressure increases from baseline, while AAV (similar to Airway Pressure Release Ventilation or APRV) maintains an elevated baseline pressure (PHIGH) for a prolonged duration (THIGH) with brief, rapid releases to a lower pressure (PLOW) during a shorter interval (TLOW). Section B displays corresponding real-time example waveforms, highlighting that AAV maintains higher lung volumes throughout the respiratory cycle. Section C presents thoracic computed tomography (CT) scans in transverse, coronal, and sagittal planes, comparing lung recruitment and aeration between modes. The AAV images demonstrate improved lung inflation and more uniform density across the parenchyma compared to CMV, where areas of increased dependent opacification suggest potential atelectasis. This resource is designed for critical care and anesthesia education, focusing on respiratory physiology, ventilator waveform analysis, and the impact of ventilation strategies on pulmonary recruitment.
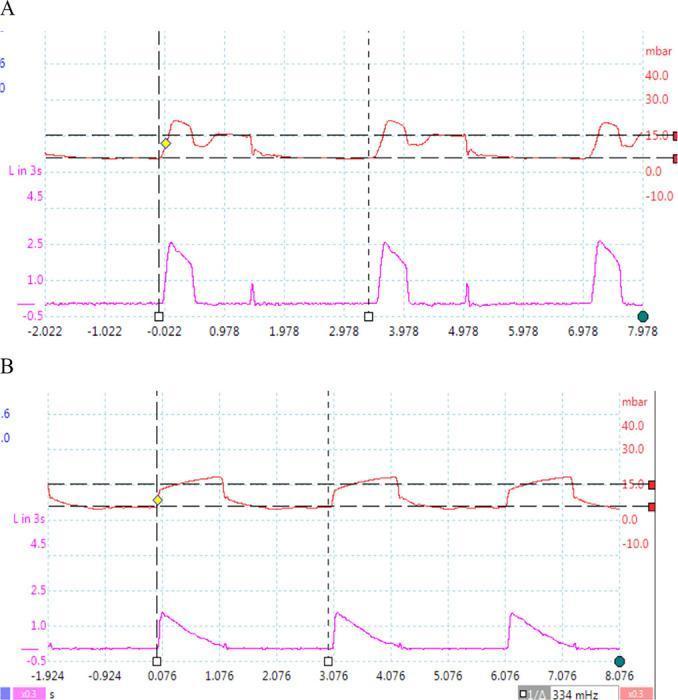
A comparison chart consisting of two sets of mechanical ventilation waveforms (pressure-time and flow-time curves) demonstrating different control variables. The upper panel (Ventilator 1) shows characteristics of volume-controlled ventilation, where the pressure curve (red) reaches a peak and then maintains a plateau, while the flow curve (purple) rises instantaneously and remains constant before falling, indicating a square flow waveform. The lower panel (Ventilator 2) illustrates pressure-controlled ventilation. In this mode, the pressure curve (red) rapidly rises to a set level (approximately 15 mbar) and maintains a plateau, while the flow curve (purple) shows a peak followed by a decelerating ramp pattern. Both panels show three respiratory cycles over an approximately 8-second window, with vertical dashed lines marking the start of inspiration. These waveforms are critical for respiratory therapy education to distinguish between volume-preset and pressure-preset mechanical ventilation strategies.
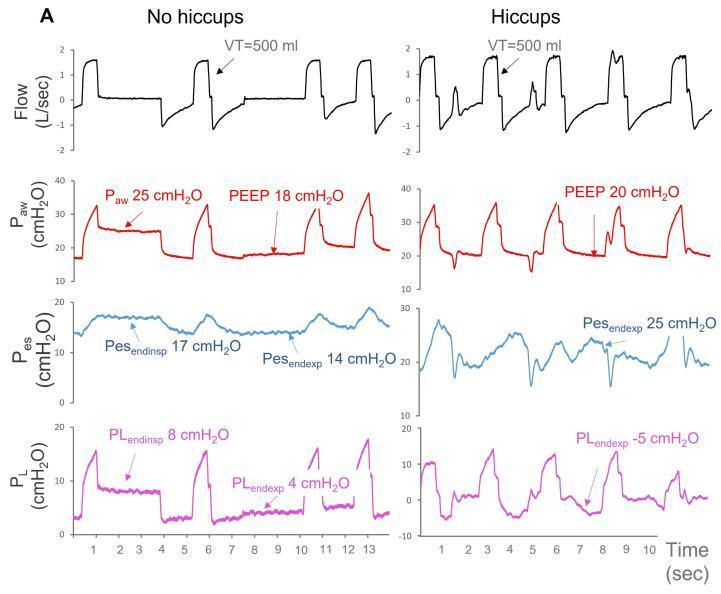
A multi-panel medical diagnostic graphic displaying mechanical ventilation waveforms over time (seconds) in a patient with volume-controlled ventilation (VCV). The image compares two clinical states: 'No hiccups' (left) and 'Hiccups' (right). Four synchronous traces are shown: Flow (L/sec), Airway Pressure (Paw, cmH2O), Esophageal Pressure (Pes, cmH2O), and Transpulmonary Pressure (PL, cmH2O). In the 'No hiccups' state, waveforms show regular patterns with a Paw of 25 cmH2O, PEEP of 18 cmH2O, and positive PL values (PLendinsp 8 cmH2O, PLendexp 4 cmH2O). In the 'Hiccups' state, following an increase in PEEP to 20 cmH2O, the waveforms exhibit significant patient-ventilator asynchrony. Notable features include erratic Pes fluctuations (Pesendexp 25 cmH2O) and sharp, irregular spikes in flow and airway pressure. Critically, the 'Hiccups' panel demonstrates a negative end-expiratory transpulmonary pressure (PLendexp -5 cmH2O), illustrating the physiological impact of involuntary diaphragmatic contractions on lung recruitment and ventilation stability.
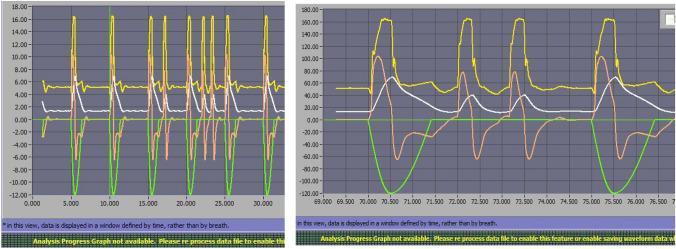
This diagnostic graphic displays mechanical ventilation waveforms from a Hamilton C3 ventilator during Pressure Support Ventilation (PSV 10), illustrating ventilator asynchrony under restrictive lung patterns with air leaks. Two side-by-side time-series graphs plot respiratory parameters: Airway Pressure (Paw, yellow), Delivered Volume (white), Flow (red/orange), and Muscular Pressure (green). The green line represents patient effort (negative deflection indicates inspiration), while the yellow and white lines represent ventilator response. The image specifically highlights 'Auto-triggering' (AT), a form of patient-ventilator asynchrony where the ventilator delivers a breath without an antecedent drop in muscular pressure. This is evident where peaks in airway pressure (yellow) and flow (red/orange) occur in the absence of a corresponding green negative deflection. The graph on the right provides a high-resolution view of these cycles, demonstrating the synchronization failure between the patient's intrinsic respiratory drive and the ventilator's trigger sensitivity (set at 1 lpm). This material is intended for advanced clinical education regarding mechanical ventilation monitoring and the identification of asynchronies in restrictive respiratory conditions.
![This Comparison Chart displays synchronized respiratory waveforms over 40 seconds during volume-controlled mechanical ventilation. From top to bottom, the four graphs include: 1) Flow [l/min], showing inspiratory and expiratory phases with zero-flow plateaus during maneuvers. 2) Airway pressure (Paw [cmH2O]), highlighting 'Set PEEP', 'PEEPtot' during an expiratory pause, and 'Airway plateau pressure' and 'Airway driving pressure' during an inspiratory hold. 3) Esophageal pressure (Pes [cmH2O]), used as a surrogate for pleural pressure, showing end-expiratory/end-inspiratory values and minor cardiac artifacts. 4) Transpulmonary pressure (Plung [cmH2O]), calculated as Paw minus Pes, illustrating 'Transpulmonary driving pressure' and 'End-inspiratory transpulmonary pressure'. The visual illustrates critical bedside monitoring for Acute Respiratory Distress Syndrome (ARDS), focusing on lung mechanics, intrinsic PEEP, and the prevention of ventilator-induced lung injury (VILI) by quantifying driving pressures and plateau pressures through hold maneuvers.](https://cdn.orris.care/cdss_images/pmc_clinical_VQA_1099345286f128aad8b7d3b682adc5a15737e3b737170091be774aed96d94975.jpg)
This Comparison Chart displays synchronized respiratory waveforms over 40 seconds during volume-controlled mechanical ventilation. From top to bottom, the four graphs include: 1) Flow [l/min], showing inspiratory and expiratory phases with zero-flow plateaus during maneuvers. 2) Airway pressure (Paw [cmH2O]), highlighting 'Set PEEP', 'PEEPtot' during an expiratory pause, and 'Airway plateau pressure' and 'Airway driving pressure' during an inspiratory hold. 3) Esophageal pressure (Pes [cmH2O]), used as a surrogate for pleural pressure, showing end-expiratory/end-inspiratory values and minor cardiac artifacts. 4) Transpulmonary pressure (Plung [cmH2O]), calculated as Paw minus Pes, illustrating 'Transpulmonary driving pressure' and 'End-inspiratory transpulmonary pressure'. The visual illustrates critical bedside monitoring for Acute Respiratory Distress Syndrome (ARDS), focusing on lung mechanics, intrinsic PEEP, and the prevention of ventilator-induced lung injury (VILI) by quantifying driving pressures and plateau pressures through hold maneuvers.
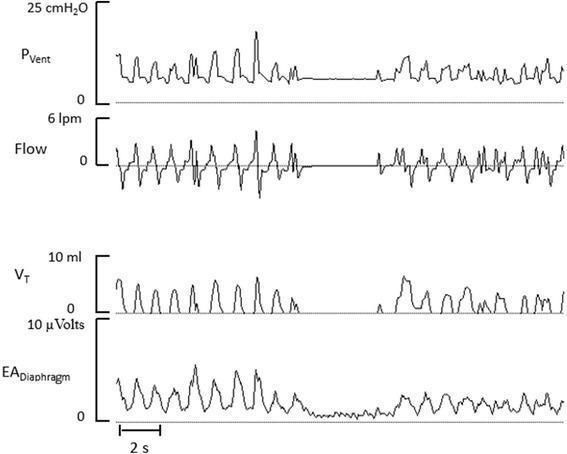
A multi-panel respiratory waveform tracing illustrating Neurally Adjusted Ventilatory Assist (NAVA) in a premature infant. The image displays four vertically stacked waveforms over time: ventilator pressure (PVent, 0–25 cmH2O), flow (0–6 lpm), tidal volume (VT, 0–10 ml), and diaphragmatic electrical activity (EADiaphragm, 0–10 μVolts). The tracings demonstrate a proportional relationship where the ventilator pressure dynamically adjusts to match the magnitude and timing of the EADiaphragm signals, reflecting the patient's spontaneous neural respiratory drive. During inspiration, a rise in EADiaphragm triggers a corresponding increase in PVent, flow, and VT. Conversely, a breathing pause is clearly visible in the middle of the tracing, where the absence of diaphragmatic electrical activity results in a cessation of ventilator pressure delivery. This clinical diagnostic image serves as an educational example of advanced neonatal synchronization and patient-triggered ventilation modes, highlighting how physiological feedback can be used to coordinate mechanical support with intrinsic respiratory effort.
ventilator weaning SBT spontaneous breathing trial extubation criteria
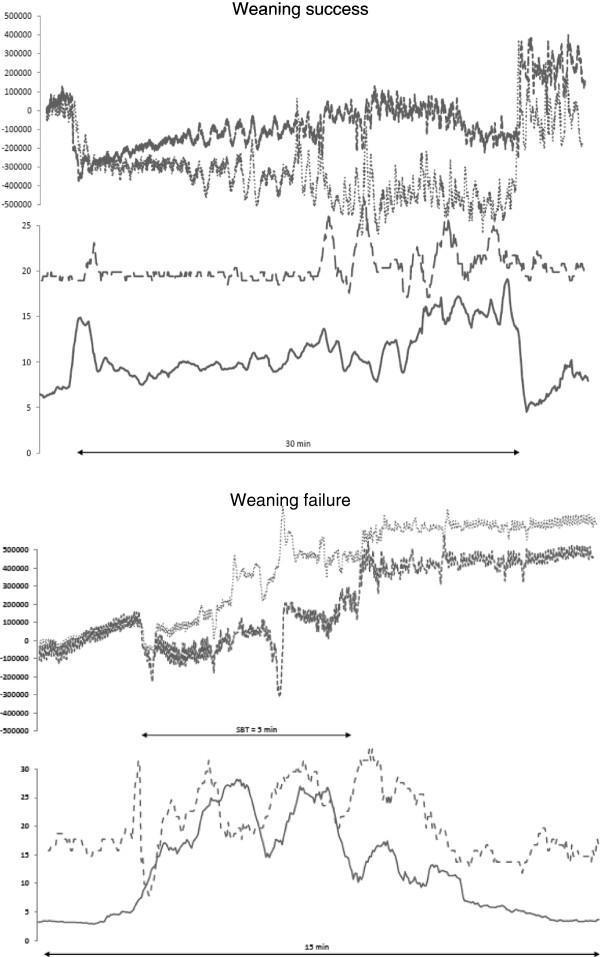
This comparison chart displays physiological waveforms from two patients undergoing a spontaneous breathing trial (SBT) for mechanical ventilation weaning: one who succeeds (top panel) and one who fails (bottom panel). For each patient, three primary respiratory metrics are plotted over time (x-axis): respiratory inductive plethysmography (RIP) tracing thoracic (fine dots) and abdominal (bold dots) bands, respiratory rate (dashed line), and the electrical activity of the diaphragm (EAdimax, solid line). In the weaning success patient, EAdimax and respiratory rate remain relatively stable throughout the 30-minute trial. In contrast, the weaning failure patient exhibits a steep, immediate increase in EAdimax and rapid fluctuations in respiratory rate upon disconnection from the ventilator, leading to trial termination after only 5 minutes. The RIP tracings for the failure patient show more pronounced and rapid oscillations in thoracic and abdominal movement, indicating increased work of breathing and potential recruitment of accessory muscles. This clinical graphic illustrates the use of diaphragmatic electromyography and plethysmography as diagnostic tools to monitor inspiratory effort and predict weaning outcomes in intensive care settings.
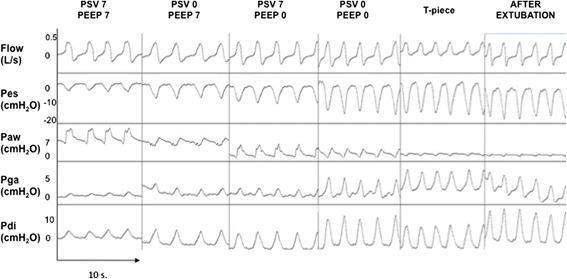
A comparative clinical physiological tracing showing the ventilatory patterns of a single patient across five different weaning tests (PSV 7/PEEP 7, PSV 0/PEEP 7, PSV 7/PEEP 0, PSV 0/PEEP 0, and T-piece) and 20 minutes post-extubation. The graphic displays six panels of continuous physiological data: Flow (L/s), Esophageal Pressure (Pes, cmH2O), Airway Pressure (Paw, cmH2O), Gastric Pressure (Pga, cmH2O), and Trans-diaphragmatic Pressure (Pdi, cmH2O). The tracings illustrate progressive changes in respiratory mechanics and effort. As pressure support ventilation (PSV) and positive end-expiratory pressure (PEEP) are reduced, there is a visible increase in the amplitude of negative Pes swings and positive Pdi swings, signifying increased inspiratory muscle effort and work of breathing (WOB). The PSV 0/PEEP 0 and T-piece trials most closely mirror the physiological effort observed in the 'After Extubation' state. This diagnostic diagram is used in intensive care medicine to evaluate spontaneous breathing trial (SBT) modalities and predict extubation success in mechanically ventilated patients.
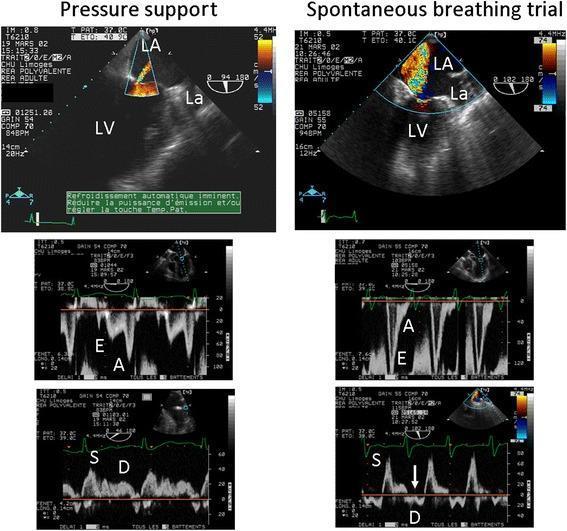
This diagnostic image set displays a side-by-side comparison of transesophageal echocardiography (TEE) findings in a patient with ischemic cardiomyopathy during ventilator weaning. The panels contrast 'Pressure support' (left column) with a 'Spontaneous breathing trial' (right column). Top row: Color Doppler in a two-chamber view assesses mitral regurgitation (MR). Under pressure support, MR is trivial; during the spontaneous breathing trial, severe MR is visible as a large, turbulent systolic jet filling the left atrium (LA). Middle row: Pulsed-wave Doppler of mitral inflow. The pressure support state shows an impaired relaxation pattern (E < A), indicating low filling pressures. The spontaneous breathing trial shows a restrictive filling pattern (E > A), indicating a sharp rise in left ventricular (LV) filling pressures. Bottom row: Pulmonary vein Doppler. Pressure support shows a normal systolic-dominant flow (S wave > D wave). The spontaneous breathing trial reveals a reversed D wave (indicated by the arrow), a hallmark of massive mitral insufficiency and elevated left-sided pressures. This visual series demonstrates weaning-induced cardiac dysfunction secondary to acute ischemic mitral regurgitation.
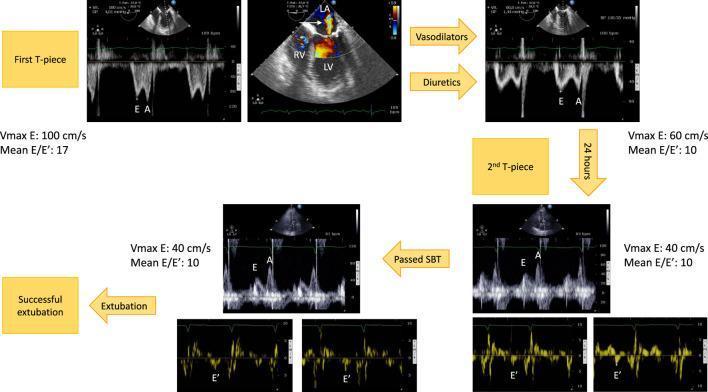
This composite diagnostic image illustrates hemodynamic monitoring using transesophageal echocardiography (TEE) to manage weaning-induced pulmonary edema (WIPO) in a patient with ischemic heart disease. The figure follows a clinical progression from a failed 'First T-piece' trial to 'Successful extubation'. Key visual components include: 1) Pulsed-wave mitral Doppler tracings showing E and A waves, 2) Tissue Doppler imaging (TDI) showing E' waves, and 3) Color Doppler of the mitral valve. In the initial phase, elevated LV filling pressures are evidenced by a Vmax E of 100 cm/s and a mean E/E' ratio of 17, alongside mild functional mitral regurgitation (labeled LA, RV, LV with a white arrow). Following pharmacological intervention with vasodilators and diuretics, subsequent panels demonstrate a therapeutic response: Vmax E decreases to 60 cm/s and eventually 40 cm/s, with the mean E/E' ratio stabilizing at 10. These echocardiographic markers indicate a reduction in LV filling pressure and successful normalization of hemodynamics, which facilitated a successful second spontaneous breathing trial (SBT) and extubation. This figure serves as an educational guide for using TEE to tailor therapy for difficult-to-wean ventilated patients.
modes of mechanical ventilation AC CMV SIMV pressure support volume control
This multi-panel figure illustrates a comparative analysis of two mechanical ventilation modes: Conventional Mechanical Ventilation (CMV) and Apneustic Anesthesia Ventilation (AAV). Section A provides idealized schematic waveforms for pressure, flow, and volume over time. CMV is characterized by intermittent pressure increases from baseline, while AAV (similar to Airway Pressure Release Ventilation or APRV) maintains an elevated baseline pressure (PHIGH) for a prolonged duration (THIGH) with brief, rapid releases to a lower pressure (PLOW) during a shorter interval (TLOW). Section B displays corresponding real-time example waveforms, highlighting that AAV maintains higher lung volumes throughout the respiratory cycle. Section C presents thoracic computed tomography (CT) scans in transverse, coronal, and sagittal planes, comparing lung recruitment and aeration between modes. The AAV images demonstrate improved lung inflation and more uniform density across the parenchyma compared to CMV, where areas of increased dependent opacification suggest potential atelectasis. This resource is designed for critical care and anesthesia education, focusing on respiratory physiology, ventilator waveform analysis, and the impact of ventilation strategies on pulmonary recruitment.
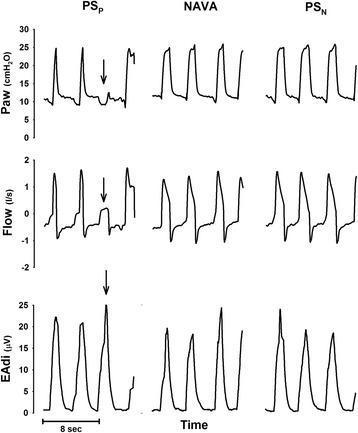
This physiological tracing compares three mechanical ventilation modes in a human patient: pneumatically triggered pressure support (PSP), neurally adjusted ventilatory assist (NAVA), and neurally controlled pressure support (PSN). The data is organized in a 3x3 grid across columns (modes) and rows (parameters). The vertical axes measure airway pressure (Paw in cmH2O), respiratory flow (l/s), and electrical activity of the diaphragm (EAdi in μV) as a function of time. In the PSP column, an arrow identifies an 'ineffective effort' where a significant spike in EAdi (diaphragmatic contraction) fails to trigger a corresponding ventilator-supported airway pressure rise, demonstrating patient-ventilator asynchrony. In contrast, the NAVA and PSN columns show improved synchrony, where neural signals (EAdi) directly correlate with the onset of pressure delivery. PSN shows a more rapid pressurization profile compared to the proportional ramp-up seen in NAVA. This comparison illustrates how neural-based triggering and control mechanisms can mitigate triggering delays and missed efforts common in traditional pneumatic pressure support.
This physiological monitoring graphic displays mechanical ventilation waveforms across three distinct modes: Pressure Support Ventilation (PSV) in panel A, Biphasic Positive Airway Pressure (BIPAP) in panel B, and Airway Pressure Release Ventilation (APRV) in panel C. Each panel illustrates time-synced tracings of airway pressure (Paw), muscle pressure (Pmus), distending pressure (PDist_EM), flow (L/s), and tidal volume (L). In PSV (A), the waveforms show regular, patient-triggered breaths with stable tidal volumes and consistent Pmus deflections. BIPAP (B) reveals two levels of baseline pressure with significant spontaneous effort (negative Pmus) during the lower pressure phase, resulting in more variable flow and volume patterns. APRV (C) demonstrates prolonged high-pressure phases with brief releases, characterized by high respiratory drive and frequent, irregular spontaneous breathing efforts superimposed on the ventilator cycle. Key metrics provided below the graphs include respiratory system elastance (Ers), airway occlusion pressure (P0.1), and patient work of breathing (WOBp), used to analyze patient-ventilator synchrony and inspiratory effort in critically ill patients, such as those with COVID-19 ARDS.
A comparison chart consisting of two sets of mechanical ventilation waveforms (pressure-time and flow-time curves) demonstrating different control variables. The upper panel (Ventilator 1) shows characteristics of volume-controlled ventilation, where the pressure curve (red) reaches a peak and then maintains a plateau, while the flow curve (purple) rises instantaneously and remains constant before falling, indicating a square flow waveform. The lower panel (Ventilator 2) illustrates pressure-controlled ventilation. In this mode, the pressure curve (red) rapidly rises to a set level (approximately 15 mbar) and maintains a plateau, while the flow curve (purple) shows a peak followed by a decelerating ramp pattern. Both panels show three respiratory cycles over an approximately 8-second window, with vertical dashed lines marking the start of inspiration. These waveforms are critical for respiratory therapy education to distinguish between volume-preset and pressure-preset mechanical ventilation strategies.
PEEP positive end expiratory pressure lung recruitment ventilator settings
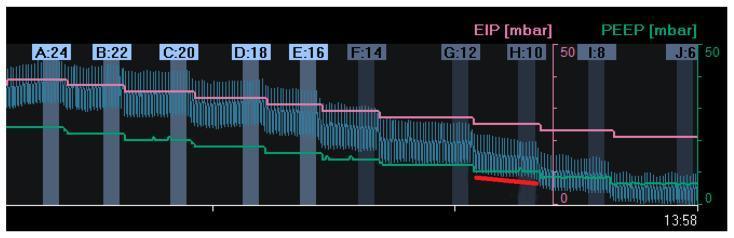
This diagnostic image displays a waveform graph from a decremental Positive End-Expiratory Pressure (PEEP) trial, used in critical care and respiratory medicine to optimize mechanical ventilation. The visualization monitors three primary variables over time, marked from segments A to J: end-inspiratory pressure (EIP, pink line), end-expiratory lung impedance (EELI, green line), and global lung impedance change (blue oscillating waveform). The x-axis represents a stepwise reduction in PEEP from 24 mbar (A) down to 6 mbar (J). A corresponding stepwise decrease is visible in the EIP and EELI, reflecting changes in lung volume. At a PEEP of 10 mbar (H), a red trend line highlights a gradual decline in the EELI waveform, indicating alveolar derecruitment despite constant pressure. This comparison chart is a key tool in Electrical Impedance Tomography (EIT) for identifying the 'best PEEP'—the level that maintains lung recruitment while avoiding overdistension. The educational focus is on identifying the point of lung collapse during ventilator weaning or ARDS management.
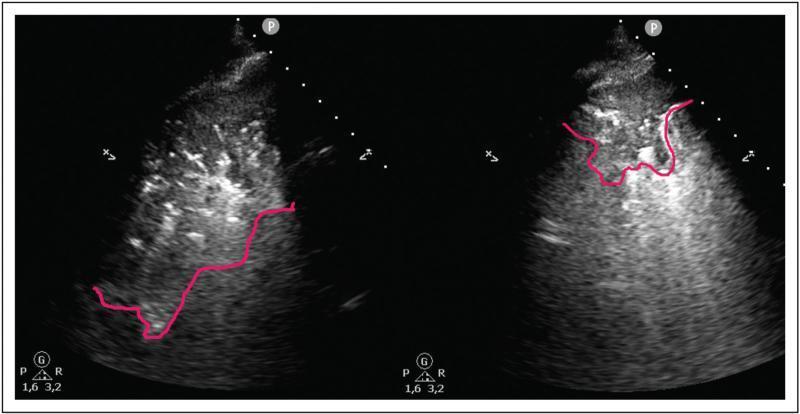
This dual-panel diagnostic lung ultrasound illustrates the effect of Positive End-Expiratory Pressure (PEEP) on pulmonary recruitment and reaeration. Both images demonstrate localized lung consolidation, indicated by red outline markers. In the left panel (PEEP 5), a larger area of tissue-like echogenicity is visible, characterized by a heterogeneous, 'hepatized' appearance with dynamic air bronchograms, signifying significant loss of aeration. Outside the consolidated boundary, horizontal hyperechoic A-lines suggest aerated lung. The right panel (PEEP 15) shows a marked reduction in the size of the consolidated region following the increase in PEEP. This visual change represents recruitment of previously collapsed alveoli and an improved fluid-to-gas ratio within the lung parenchyma. The decrease in the C-pattern (consolidation) and the prevalence of A-lines in the surrounding tissue correlate with improved clinical aeration scores. This comparison is a key educational tool for critical care medicine, demonstrating the utility of point-of-care ultrasound (POCUS) in monitoring ventilator adjustments and managing conditions like ARDS or pneumonia.
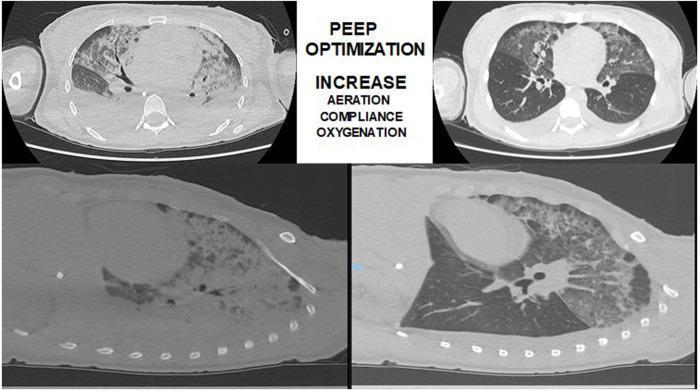
This diagnostic image displays four panels of thoracic computed tomography (CT) scans in axial and sagittal views, illustrating lung recruitment and Positive End-Expiratory Pressure (PEEP) titration in a patient with Acute Respiratory Distress Syndrome (ARDS). The left-side panels show initial scans with extensive bilateral opacities, including heterogeneous ground-glass appearance and dense consolidation in the dependent lung regions, characteristic of pulmonary edema and alveolar collapse. The right-side panels demonstrate the clinical effect of PEEP optimization, showing significant recruitment of lung parenchyma. This is evidenced by increased aeration and a reduction in consolidated areas, though residual ground-glass opacities and air bronchograms remain visible in the posterior segments. The center text highlights the educational goals of PEEP titration: increasing aeration, compliance, and oxygenation. The image serves as a comparison chart between baseline respiratory failure and the post-intervention state, demonstrating the use of CT imaging for real-time monitoring of ventilatory strategies in critical care settings.
ventilator asynchrony auto-PEEP intrinsic PEEP waveform pattern
This diagnostic graphic displays mechanical ventilation waveforms from a Hamilton C3 ventilator during Pressure Support Ventilation (PSV 10), illustrating ventilator asynchrony under restrictive lung patterns with air leaks. Two side-by-side time-series graphs plot respiratory parameters: Airway Pressure (Paw, yellow), Delivered Volume (white), Flow (red/orange), and Muscular Pressure (green). The green line represents patient effort (negative deflection indicates inspiration), while the yellow and white lines represent ventilator response. The image specifically highlights 'Auto-triggering' (AT), a form of patient-ventilator asynchrony where the ventilator delivers a breath without an antecedent drop in muscular pressure. This is evident where peaks in airway pressure (yellow) and flow (red/orange) occur in the absence of a corresponding green negative deflection. The graph on the right provides a high-resolution view of these cycles, demonstrating the synchronization failure between the patient's intrinsic respiratory drive and the ventilator's trigger sensitivity (set at 1 lpm). This material is intended for advanced clinical education regarding mechanical ventilation monitoring and the identification of asynchronies in restrictive respiratory conditions.
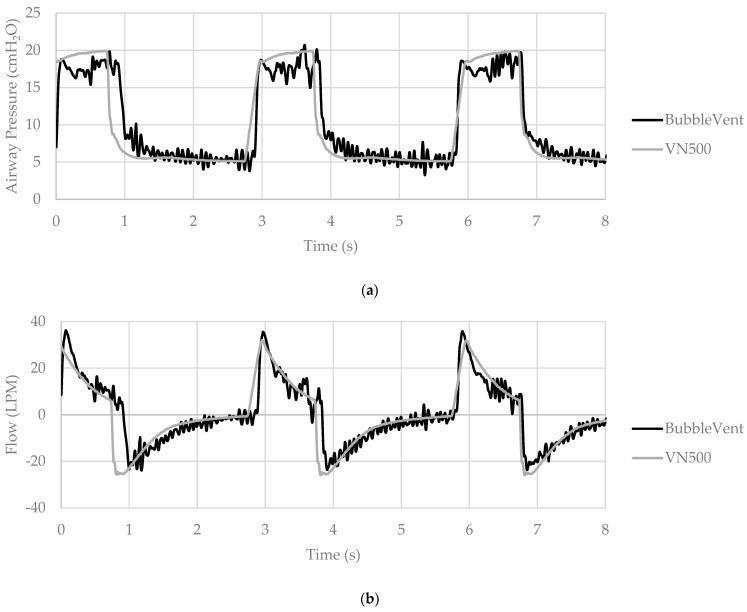
Two comparative waveform tracings (a and b) illustrate mechanical ventilation parameters over an 8-second interval, comparing a BubbleVent prototype (black line) with a Draeger VN500 clinical ventilator (gray line). Graph (a) depicts Airway Pressure (cmH2O) vs. Time (s). It shows periodic breath cycles with a Peak Inspiratory Pressure (PIP) of ~20 cmH2O and Positive End-Expiratory Pressure (PEEP) of ~5 cmH2O. The BubbleVent tracing exhibits characteristic high-frequency oscillations during the plateau and expiratory phases, likely due to gas bubbling through water, whereas the VN500 shows smooth transitions. Graph (b) depicts Inspiratory Flow (LPM) vs. Time (s). The BubbleVent demonstrates a more abrupt, square-like flow pattern reaching peak inspiratory flows of ~35-40 LPM, followed by sharp expiratory transitions to negative flow. The VN500 displays a smoother, more sinusoidal flow profile peaking at ~25 LPM. These waveforms demonstrate the performance of a hydropneumatic pressure-limited intermittent mandatory ventilation (IMV) system compared to standard microprocessor-controlled critical care ventilation in a lung model simulating ARDS conditions.
This diagnostic image displays a waveform graph from a decremental Positive End-Expiratory Pressure (PEEP) trial, used in critical care and respiratory medicine to optimize mechanical ventilation. The visualization monitors three primary variables over time, marked from segments A to J: end-inspiratory pressure (EIP, pink line), end-expiratory lung impedance (EELI, green line), and global lung impedance change (blue oscillating waveform). The x-axis represents a stepwise reduction in PEEP from 24 mbar (A) down to 6 mbar (J). A corresponding stepwise decrease is visible in the EIP and EELI, reflecting changes in lung volume. At a PEEP of 10 mbar (H), a red trend line highlights a gradual decline in the EELI waveform, indicating alveolar derecruitment despite constant pressure. This comparison chart is a key tool in Electrical Impedance Tomography (EIT) for identifying the 'best PEEP'—the level that maintains lung recruitment while avoiding overdistension. The educational focus is on identifying the point of lung collapse during ventilator weaning or ARDS management.
🫁 MECHANICAL VENTILATION - Complete Guide
PART 1: WHAT IS MECHANICAL VENTILATION AND WHY DO WE USE IT?
- Positive-pressure ventilation (PPV) - pushes air IN through a tube (universal in ICU/OR)
- Negative-pressure ventilation (iron lung) - creates negative pressure outside the chest to pull air in (historical, rarely used)
PART 2: INDICATIONS (When Do We Use It?)
A. Ventilatory Failure (Can't breathe out CO2)
| Criterion | Threshold |
|---|---|
| PaCO2 | > 50 mmHg (without metabolic alkalosis) |
| Respiratory rate | > 35 breaths/min |
| Tidal volume | < 5 mL/kg |
| Vital capacity | < 15 mL/kg |
| Max inspiratory force | > -25 cmH2O (e.g., only -15 cmH2O) |
B. Hypoxemic Failure (Can't get O2 in)
| Criterion | Threshold |
|---|---|
| PaO2 | < 50 mmHg on room air |
| PaO2/FiO2 ratio | < 300 mmHg |
| PA-aO2 gradient | > 350 mmHg |
| Dead space (VD/VT) | > 0.6 |
C. Clinical Indications
- Coma, GCS < 8, airway protection failure
- Cardiac or respiratory arrest
- Severe ARDS, pneumonia, pulmonary edema
- Refractory status asthmaticus
- Neuromuscular disorders (GBS, myasthenia crisis)
- Major surgery / general anesthesia
- Severe shock (to reduce O2 cost of breathing)
- Acute exacerbation of COPD/asthma failing NIV
Source: Morgan & Mikhail's Clinical Anesthesiology, p. 2519
PART 3: VENTILATOR SETTINGS (The "Dials")
1. Tidal Volume (VT)
- Volume of each breath
- Normal: 6-8 mL/kg IBW (ideal body weight)
- Lung-protective: 6 mL/kg IBW in ARDS
- Higher volumes = barotrauma/volutrauma risk
2. Respiratory Rate (RR / f)
- Number of breaths per minute
- Typical: 12-20 breaths/min
- Low rate (< 10) used in obstructive disease (COPD/asthma) to allow full expiration
3. FiO2 (Fraction of Inspired Oxygen)
- 0.21 = room air, 1.0 = 100% O2
- Start at 1.0 for emergency, then titrate down
- Target: SpO2 > 94% (or > 88% in COPD) with FiO2 < 0.6 (to avoid O2 toxicity)
4. PEEP (Positive End-Expiratory Pressure)
- Pressure kept in lungs at the END of each breath (keeps alveoli open)
- Typical starting: 5 cmH2O (physiological)
- Higher PEEP (8-20) used in ARDS to recruit alveoli
- Prevents alveolar collapse and atelectasis
5. Inspiratory Flow Rate
- How fast air is delivered
- Typical: 40-80 L/min
- High flow in obstructive disease allows longer expiratory time
6. I:E Ratio (Inspiratory : Expiratory)
- Normal: 1:2 (inspiration takes half the time of expiration)
- Obstructive disease (COPD/asthma): 1:3 or 1:4 (more time to breathe out)
- Inverse ratio (2:1) in ARDS to improve oxygenation (but needs deep sedation)
7. Trigger Sensitivity
- How much effort the patient needs to "request" a breath
- Pressure trigger: -1 to -2 cmH2O
- Flow trigger: 1-3 L/min (more sensitive, less patient effort)
8. Pressure Limits / Alarms
- Peak inspiratory pressure (PIP): pressure needed to push air in
- Plateau pressure (Pplat): pressure at end of inspiration (reflects compliance)
- Target Pplat < 30 cmH2O to prevent barotrauma
- Driving pressure = Pplat - PEEP (target < 15 cmH2O in ARDS)
PART 4: MODES OF MECHANICAL VENTILATION
| Concept | Pressure-Controlled (PC) | Volume-Controlled (VC) |
|---|---|---|
| What's set? | Pressure level | Volume (VT) |
| What varies? | Volume (depends on compliance) | Pressure (depends on compliance) |
| Flow pattern | Decelerating | Square (constant) |
| Risk | Volume too low if compliance drops | Pressure too high if compliance drops |
MODE 1: Volume-Controlled CMV (VC-CMV) / Controlled Mandatory Ventilation
- Machine controls everything
- Patient gets exactly set VT at set rate
- No patient effort allowed (need sedation ± paralysis if patient is awake)
- Flow: Square (constant flow)
- Pressure: Rises gradually then peaks
- Volume: Ramps up linearly
MODE 2: Assist-Control Ventilation (AC / VC-CMV with triggering)
- A backup rate is set (e.g., 12 breaths/min)
- If patient triggers, they get full set VT
- If patient doesn't trigger, machine delivers at backup rate
- Risk: If patient triggers rapidly, can cause hyperventilation and respiratory alkalosis
MODE 3: SIMV (Synchronized Intermittent Mandatory Ventilation)
- Mandatory breaths: delivered at set rate, set VT
- Spontaneous breaths: patient breathes on their own with no support (unless PSV added)
- "Synchronized" = machine waits for patient's effort to deliver mandatory breath
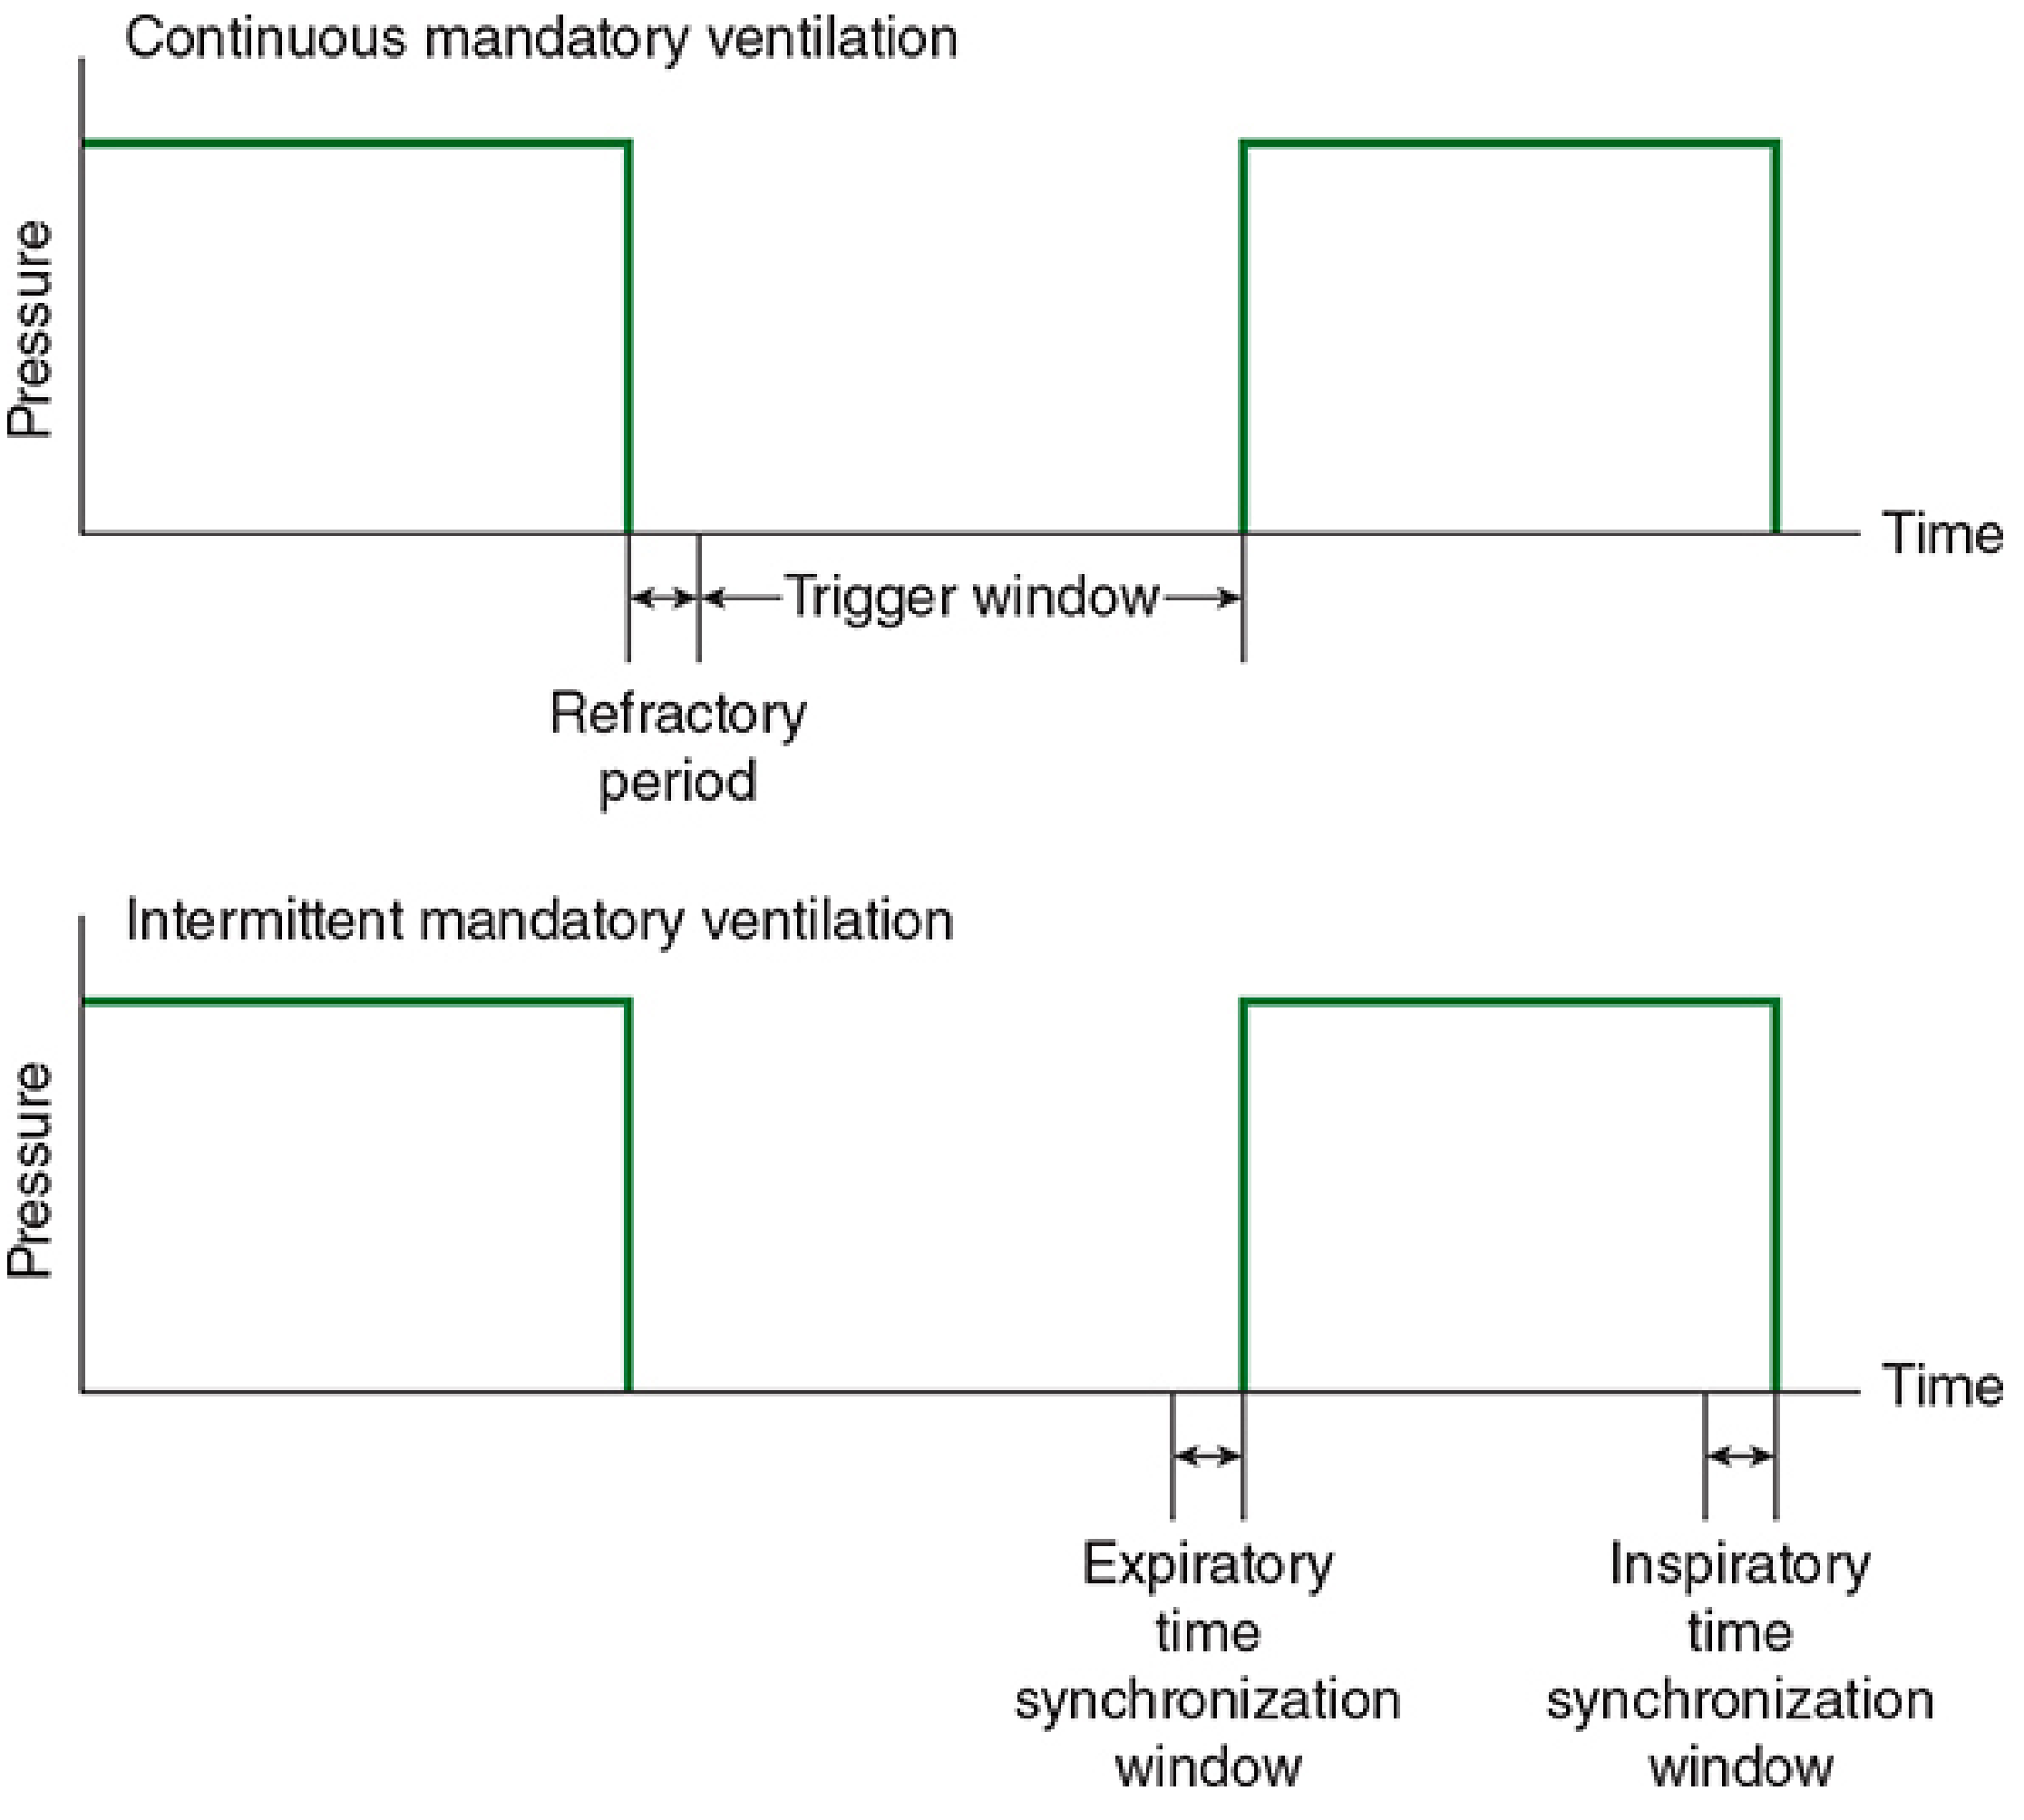
MODE 4: Pressure Support Ventilation (PSV / PC-CSV)
- Set a pressure level (e.g., PS 10 cmH2O = pressure support of 10 above PEEP)
- Patient triggers, machine pressurizes to set level
- Inspiration ends when flow drops to ~25% of peak flow (flow-cycled)
- No backup rate - if patient stops breathing, no breath delivered!
- Weaning (progressively reduce PS level)
- Spontaneously breathing patients who need a little help
- CPAP + PSV = common weaning combo
MODE 5: Pressure-Controlled Ventilation (PCV / PC-CMV)
- Set: pressure level, rate, inspiratory time
- Flow: naturally decelerating (fast at first, then slows as pressure equilibrates)
- VT is NOT guaranteed - if compliance drops, VT falls
- Provides better gas distribution than volume control
MODE 6: CPAP (Continuous Positive Airway Pressure)
- No ventilator-delivered breaths
- Just keeps airway pressure elevated (e.g., 5-10 cmH2O)
- Increases FRC (functional residual capacity), recruits alveoli
- Safe limit for mask CPAP: < 15 cmH2O (above this, needs ETT)
- Mild-moderate respiratory failure
- OSA (obstructive sleep apnea)
- Pulmonary edema
- Trial before extubation
MODE 7: BIPAP / BiPAP (Bilevel Positive Airway Pressure)
- IPAP = Inspiratory Positive Airway Pressure (like pressure support)
- EPAP = Expiratory Positive Airway Pressure (like PEEP)
MODE 8: APRV (Airway Pressure Release Ventilation)
| Parameter | Typical Value |
|---|---|
| PHigh | 25-35 cmH2O |
| PLow | 0-5 cmH2O |
| THigh | 4-6 seconds |
| TLow | 0.4-0.8 seconds |
PART 5: VENTILATOR WAVEFORMS - How to Read Them
- Pressure-time (P-t) - airway pressure vs time
- Flow-time (F-t) - gas flow vs time (positive = inspiration, negative = expiration)
- Volume-time (V-t) - accumulated volume vs time
The Classic Waveform Set (VCV - Volume Control):
| Waveform Feature | What It Tells You |
|---|---|
| Ppeak (peak pressure) | Combines resistance + compliance |
| Pplat (plateau pressure, after inspiratory hold) | Compliance only (should be < 30) |
| Ppeak - Pplat | Resistance (should be < 10 cmH2O) |
| PEEP | Baseline end-expiratory pressure |
| Driving pressure (Pplat - PEEP) | Alveolar stress - target < 15 |
| Square flow on F-t graph | Volume control mode |
| Decelerating flow on F-t graph | Pressure control mode |
VCV Waveform - Normal
PRESSURE:     ___________
             /           \
            /             \  PEEP level
___________/               \__________

FLOW:        _______
            |       |
            |       |
---         |       |___________
(insp)      (expir, negative flow)

VOLUME:          /|
                / |
               /  |
______________/   |_______________
PCV Waveform - Normal
PRESSURE:    _____________
            |             |
            |             |
____________|             |______PEEP

FLOW:        |\
             | \
             |  \
---          |   \________
(decelerating - fast then slow)
Waveform Abnormalities - What to Look For:
1. Increased Airway Resistance
- Ppeak rises, Pplat stays same (Ppeak - Pplat increases > 10)
- Cause: bronchospasm, secretions, kinked tube
- Flow waveform: "shark fin" pattern or prolonged expiration
2. Decreased Compliance
- Both Ppeak AND Pplat rise
- Cause: pneumothorax, ARDS, pulmonary edema, auto-PEEP
- Volume-time: lower delivered VT if pressure-limited
3. Auto-PEEP (Intrinsic PEEP)
- Flow fails to return to zero before next breath begins on the F-t curve
- Expiratory flow graph: flow is still going when the next breath starts
- Cause: obstructive disease, high RR, short expiratory time
- Risk: gas trapping, hyperinflation, hemodynamic compromise
4. Patient-Ventilator Asynchrony
- Waveform abnormalities: "scooping" of the pressure-time curve (patient trying to breathe in while machine gives breath), double triggering, ineffective efforts
- Flow spikes during pressure support expiratory phase
PART 6: SPECIAL WAVEFORMS BY MODE
Pressure Support Ventilation (PSV) Waveform
- Pressure-time: Rises quickly to set PS level, stays flat, drops at end of breath
- Flow-time: Decelerating (starts fast, slows down); cycling occurs at 25% of peak flow
- Volume: Varies breath to breath (patient determines depth)
SIMV Waveform
- Mandatory breaths: look like AC breaths (full-size, full pressure)
- Spontaneous breaths between: SMALLER, lower pressure
- Alternating large and small breaths on volume-time curve
APRV Waveform
- Pressure-time: HIGH plateau for long THigh, brief rapid drop to PLow, then back up
- Like a "reverse PEEP" pattern - high level maintained with brief releases
NAVA (Neurally Adjusted Ventilatory Assist) Waveform
- Ventilator pressure is PROPORTIONAL to the electrical activity of the diaphragm (EAdi)
- Best patient-ventilator synchrony possible
PART 7: MONITORING DURING MECHANICAL VENTILATION
| Parameter | What to Check | Why |
|---|---|---|
| Ppeak | < 40 cmH2O | Barotrauma risk |
| Pplat | < 30 cmH2O | Volutrauma risk |
| Driving pressure | < 15 cmH2O | Lung stress |
| PEEP | Appropriate level | Oxygenation |
| VT delivered | 6-8 mL/kg IBW | Lung protection |
| SpO2 | > 94% (or > 88% COPD) | Oxygenation |
| EtCO2 | 35-45 mmHg | Ventilation |
| ABG | pH, PaO2, PaCO2 | Overall assessment |
| Chest X-ray | ETT position, pneumothorax | Tube position, complications |
- Sudden rise in Ppeak + hypotension = pneumothorax until proven otherwise
- Rising Ppeak, falling exhaled VT = mucous plug/secretions
- Rising Pplat = worsening compliance (ARDS, atelectasis, pneumothorax)
PART 8: LUNG PROTECTIVE VENTILATION (for ARDS)
| Parameter | Target |
|---|---|
| VT | 6 mL/kg IBW (max 8) |
| Pplat | < 30 cmH2O |
| PEEP | Titrated to oxygenation (use FiO2-PEEP table) |
| RR | Up to 35 to maintain pH > 7.30 |
| FiO2 | Titrate to SpO2 88-95% |
PART 9: HOW TO WEAN AND STOP MECHANICAL VENTILATION
Step 1: Readiness Assessment (Daily)
| Criterion | Target for Readiness |
|---|---|
| Oxygenation | PaO2/FiO2 > 150-200 on PEEP ≤ 8, FiO2 ≤ 0.40-0.50 |
| Hemodynamics | No vasopressors (or low-dose, stable) |
| Neurological | Patient arousable, follows simple commands |
| Secretions | Patient can cough, not excessive secretions |
| Acid-base | pH > 7.25 |
| No active sedation | Daily sedation vacation (SAT) |
Step 2: Rapid Shallow Breathing Index (RSBI)
| RSBI Value | Interpretation |
|---|---|
| < 80 | Likely to succeed weaning |
| 80-105 | Borderline |
| > 105 | Likely to fail - continue support |
Step 3: Spontaneous Breathing Trial (SBT)
- T-piece trial: Patient disconnected from ventilator, breathes through a T-tube with O2
- Low-level PSV trial: Keep patient on ventilator with PS of 5 cmH2O + PEEP 5 cmH2O (least support possible)
| Sign | Threshold |
|---|---|
| RR | > 35 breaths/min |
| SpO2 | < 90% |
| Heart rate | > 140 or change > 20% |
| BP | Systolic > 180 or < 90 mmHg |
| Agitation, anxiety, diaphoresis | Any significant sign |
| Use of accessory muscles | Visible |
| Paradoxical breathing | Chest and abdomen move opposite |
Step 4: Extubation Decision
- Alert, following commands
- Strong cough reflex
- Minimal secretions
- Can protect airway (gag reflex)
- No stridor (cuff leak test for prolonged intubation)
- RSBI < 105
Weaning Methods if SBT Fails
| Method | How It Works |
|---|---|
| PSV weaning | Gradually reduce PS level (e.g., from 20 → 5 cmH2O over days) |
| SIMV rate reduction | Gradually reduce mandatory rate (e.g., 12 → 6 → 2 breaths/min) |
| Daily SBT | Repeat SBT every 24 hours until success |
| T-piece trials | Progressive trials of 10-30 min, increasing duration |
Evidence: Daily SBT with daily sedation interruption is proven to reduce ventilator duration and ICU stay. PSV weaning alone can prolong time on ventilator if not combined with SBT.
Weaning Parameters Summary
| Parameter | Favorable | Unfavorable |
|---|---|---|
| RSBI | < 105 | > 105 |
| VT spontaneous | > 5 mL/kg | < 5 mL/kg |
| Vital capacity | > 15 mL/kg | < 10 mL/kg |
| Max inspiratory force (MIF) | < -25 cmH2O | > -25 cmH2O |
| RR | < 25 | > 35 |
| Minute ventilation | < 10 L/min | > 15 L/min |
| PaO2/FiO2 | > 200 | < 150 |
Source: Morgan & Mikhail's Clinical Anesthesiology, p. 2539-2542
PART 10: COMPLICATIONS OF MECHANICAL VENTILATION
| Complication | Cause | Prevention |
|---|---|---|
| VAP (ventilator-associated pneumonia) | Aspiration around cuff | Head of bed 30-45°, oral care, subglottic suction |
| Barotrauma (pneumothorax, emphysema) | High Ppeak, Pplat | Pplat < 30, LTVV |
| Volutrauma | Large VT overdistension | VT 6 mL/kg IBW |
| Atelectrauma | Cyclic open-close of alveoli | Adequate PEEP |
| Biotrauma | Inflammatory mediator release | All of the above |
| Hemodynamic effects | Reduced venous return from positive pressure | Volume resuscitation |
| O2 toxicity | FiO2 > 0.6 for > 24 hours | Titrate FiO2 down |
| Auto-PEEP | Air trapping | Reduce RR, increase expiratory time |
| Subglottic stenosis | Prolonged intubation > 2-3 weeks | Tracheostomy if > 2 weeks needed |
QUICK REFERENCE SUMMARY
INDICATION         INITIAL MODE      KEY SETTING
ARDS               AC-VCV            VT 6 mL/kg, Pplat < 30, PEEP titrated
COPD exacerbation  NIV BIPAP / AC    Low RR, high flow, I:E 1:3-1:4
Status asthmaticus AC-VCV            Low RR (< 10), high flow, permissive hypercapnia
Post-op routine    AC or SIMV+PS     VT 6-8 mL/kg, FiO2 titrate down, wean early
Neuromuscular dz   AC-VCV            Normal VT 8 mL/kg, PEEP 5
- Morgan & Mikhail's Clinical Anesthesiology, 7e pp. 2519-2543 - modes, settings, weaning
- Rosen's Emergency Medicine, 10e p. 2069-2079 - indications, asthma/COPD management
- Your uploaded PDFs: Ventilator Waveforms, Modes of MV, Discontinuation of MV (image-based content synthesized with library sources above)