
Prostate cancer frequently metastasizes to the vertebrae. Explain this to me in simplest language
prostate cancer vertebral metastasis mechanism Batson plexus simple explanation
prostate cancer bone metastasis vertebral spine diagram
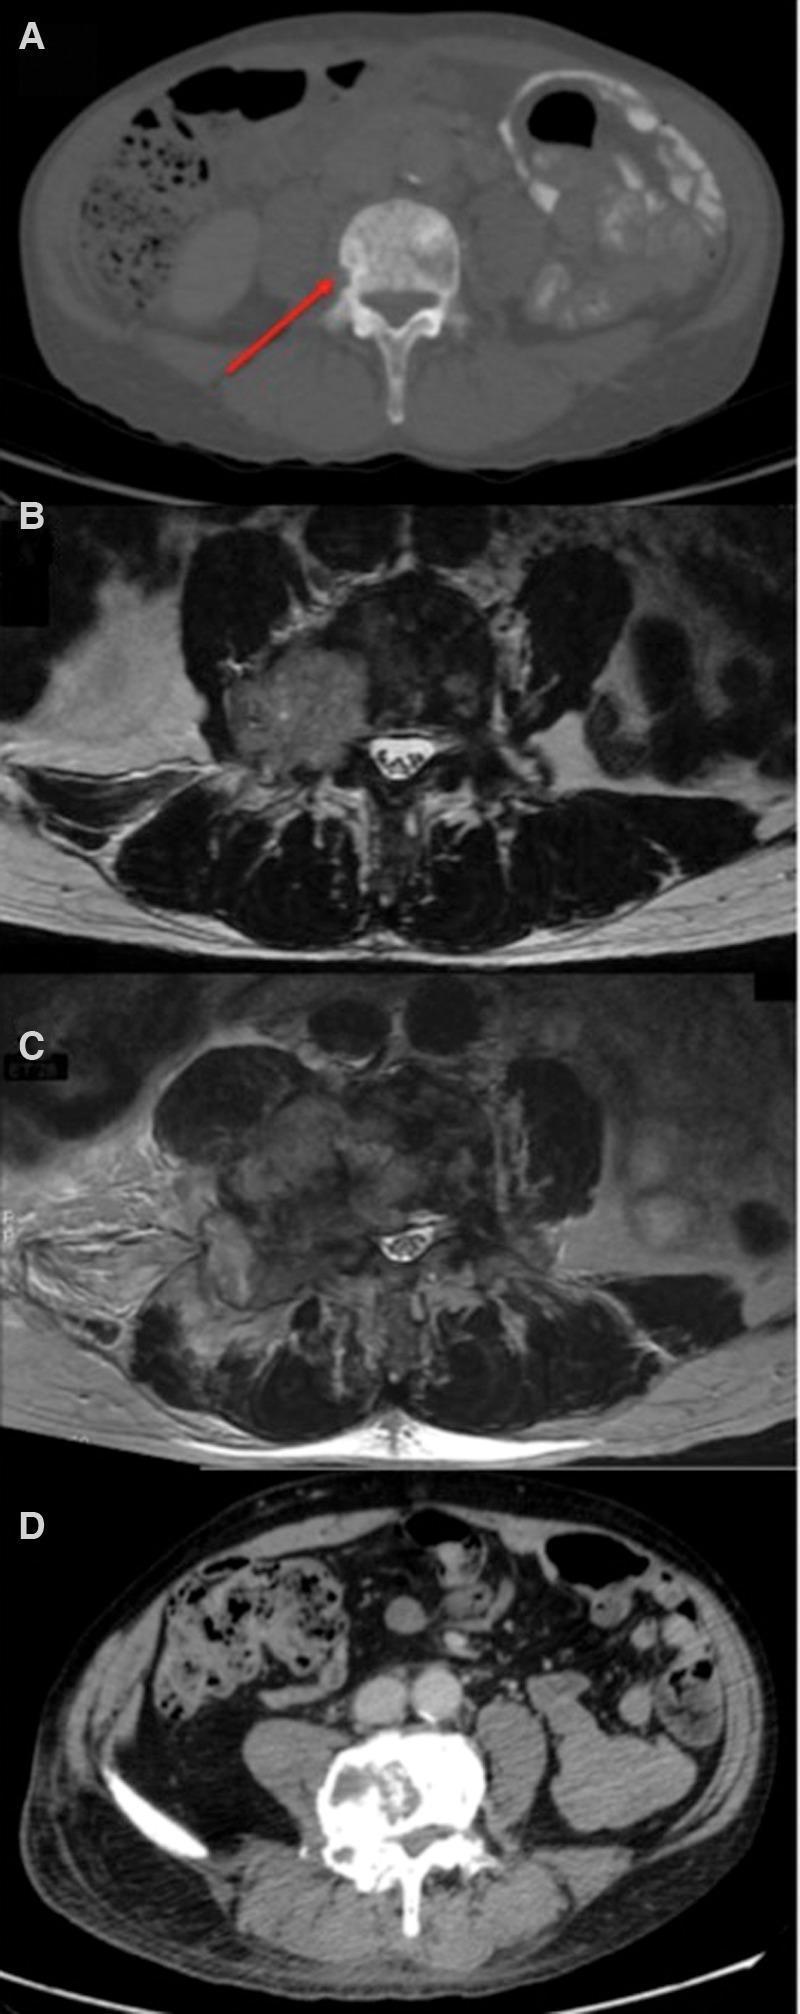
This composite of four radiological images illustrates the clinical progression and treatment response of metastatic prostate cancer in the lumbar spine. (A) Axial CT scan in a soft tissue window showing initial staging; a red arrow highlights mild cortical erosion of the vertebral body, indicating early bone metastasis. (B) Axial T2-weighted MRI at 2.5 months demonstrates an aggressive lesion in the L4 vertebra invading the right pedicle and encroaching upon the spinal canal. (C) Axial MRI at 4 months reveals significant disease progression, with the L4 lesion increasing in size and exhibiting extensive metastatic marrow infiltration and soft tissue extension. (D) Axial CT scan in a bone window at 10.5 months demonstrates a marked radiological response following a change in chemotherapy regimen, showing significant reduction of the tumor mass and partial remodeling of the L4 vertebral structure. The series serves as an educational example of monitoring metastatic disease using multimodal imaging (CT and MRI) and correlating radiological findings with clinical transitions between adenocarcinoma and small-cell carcinoma phenotypes.
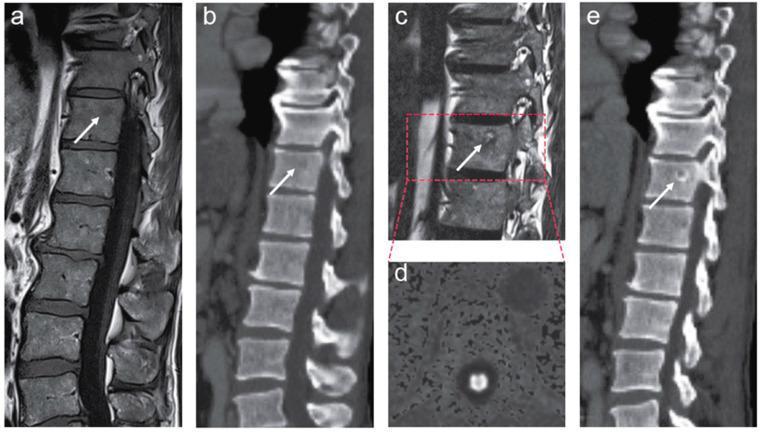
This composite of clinical diagnostic images illustrates the evolution and treatment response of a solitary thoracic spine bone marrow metastasis in a patient with metastatic prostate cancer. The panel is divided into pretreatment (a, b) and post-treatment (c-e) phases. Figures (a) and (b) show the initial focal lesion in a mid-thoracic vertebral body on sagittal MRI and CT, appearing as a subtle area of altered signal and density (white arrows). Following androgen deprivation therapy, figure (c) provides a sagittal T2-weighted fat-only Dixon MRI sequence showing a hyperintense signal within the lesion, indicating increased fat content—a typical sign of treatment response in bone marrow. Figure (d) presents a diffusion-weighted imaging (DWI) view with no evidence of restricted diffusion, suggesting a lack of active tumor cellularity. Finally, figure (e) shows a follow-up sagittal CT scan demonstrating perilesional sclerosis (increased bone density) surrounding the original site, further confirming local stabilization and treatment effect. This series serves as an educational example of multimodality imaging (MRI and CT) used to monitor oncological response in spinal metastases.
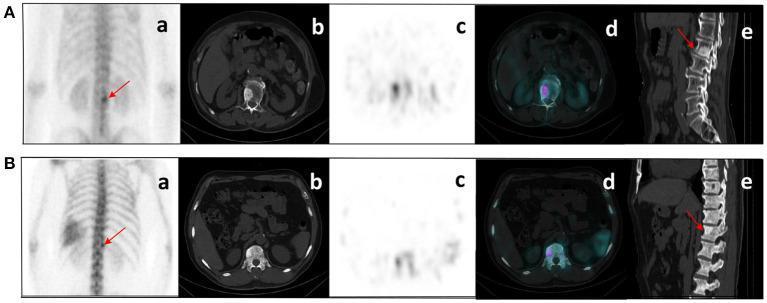
This diagnostic imaging set presents a comparison between malignant bone metastasis (A) and a benign bone lesion (B) in the spine, utilizing multiple modalities: (a) Planar scintigraphy (99mTc-MDP), (b) axial CT, (c) axial SPECT, (d) fused SPECT/CT, and (e) sagittal CT. Case A involves a 76-year-old male with prostate cancer, showing a nodular high-density (sclerotic) shadow on the right inferior aspect of the L2 vertebral body. This lesion correlates with intense, focal radiopharmaceutical uptake (hot spot) on SPECT/CT, characteristic of osteoblastic metastasis. Case B involves a 60-year-old male, showing a similar nodular sclerotic density at the superior aspect of the T12 vertebral body with increased tracer distribution. However, this was clinically confirmed as a benign lesion. The comparison highlights the diagnostic challenge in differentiating isolated sclerotic spinal lesions in oncological patients. The educational focus is on the integration of morphological CT data with functional SPECT data to evaluate metabolic activity in suspected skeletal metastases, emphasizing that focal uptake alone requires careful correlation with clinical history and follow-up imaging.
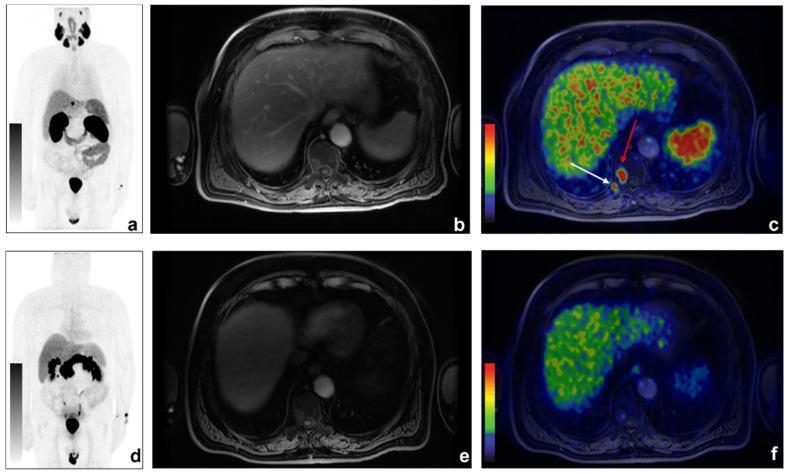
This comparative diagnostic series displays dual-tracer imaging for prostate cancer metastasis detection using 68Ga-PSMA and 68Ga-DOTA-RM2 PET/MRI. The top row (a-c) highlights 68Ga-PSMA findings: the Maximum Intensity Projection (MIP) (a) and axial fusion PET/MRI (c) reveal intense focal radiotracer uptake in the right D10 vertebral body (red arrow) and the posterior segment of the tenth rib (white arrow), consistent with bone metastases. The axial LAVA-FLEX MRI (b) provides high-resolution anatomical context of the upper abdomen, including the liver and spine. In contrast, the bottom row (d-f) displays 68Ga-DOTA-RM2 PET/MRI results for the same anatomical levels. While the anatomical MRI (e) is identical, the 68Ga-DOTA-RM2 MIP (d) and axial fusion (f) show no significant tracer accumulation in the corresponding osseous regions. This comparison demonstrates a discordant finding where PSMA-PET/MRI successfully identifies metastatic bone involvement that is not detectable by the GRPR-targeted 68Ga-DOTA-RM2 tracer, illustrating the varying diagnostic sensitivities of molecular targets in biochemical recurrence of prostate cancer.
Why Prostate Cancer Loves the Spine
1. The Plumbing Problem - Batson's Plexus
2. Bone Marrow Is a Welcoming Home
3. The "Seed and Soil" Concept
4. Anatomy: The Prostate Is Right There
What Happens When Cancer Reaches the Vertebrae?
| What Occurs | Plain Language |
|---|---|
| Tumor grows inside vertebral body | Cancer sets up camp in the spongy inside of the spinal bone |
| Bone becomes weak | The bone structure is damaged, risking fracture |
| Spinal cord compression | Growing tumor can press on the spinal cord, causing pain, weakness, or paralysis |
| Pain | Usually deep, persistent, worse at night, not relieved by rest |
A Simple Visual
Summary in One Paragraph
Create a visual summary infographic explaining Batson's plexus and vertebral metastasis
Medical education infographic titled "Batson's Plexus & Vertebral Metastasis in Prostate Cancer". Clean clinical illustration style with labeled anatomical diagrams and text boxes. Layout (top to bottom): HEADER: Bold title "How Prostate Cancer Spreads to the Spine" with subtitle "The Role of Batson's Plexus" SECTION 1 - ANATOMY (left panel): Sagittal cross-section of male pelvis and lumbar spine showing: - Prostate gland labeled at base of bladder - Red arrows showing venous drainage from prostate - A network of thin veins running alongside the vertebral column labeled "Batson's Plexus (Paravertebral Venous Plexus)" - Arrow showing how cancer cells travel UP the plexus toward vertebrae - Label: "Low-pressure, valve-free veins = easy highway for cancer cells" SECTION 2 - MECHANISM (center panel): Three-step numbered flow diagram: Step 1: Cancer cell icon breaking off from prostate tumor → label "Tumor cells enter local veins" Step 2: Cell traveling through vein network alongside spine → label "Cells bypass lungs via Batson's plexus shortcut" Step 3: Cell lodging inside vertebral bone marrow → label "Cells anchor in bone marrow rich environment" SECTION 3 - BONE EFFECTS (right panel): Cross-section of vertebra showing: - Normal vertebral body on left - Metastatic vertebral body on right with tumor mass inside - Labels: "Osteoblastic lesion (dense, sclerotic)", "Weakened bone → fracture risk", "Tumor pressing on spinal cord → pain/paralysis" SECTION 4 - KEY FACTS BOX at bottom: Dark blue box with white text listing: • "Spine = #1 site of skeletal metastasis" • "Thoracic spine most affected (60%), then lumbar (25%)" • "Prostate cancer produces OSTEOBLASTIC (bone-forming) metastases" • "Symptoms: deep persistent pain, worse at night" • "Risk: spinal cord compression → neurological deficit" Color scheme: deep navy blue, medical red, light gray background, white text boxes. Professional medical illustration style.
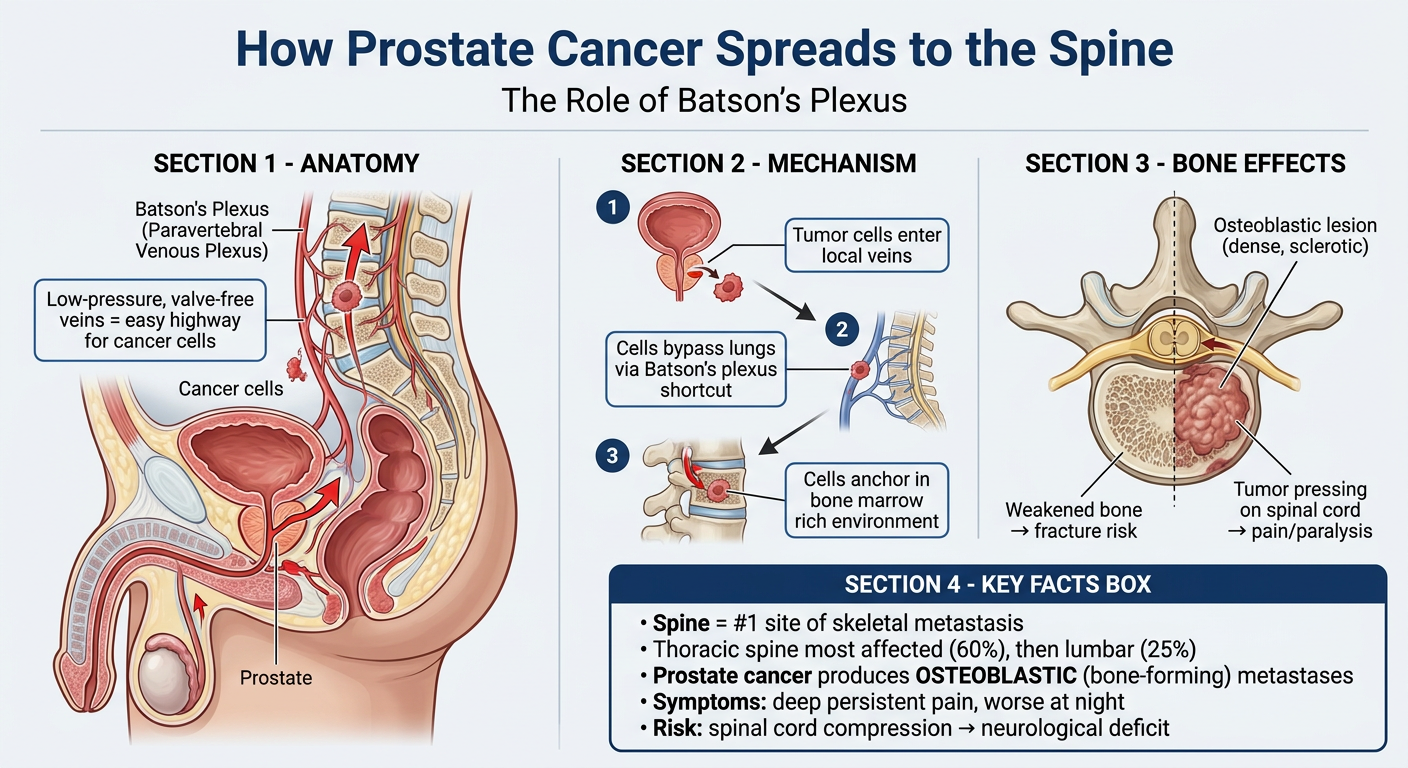
- Anatomy panel - shows the prostate's direct venous connection to the paravertebral plexus running alongside the spine
- 3-step mechanism - traces the cancer cell's journey from prostate → Batson's plexus → vertebral bone marrow
- Bone effects - contrasts a normal vertebra with a metastatic one, showing the osteoblastic (bone-forming) lesion and risk of spinal cord compression
- Key facts box - summarizes the clinical essentials: site distribution, lesion type, symptoms, and complications