Ecg of mi
ECG changes myocardial infarction STEMI NSTEMI patterns 2024
ECG in Myocardial Infarction
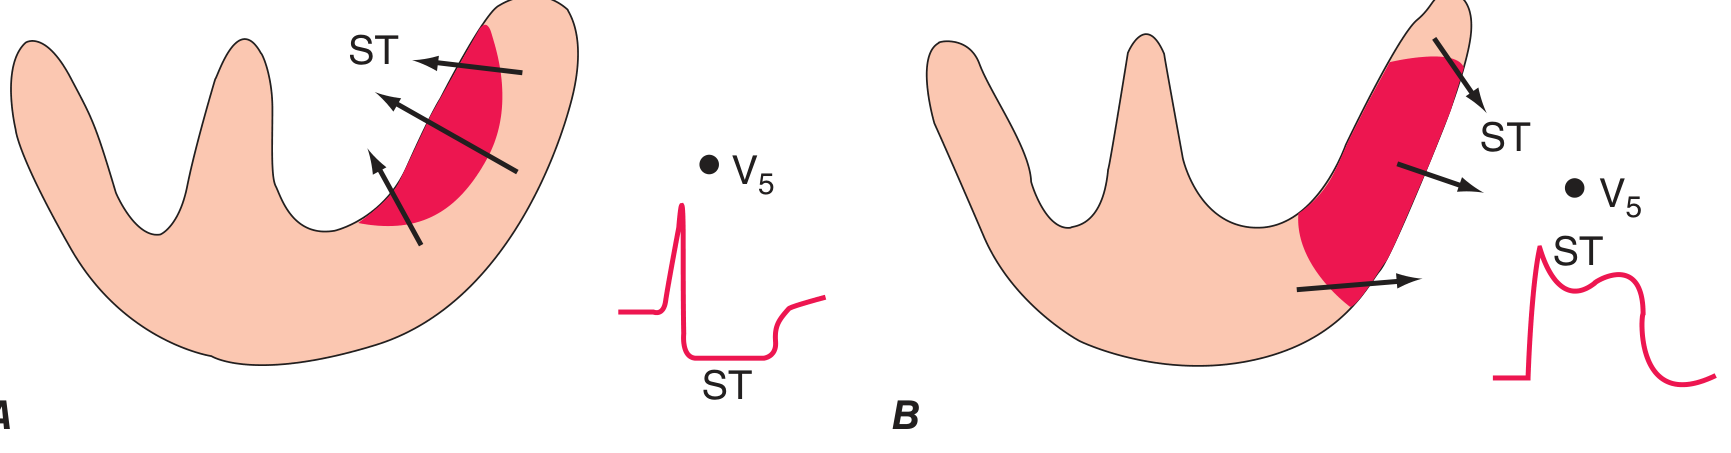
Pathophysiology of ECG Changes
Sequential ECG Changes in STEMI
| Stage | Timing | ECG Finding |
|---|---|---|
| Hyperacute | Minutes | Tall, broad ("hyperacute") T waves |
| Acute injury | Hours | ST-segment elevation; T wave may still be upright |
| Evolving | Hours to days | T-wave inversion in same leads; Q waves appear |
| Old/chronic | Weeks to months | Persistent Q waves; ST may normalize; T waves may normalize or remain inverted |
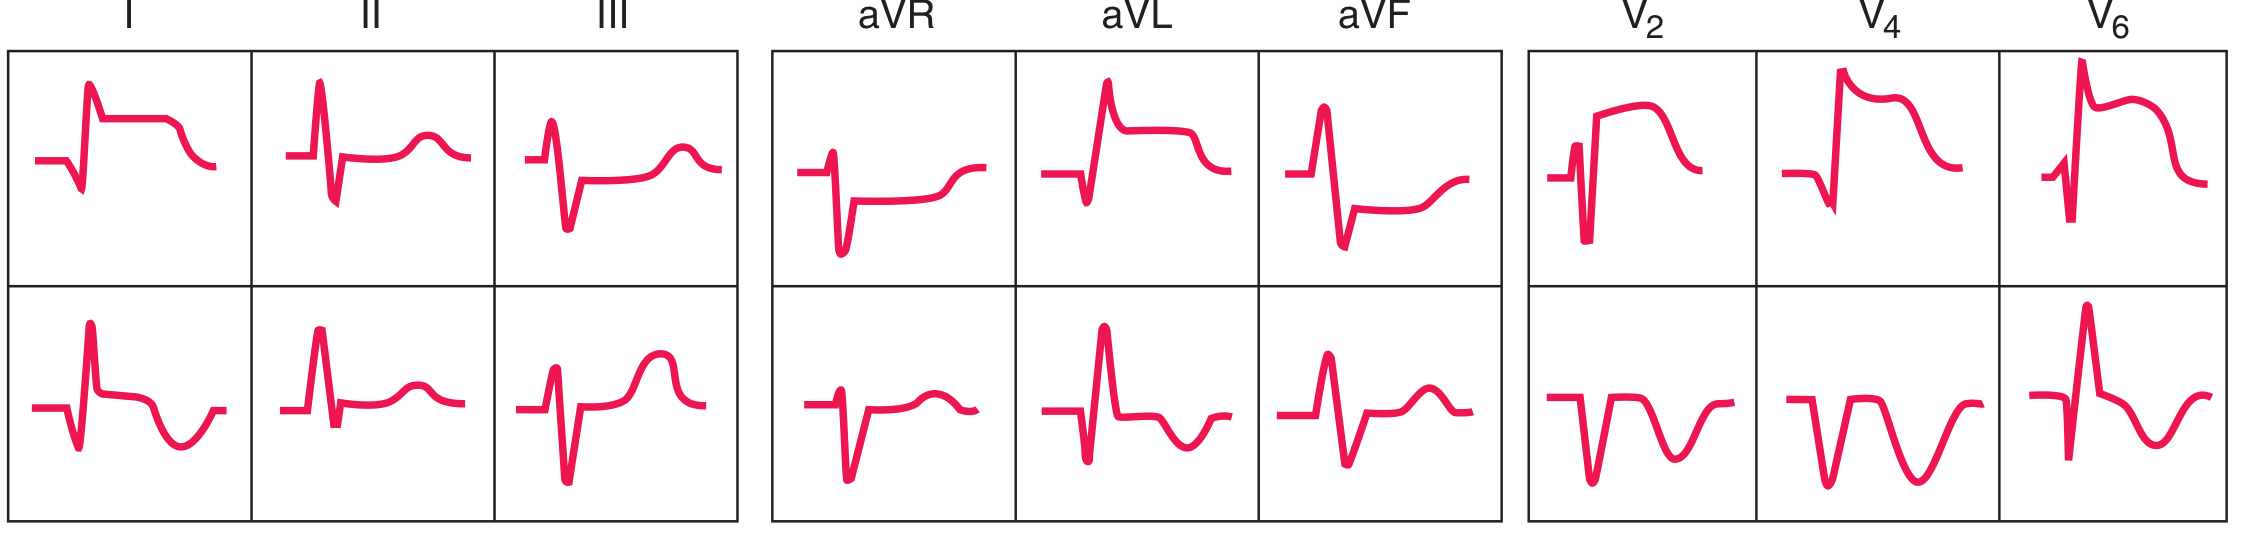
Anterior STEMI - Acute and Evolving
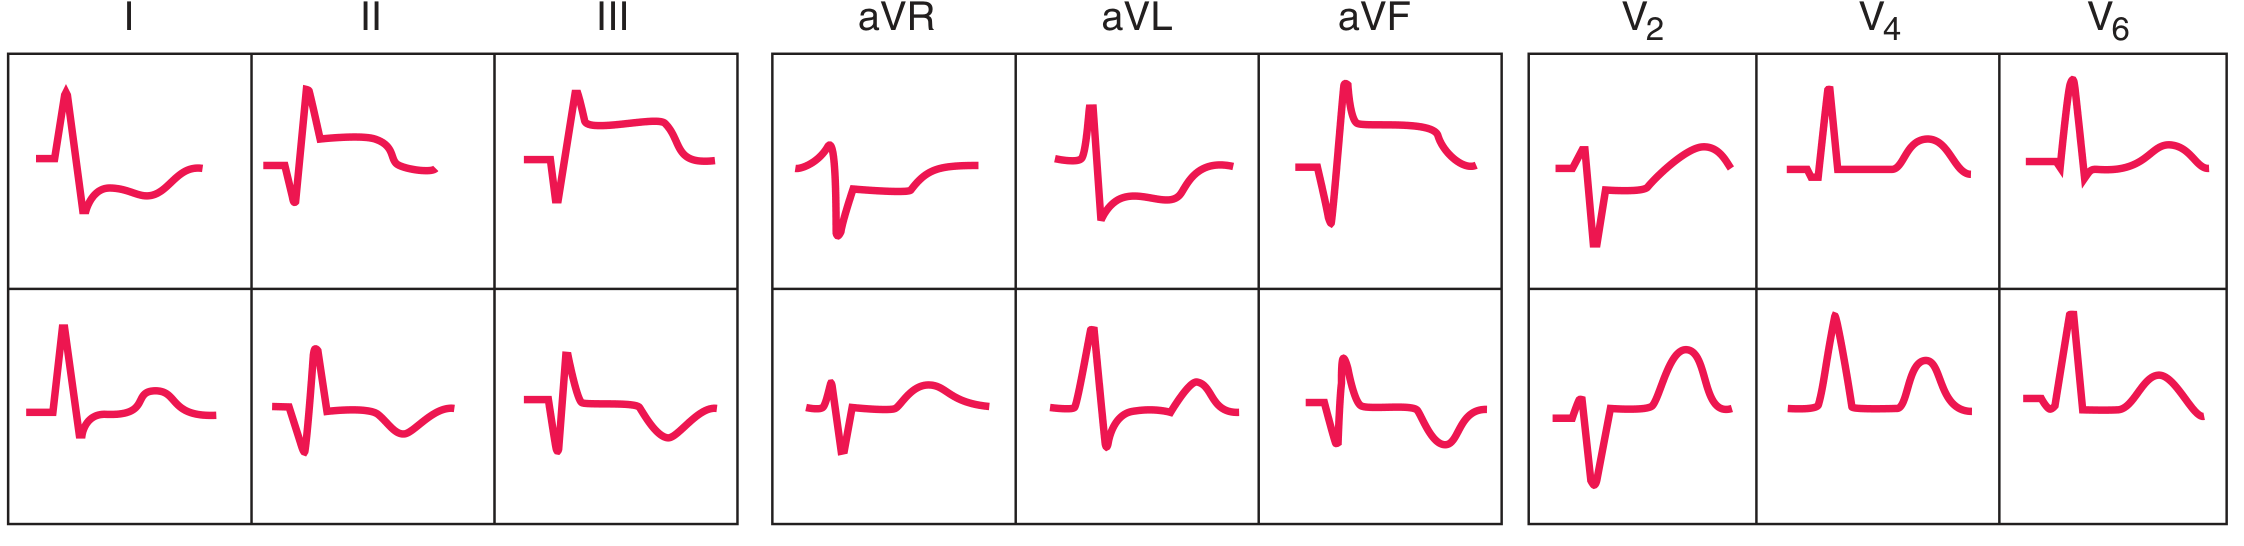
Inferior STEMI - Acute and Evolving
Localization by Lead Distribution
| Territory | Leads with ST Elevation | Artery Usually Involved |
|---|---|---|
| Anteroseptal | V1, V2, (V3) | LAD (proximal) |
| Anterior | V1-V4 | LAD |
| Anterolateral | V1-V6, I, aVL | LAD or LCx |
| Lateral | I, aVL | LCx or diagonal |
| Inferior | II, III, aVF | RCA (80%) or LCx |
| Inferolateral | II, III, aVF, V5, V6 | RCA + LCx |
| True posterior | Tall R in V1-V2, R/S ≥1, ST depression V1-V3 (reciprocal) | LCx or RCA-PL |
| Right ventricular | II, III, aVF + ST elevation in V3R-V6R | Proximal RCA |
Tip: Inferior STEMI (II, III, aVF) always mandates right-sided ECG leads to detect concurrent RV infarction, which is present in ~40% of inferior MIs. ST elevation in V4R is the most sensitive sign.
Reciprocal Changes
- Anterior STEMI: reciprocal ST depression in II, III, aVF
- Inferior STEMI: reciprocal ST depression in I, aVL, and often V1-V3
- Posterior STEMI: no direct ST elevation in standard leads - the entire picture IS the reciprocal: ST depression + tall R in V1-V2 (flip V1-V3 upside down to see the "elevation")
Q Waves
- Width ≥ 0.04 s (1 mm) and depth ≥ 25% of the following R wave
- Previously thought to indicate transmural infarction exclusively - this is no longer considered accurate; Q waves can occur with subendocardial infarcts and may be absent in transmural infarcts
- May persist permanently or regress over months in some patients
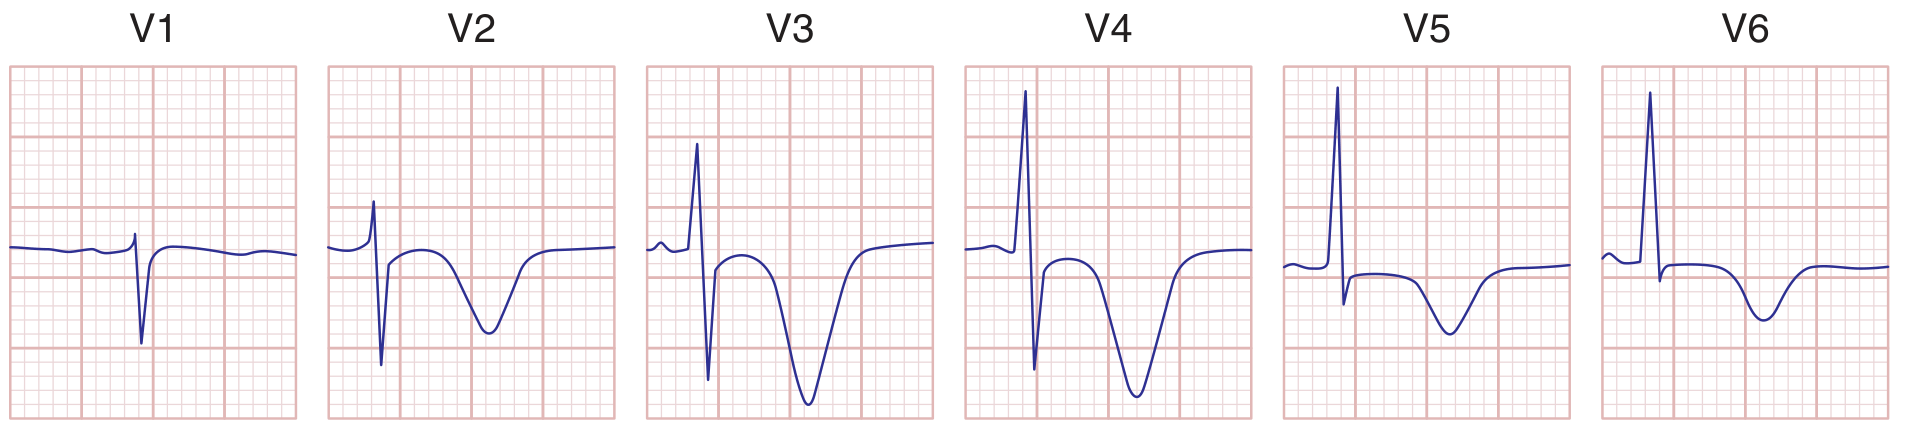
Wellens Syndrome (High-Risk NSTEMI Pattern)
STEMI Diagnostic Criteria (Standard Thresholds)
- New ST elevation at the J-point in ≥2 contiguous leads:
- ≥ 2.5 mm in men <40 years in V2-V3; ≥ 2.0 mm in men ≥40 years; ≥ 1.5 mm in women in V2-V3
- ≥ 1 mm in all other leads
- New LBBB with typical ischemic symptoms is treated as STEMI equivalent
- Sgarbossa criteria help identify MI in the presence of LBBB:
- Concordant ST elevation ≥1 mm in leads with positive QRS (5 points)
- Concordant ST depression ≥1 mm in V1-V3 (3 points)
- Discordant ST elevation ≥5 mm (2 points); modified: use ST/S ratio >0.25
NSTEMI / Ischemia ECG Changes
- ST depression (horizontal or downsloping) ≥0.5 mm in ≥2 contiguous leads
- T-wave inversion ≥1 mm (symmetric, in leads with dominant R waves)
- Transient ST changes (≥0.5 mm) during symptoms are highly specific
- A normal ECG does not exclude NSTEMI - serial ECGs and troponins are required
Emerging Concept: OMI Paradigm
- De Winter T-waves: upsloping ST depression with tall, symmetric T waves in V1-V4 (LAD occlusion without ST elevation)
- Hyperacute T-waves: broad, bulky, asymmetric T waves as the earliest sign
- Posterior MI patterns: ST depression in V1-V3 as the only finding
- Wellens patterns: as described above
ECG Limitations
- A single normal ECG does not exclude MI - repeat every 15-30 minutes if initial is non-diagnostic
- LBBB, pacemaker rhythm, WPW can mask ischemic changes
- Many conditions mimic MI: pericarditis, early repolarization, LVH, Brugada pattern, hyperkalemia, myocarditis, takotsubo cardiomyopathy
Create a quick ECG reference guide (PDF/Word) for MI localization
ls -la /home/daytona/workspace/ && ls /home/daytona/skills/docx/
mkdir -p /home/daytona/workspace/ecg-mi-guide && node -e "require('docx'); conso…
~/ecg-mi-guide/build.js
const {
  Document, Packer, Paragraph, TextRun, Table, TableRow, TableCell,
  HeadingLevel, AlignmentType, BorderStyle, WidthType, ShadingType,
  VerticalAlign, PageBreak, Header, Footer, PageNumber, NumberFormat,
  UnderlineType
} = require('docx');
const fs = require('fs');

// ─── Color palette ────────────────────────────────────────────────────────────
const RED       = "C0392B";
const DARK_RED  = "922B21";
const LIGHT_RED = "FADBD8";
const BLUE      = "1A5276";
const LIGHT_BLUE = "D6EAF8";
const DARK_GRAY = "2C3E50";
const MED_GRAY  = "566573";
const LIGHT_GRAY = "F2F3F4";
const ORANGE    = "D35400";
const LIGHT_ORANGE = "FDEBD0";
const GREEN     = "1E8449";
const LIGHT_GREEN = "D5F5E3";
const PURPLE    = "6C3483";
const LIGHT_PURPLE = "E8DAEF";
const WHITE     = "FFFFFF";

// ─── Helper: thick coloured paragraph border ─────────────────────────────────
function sectionBox(color) {
  return {
    top:    { style: BorderStyle.THICK, size: 12, color },
    bottom: { style: BorderStyle.THICK, size: 12, color },
    left:   { style: BorderStyle.THICK, size: 12, color },
    right:  { style: BorderStyle.THICK, size: 12, color },
  };
}

// ─── Helper: title paragraph ─────────────────────────────────────────────────
function title(text, color = WHITE) {
  return new Paragraph({
    alignment: AlignmentType.CENTER,
    shading: { type: ShadingType.SOLID, color: DARK_RED, fill: DARK_RED },
    spacing: { before: 0, after: 0 },
    children: [
      new TextRun({
        text,
        bold: true,
        size: 40,
        color: WHITE,
        font: "Calibri",
      }),
    ],
  });
}

function subtitle(text) {
  return new Paragraph({
    alignment: AlignmentType.CENTER,
    shading: { type: ShadingType.SOLID, color: RED, fill: RED },
    spacing: { before: 0, after: 160 },
    children: [
      new TextRun({
        text,
        size: 22,
        color: WHITE,
        italics: true,
        font: "Calibri",
      }),
    ],
  });
}

// ─── Helper: section heading ─────────────────────────────────────────────────
function sectionHead(text, bgColor = BLUE) {
  return new Paragraph({
    spacing: { before: 240, after: 80 },
    shading: { type: ShadingType.SOLID, color: bgColor, fill: bgColor },
    children: [
      new TextRun({
        text: "  " + text,
        bold: true,
        size: 26,
        color: WHITE,
        font: "Calibri",
        allCaps: true,
      }),
    ],
  });
}

// ─── Helper: body paragraph ──────────────────────────────────────────────────
function body(text, { bold = false, color = DARK_GRAY, size = 20, indent = false } = {}) {
  return new Paragraph({
    spacing: { before: 60, after: 60 },
    indent: indent ? { left: 360 } : undefined,
    children: [
      new TextRun({ text, bold, color, size, font: "Calibri" }),
    ],
  });
}

// ─── Helper: bullet ──────────────────────────────────────────────────────────
function bullet(text, level = 0) {
  return new Paragraph({
    bullet: { level },
    spacing: { before: 40, after: 40 },
    indent: { left: 360 + level * 360 },
    children: [
      new TextRun({ text, size: 20, color: DARK_GRAY, font: "Calibri" }),
    ],
  });
}

function bulletBold(label, rest, color = RED) {
  return new Paragraph({
    bullet: { level: 0 },
    spacing: { before: 40, after: 40 },
    indent: { left: 360 },
    children: [
      new TextRun({ text: label, bold: true, size: 20, color, font: "Calibri" }),
      new TextRun({ text: rest, size: 20, color: DARK_GRAY, font: "Calibri" }),
    ],
  });
}

// ─── Helper: note box ────────────────────────────────────────────────────────
function noteBox(text, bgColor = LIGHT_BLUE, borderColor = BLUE) {
  return new Paragraph({
    spacing: { before: 120, after: 120 },
    indent: { left: 200, right: 200 },
    border: sectionBox(borderColor),
    shading: { type: ShadingType.SOLID, color: bgColor, fill: bgColor },
    children: [
      new TextRun({ text: "  " + text + "  ", size: 20, color: BLUE, font: "Calibri", italics: true }),
    ],
  });
}

function warningBox(text) {
  return new Paragraph({
    spacing: { before: 120, after: 120 },
    indent: { left: 200, right: 200 },
    border: sectionBox(ORANGE),
    shading: { type: ShadingType.SOLID, color: LIGHT_ORANGE, fill: LIGHT_ORANGE },
    children: [
      new TextRun({ text: "  ⚠  " + text + "  ", size: 20, color: ORANGE, bold: true, font: "Calibri" }),
    ],
  });
}

// ─── Helper: spacer ──────────────────────────────────────────────────────────
function spacer(size = 120) {
  return new Paragraph({ spacing: { before: size, after: 0 }, children: [] });
}

// ─── Helper: page break ──────────────────────────────────────────────────────
function pageBreak() {
  return new Paragraph({
    children: [new TextRun({ break: 1 })],
  });
}

// ─── Helper: table cell ──────────────────────────────────────────────────────
function cell(text, { bold = false, shade = null, color = DARK_GRAY, align = AlignmentType.LEFT, size = 19, colspan = 1 } = {}) {
  return new TableCell({
    columnSpan: colspan,
    verticalAlign: VerticalAlign.CENTER,
    shading: shade ? { type: ShadingType.SOLID, color: shade, fill: shade } : undefined,
    margins: { top: 80, bottom: 80, left: 100, right: 100 },
    children: [
      new Paragraph({
        alignment: align,
        children: [new TextRun({ text, bold, color: shade ? WHITE : color, size, font: "Calibri" })],
      }),
    ],
  });
}

function headerCell(text, bgColor = BLUE) {
  return new TableCell({
    verticalAlign: VerticalAlign.CENTER,
    shading: { type: ShadingType.SOLID, color: bgColor, fill: bgColor },
    margins: { top: 80, bottom: 80, left: 100, right: 100 },
    children: [
      new Paragraph({
        alignment: AlignmentType.CENTER,
        children: [new TextRun({ text, bold: true, color: WHITE, size: 19, font: "Calibri", allCaps: true })],
      }),
    ],
  });
}

// ─── TABLE: Localization ──────────────────────────────────────────────────────
const localizationTable = new Table({
  width: { size: 100, type: WidthType.PERCENTAGE },
  rows: [
    new TableRow({
      tableHeader: true,
      children: [
        headerCell("Territory", RED),
        headerCell("ST Elevation Leads", RED),
        headerCell("Reciprocal Changes", RED),
        headerCell("Artery", RED),
      ],
    }),
    new TableRow({ children: [
      cell("Anteroseptal", { shade: DARK_GRAY }),
      cell("V1, V2 (± V3)"),
      cell("II, III, aVF (variable)"),
      cell("LAD (proximal septal)"),
    ]}),
    new TableRow({ children: [
      cell("Anterior", { shade: MED_GRAY }),
      cell("V1 – V4"),
      cell("II, III, aVF"),
      cell("LAD (mid)"),
    ]}),
    new TableRow({ children: [
      cell("Anterolateral", { shade: DARK_GRAY }),
      cell("V1 – V6, I, aVL"),
      cell("II, III, aVF"),
      cell("LAD (proximal) or LCx"),
    ]}),
    new TableRow({ children: [
      cell("Lateral", { shade: MED_GRAY }),
      cell("I, aVL (± V5, V6)"),
      cell("II, III, aVF"),
      cell("LCx or diagonal (D1)"),
    ]}),
    new TableRow({ children: [
      cell("Inferior", { shade: DARK_GRAY }),
      cell("II, III, aVF"),
      cell("I, aVL, V1-V3"),
      cell("RCA (80%) or LCx (20%)"),
    ]}),
    new TableRow({ children: [
      cell("Inferolateral", { shade: MED_GRAY }),
      cell("II, III, aVF, V5, V6"),
      cell("I, aVL, V1-V3"),
      cell("Dominant RCA or LCx"),
    ]}),
    new TableRow({ children: [
      cell("True Posterior", { shade: DARK_GRAY }),
      cell("None in standard leads"),
      cell("ST depression + tall R in V1-V2 (R/S ≥1, R >0.04s)"),
      cell("LCx (dominant) or RCA-PL"),
    ]}),
    new TableRow({ children: [
      cell("Right Ventricular", { shade: MED_GRAY }),
      cell("II, III, aVF + V3R-V6R (right-sided leads)"),
      cell("ST depression in lateral leads"),
      cell("Proximal RCA"),
    ]}),
  ],
});

// ─── TABLE: STEMI diagnostic criteria ────────────────────────────────────────
const criteriaTable = new Table({
  width: { size: 100, type: WidthType.PERCENTAGE },
  rows: [
    new TableRow({
      tableHeader: true,
      children: [
        headerCell("Leads", RED),
        headerCell("Men < 40 yrs", RED),
        headerCell("Men ≥ 40 yrs", RED),
        headerCell("Women (any age)", RED),
      ],
    }),
    new TableRow({ children: [
      cell("V2 – V3"),
      cell("≥ 2.5 mm", { bold: true }),
      cell("≥ 2.0 mm", { bold: true }),
      cell("≥ 1.5 mm", { bold: true }),
    ]}),
    new TableRow({ children: [
      cell("All other leads"),
      cell("≥ 1.0 mm", { bold: true }),
      cell("≥ 1.0 mm", { bold: true }),
      cell("≥ 1.0 mm", { bold: true }),
    ]}),
    new TableRow({ children: [
      cell("V3R / V4R (RV MI)"),
      cell("≥ 0.5 mm", { bold: true, colspan: 3 }),
      cell(""),
      cell(""),
    ]}),
    new TableRow({ children: [
      cell("V7 – V9 (Posterior)"),
      cell("≥ 0.5 mm", { bold: true, colspan: 3 }),
      cell(""),
      cell(""),
    ]}),
  ],
});

// ─── TABLE: Sequential changes ───────────────────────────────────────────────
const sequenceTable = new Table({
  width: { size: 100, type: WidthType.PERCENTAGE },
  rows: [
    new TableRow({
      tableHeader: true,
      children: [
        headerCell("Stage", DARK_RED),
        headerCell("Timing", DARK_RED),
        headerCell("ECG Changes", DARK_RED),
      ],
    }),
    new TableRow({ children: [
      cell("Hyperacute", { shade: DARK_GRAY }),
      cell("Minutes"),
      cell("Tall, broad, peaked T waves (asymmetric, bulky)"),
    ]}),
    new TableRow({ children: [
      cell("Acute Injury", { shade: MED_GRAY }),
      cell("Minutes to hours"),
      cell("ST elevation (tombstone/convex upward); T waves still upright"),
    ]}),
    new TableRow({ children: [
      cell("Evolving", { shade: DARK_GRAY }),
      cell("Hours to days"),
      cell("T-wave inversion in same leads; Q waves begin to form"),
    ]}),
    new TableRow({ children: [
      cell("Old/Subacute", { shade: MED_GRAY }),
      cell("Days to weeks"),
      cell("Deep Q waves + persistent T-wave inversion; ST may normalize"),
    ]}),
    new TableRow({ children: [
      cell("Chronic", { shade: DARK_GRAY }),
      cell("Weeks to months"),
      cell("Persistent Q waves; ST/T may normalize or remain abnormal"),
    ]}),
  ],
});

// ─── TABLE: Sgarbossa criteria ───────────────────────────────────────────────
const sgarbossaTable = new Table({
  width: { size: 100, type: WidthType.PERCENTAGE },
  rows: [
    new TableRow({
      tableHeader: true,
      children: [
        headerCell("Criterion", PURPLE),
        headerCell("Finding", PURPLE),
        headerCell("Score", PURPLE),
      ],
    }),
    new TableRow({ children: [
      cell("1 - Concordant STE"),
      cell("ST elevation ≥1 mm in leads with a predominantly positive QRS"),
      cell("5 pts", { bold: true, color: RED }),
    ]}),
    new TableRow({ children: [
      cell("2 - Concordant STD"),
      cell("ST depression ≥1 mm in V1, V2, or V3"),
      cell("3 pts", { bold: true, color: RED }),
    ]}),
    new TableRow({ children: [
      cell("3 - Discordant STE (original)"),
      cell("Excessively discordant ST elevation ≥5 mm"),
      cell("2 pts", { bold: true, color: RED }),
    ]}),
    new TableRow({ children: [
      cell("Modified criterion 3"),
      cell("ST/S ratio > 0.25 (Smith modification) — more sensitive"),
      cell("—"),
    ]}),
    new TableRow({ children: [
      cell("Interpretation"),
      cell("Score ≥ 3 = highly specific for MI in LBBB context"),
      cell(""),
    ]}),
  ],
});

// ─── TABLE: High-risk patterns / OMI ─────────────────────────────────────────
const omiTable = new Table({
  width: { size: 100, type: WidthType.PERCENTAGE },
  rows: [
    new TableRow({
      tableHeader: true,
      children: [
        headerCell("Pattern", GREEN),
        headerCell("ECG Finding", GREEN),
        headerCell("Significance", GREEN),
      ],
    }),
    new TableRow({ children: [
      cell("Hyperacute T waves"),
      cell("Broad, bulky, asymmetric T waves; taller than normal"),
      cell("Earliest sign of STEMI — precedes ST elevation"),
    ]}),
    new TableRow({ children: [
      cell("de Winter T waves"),
      cell("Upsloping ST depression with tall, symmetric T in V1-V4; no ST elevation"),
      cell("LAD occlusion — STEMI equivalent; activate cath lab"),
    ]}),
    new TableRow({ children: [
      cell("Wellens Syndrome"),
      cell("Biphasic (Type A) or deep symmetric (Type B) T-wave inversion in V2-V3, pain-free"),
      cell("Critical LAD stenosis; pre-infarction warning"),
    ]}),
    new TableRow({ children: [
      cell("Posterior MI"),
      cell("ST depression + tall R in V1-V2 (R/S ≥1); confirm with V7-V9"),
      cell("Isolated posterior infarction; often missed on standard ECG"),
    ]}),
    new TableRow({ children: [
      cell("aVR Elevation"),
      cell("ST elevation in aVR ≥ 1 mm with diffuse ST depression"),
      cell("LMCA or proximal LAD occlusion / severe 3-vessel disease"),
    ]}),
    new TableRow({ children: [
      cell("Reciprocal Changes"),
      cell("ST depression in leads opposite the infarct zone"),
      cell("Strongly supports true STEMI vs pericarditis/early repolarization"),
    ]}),
  ],
});

// ─── TABLE: Differentials ─────────────────────────────────────────────────────
const diffTable = new Table({
  width: { size: 100, type: WidthType.PERCENTAGE },
  rows: [
    new TableRow({
      tableHeader: true,
      children: [
        headerCell("Mimic", ORANGE),
        headerCell("Key Distinguishing Feature", ORANGE),
      ],
    }),
    new TableRow({ children: [
      cell("Pericarditis"),
      cell("Diffuse concave (saddle-shaped) ST elevation; PR depression; no reciprocal changes; no Q waves"),
    ]}),
    new TableRow({ children: [
      cell("Early Repolarization"),
      cell("J-point elevation with notching; typically V2-V5; ST concave up; benign, no evolution"),
    ]}),
    new TableRow({ children: [
      cell("LVH"),
      cell("Strain pattern (asymmetric ST depression/T inversion) in lateral leads; voltage criteria met"),
    ]}),
    new TableRow({ children: [
      cell("Brugada Pattern"),
      cell("Pseudo-RBBB with coved (type 1) or saddle-back (type 2) ST elevation in V1-V2 only"),
    ]}),
    new TableRow({ children: [
      cell("Hyperkalemia"),
      cell("Peaked narrow T waves; widened QRS; sine wave pattern; PR prolongation"),
    ]}),
    new TableRow({ children: [
      cell("LBBB (baseline)"),
      cell("ST changes discordant to QRS; apply Sgarbossa criteria if MI suspected"),
    ]}),
    new TableRow({ children: [
      cell("Takotsubo (Stress) CMP"),
      cell("Anterior T-wave inversion + QTc prolongation; ballooning on echo; no culprit lesion"),
    ]}),
    new TableRow({ children: [
      cell("Aortic Dissection"),
      cell("May cause inferior STEMI if dissection extends to RCA ostium; beware before thrombolytics"),
    ]}),
  ],
});

// ─── Build document ──────────────────────────────────────────────────────────
const doc = new Document({
  creator: "Orris Medical Reference",
  title: "ECG in Myocardial Infarction - Quick Reference Guide",
  description: "A concise clinical reference for ECG localization of MI",
  styles: {
    default: {
      document: {
        run: { font: "Calibri", size: 20 },
      },
    },
  },
  sections: [
    {
      properties: {
        page: {
          margin: { top: 720, bottom: 720, left: 900, right: 900 },
        },
      },
      headers: {
        default: new Header({
          children: [
            new Paragraph({
              alignment: AlignmentType.RIGHT,
              children: [
                new TextRun({ text: "ECG in MI — Quick Reference Guide  |  ", size: 16, color: MED_GRAY, font: "Calibri" }),
                new TextRun({ text: "Based on Harrison's 22E & Tintinalli's Emergency Medicine", size: 16, color: MED_GRAY, italics: true, font: "Calibri" }),
              ],
            }),
          ],
        }),
      },
      footers: {
        default: new Footer({
          children: [
            new Paragraph({
              alignment: AlignmentType.CENTER,
              children: [
                new TextRun({ text: "Page ", size: 16, color: MED_GRAY, font: "Calibri" }),
                new TextRun({ children: [PageNumber.CURRENT], size: 16, color: MED_GRAY, font: "Calibri" }),
                new TextRun({ text: " of ", size: 16, color: MED_GRAY, font: "Calibri" }),
                new TextRun({ children: [PageNumber.TOTAL_PAGES], size: 16, color: MED_GRAY, font: "Calibri" }),
                new TextRun({ text: "  |  For clinical education only — not a substitute for clinical judgment", size: 16, color: MED_GRAY, italics: true, font: "Calibri" }),
              ],
            }),
          ],
        }),
      },
      children: [

        // ── PAGE 1: Title ─────────────────────────────────────────────────────
        title("ECG IN MYOCARDIAL INFARCTION"),
        subtitle("Quick Reference Guide for Localization, Diagnosis & Patterns"),
        spacer(160),

        // ── Section 1: Sequential Changes ────────────────────────────────────
        sectionHead("1. Sequential ECG Evolution in STEMI", DARK_RED),
        body("Ischemia creates currents of injury that produce predictable, time-dependent ECG changes:", { color: MED_GRAY }),
        spacer(80),
        sequenceTable,
        spacer(80),
        noteBox("A single normal ECG does NOT exclude MI. Repeat every 15–30 min if initial ECG is non-diagnostic and symptoms persist."),

        // ── Section 2: Localization ───────────────────────────────────────────
        sectionHead("2. MI Localization by Lead Distribution", RED),
        body("ST elevation in ≥2 contiguous leads in the distributions below indicates the affected territory:", { color: MED_GRAY }),
        spacer(80),
        localizationTable,
        spacer(80),
        warningBox("Inferior MI (II, III, aVF) — always obtain right-sided ECG (V3R–V6R). RV infarction is present in ~40% of inferior MIs. ST elevation in V4R is the most sensitive sign."),
        spacer(80),
        noteBox("True posterior MI has NO ST elevation on a standard 12-lead. Look for: tall R in V1-V2 (R/S ≥1, R >0.04s) + horizontal ST depression in V1-V3. Confirm with posterior leads V7–V9 (STE ≥0.5mm)."),

        pageBreak(),

        // ── PAGE 2 ───────────────────────────────────────────────────────────

        // ── Section 3: STEMI Criteria ─────────────────────────────────────────
        sectionHead("3. Standard STEMI Diagnostic Criteria", RED),
        body("New ST elevation at the J-point in ≥2 contiguous leads (thresholds vary by lead and sex):", { color: MED_GRAY }),
        spacer(80),
        criteriaTable,
        spacer(80),
        noteBox("New LBBB with ischemic symptoms = STEMI equivalent. Analyse with Sgarbossa criteria (see below)."),

        // ── Section 4: LBBB / Sgarbossa ──────────────────────────────────────
        sectionHead("4. MI in LBBB — Sgarbossa Criteria", PURPLE),
        body("LBBB causes secondary ST-T changes that mask ischemia. Use Sgarbossa score (≥3 = highly specific for MI):", { color: MED_GRAY }),
        spacer(80),
        sgarbossaTable,
        spacer(80),
        warningBox("New or presumably new LBBB in the context of chest pain = STEMI equivalent — activate cath lab without waiting for Sgarbossa score."),

        // ── Section 5: High-Risk / OMI Patterns ──────────────────────────────
        sectionHead("5. High-Risk Patterns & OMI Equivalents", GREEN),
        body("The traditional STEMI/NSTEMI binary misses ~25–40% of acute coronary occlusions. Recognise these OMI (Occlusion MI) patterns:", { color: MED_GRAY }),
        spacer(80),
        omiTable,
        spacer(80),
        noteBox("The OMI paradigm achieves ~80% sensitivity for acute coronary occlusion vs ~44% for standard STEMI criteria. When in doubt, repeat ECG, compare with prior, and consult cardiology urgently."),

        pageBreak(),

        // ── PAGE 3 ───────────────────────────────────────────────────────────

        // ── Section 6: NSTEMI ─────────────────────────────────────────────────
        sectionHead("6. NSTEMI / Ischaemia ECG Changes", BLUE),
        bulletBold("ST Depression: ", "Horizontal or downsloping ≥0.5 mm in ≥2 contiguous leads (upsloping is less specific)"),
        bulletBold("T-Wave Inversion: ", "Symmetric inversion ≥1 mm in leads with dominant R wave"),
        bulletBold("Dynamic changes: ", "New ST/T changes vs baseline are highly specific for ischaemia"),
        bulletBold("Normal ECG: ", "Does NOT exclude NSTEMI — serial troponins are mandatory"),
        spacer(80),
        warningBox("NSTEMI cannot be excluded on ECG alone. A normal ECG in the setting of typical symptoms still requires serial high-sensitivity troponins (0h/1h or 0h/2h rule-out protocols)."),

        // ── Section 7: Pathological Q Waves ──────────────────────────────────
        sectionHead("7. Pathological Q Waves", BLUE),
        body("Q waves develop from necrosis and loss of electrical depolarisation forces in infarcted myocardium:", { color: MED_GRAY }),
        bulletBold("Criteria: ", "Width ≥0.04 s (1 small square) AND depth ≥25% of following R wave"),
        bulletBold("Old concept: ", "Q waves = transmural infarction — this is no longer accurate"),
        bulletBold("Current view: ", "Q waves can occur in subendocardial infarcts; transmural infarcts may have no Q waves"),
        bulletBold("Regression: ", "Q waves may shrink or disappear over months in some patients"),
        bulletBold("Posterior / lateral MI: ", "Loss of depolarisation forces causes tall R in V1-V2 without Q waves in standard leads"),

        // ── Section 8: Differentials ──────────────────────────────────────────
        sectionHead("8. STEMI Mimics — Differential Diagnosis", ORANGE),
        body("Conditions that can produce ST elevation or Q waves without acute MI:", { color: MED_GRAY }),
        spacer(80),
        diffTable,

        pageBreak(),

        // ── PAGE 4: Quick Summary ─────────────────────────────────────────────

        // ── Section 9: Quick Lead Summary ────────────────────────────────────
        sectionHead("9. At-a-Glance: Lead Groups", DARK_RED),
        spacer(60),
        new Table({
          width: { size: 100, type: WidthType.PERCENTAGE },
          rows: [
            new TableRow({
              tableHeader: true,
              children: [
                headerCell("Lead Group", RED),
                headerCell("Leads", RED),
                headerCell("Region", RED),
              ],
            }),
            new TableRow({ children: [cell("Septal"), cell("V1, V2"), cell("Interventricular septum (LAD septal branches)")] }),
            new TableRow({ children: [cell("Anterior"), cell("V3, V4"), cell("Anterior LV wall (LAD)")] }),
            new TableRow({ children: [cell("Lateral"), cell("I, aVL, V5, V6"), cell("Lateral LV wall (LCx or diagonal)")] }),
            new TableRow({ children: [cell("Inferior"), cell("II, III, aVF"), cell("Inferior LV wall (RCA or LCx)")] }),
            new TableRow({ children: [cell("Right-sided"), cell("V3R, V4R, V5R, V6R"), cell("Right ventricle (proximal RCA)")] }),
            new TableRow({ children: [cell("Posterior"), cell("V7, V8, V9"), cell("Posterior LV wall (LCx or RCA-PL)")] }),
          ],
        }),
        spacer(120),

        // ── Section 10: Reciprocal Changes Summary ───────────────────────────
        sectionHead("10. Reciprocal ST Depression — Summary", BLUE),
        body("Reciprocal changes strongly favour true MI over pericarditis or early repolarisation.", { color: MED_GRAY }),
        spacer(80),
        new Table({
          width: { size: 100, type: WidthType.PERCENTAGE },
          rows: [
            new TableRow({
              tableHeader: true,
              children: [
                headerCell("Infarct Territory", RED),
                headerCell("Reciprocal Depression In", RED),
              ],
            }),
            new TableRow({ children: [cell("Anterior / Anterolateral"), cell("II, III, aVF")] }),
            new TableRow({ children: [cell("Inferior"), cell("I, aVL; often V1-V3")] }),
            new TableRow({ children: [cell("Posterior"), cell("Entire picture is reciprocal: STD + tall R in V1-V2")] }),
            new TableRow({ children: [cell("RV (inferior-right)"), cell("ST depression in lateral leads (I, aVL, V5-V6)")] }),
            new TableRow({ children: [cell("aVR elevation + diffuse STD"), cell("LMCA / proximal LAD occlusion")] }),
          ],
        }),
        spacer(120),

        // ── Section 11: Workflow ─────────────────────────────────────────────
        sectionHead("11. Clinical Workflow — Chest Pain with ECG", DARK_RED),
        bulletBold("Step 1: ", "Obtain 12-lead ECG within 10 min of arrival; interpret immediately"),
        bulletBold("Step 2: ", "Check for STEMI criteria (ST elevation in ≥2 contiguous leads)"),
        bulletBold("Step 3: ", "If inferior STEMI — obtain right-sided ECG (V4R for RV MI)"),
        bulletBold("Step 4: ", "If STD in V1-V3 with tall R — obtain posterior leads V7-V9"),
        bulletBold("Step 5: ", "If LBBB — apply Sgarbossa criteria; new LBBB = STEMI equivalent"),
        bulletBold("Step 6: ", "Check for OMI equivalents (de Winter, Wellens, hyperacute T, aVR elevation)"),
        bulletBold("Step 7: ", "If ECG non-diagnostic — repeat in 15-30 min; serial troponins mandatory"),
        bulletBold("Step 8: ", "If STEMI confirmed — activate cath lab; target door-to-balloon ≤90 min"),
        spacer(120),
        noteBox("Sources: Harrison's Principles of Internal Medicine 22E (2025, McGraw-Hill); Tintinalli's Emergency Medicine: A Comprehensive Study Guide, 9th Ed. | For educational use only."),

      ],
    },
  ],
});

Packer.toBuffer(doc).then(buf => {
  fs.writeFileSync("/home/daytona/workspace/ecg-mi-guide/ECG_MI_Reference_Guide.docx", buf);
  console.log("Done: ECG_MI_Reference_Guide.docx");
}).catch(err => {
  console.error("Error:", err);
  process.exit(1);
});
cd /home/daytona/workspace/ecg-mi-guide && node build.js 2>&1
python /home/daytona/skills/docx/scripts/office/validate.py /home/daytona/worksp…
python3 -c " import zipfile, sys path = '/home/daytona/workspace/ecg-mi-guide/EC…
python /home/daytona/skills/docx/scripts/office/soffice.py --headless --convert-…
soffice --headless --convert-to pdf --outdir /home/daytona/workspace/ecg-mi-guid…
chmod 777 /home/daytona/workspace/ecg-mi-guide/ && soffice --headless --convert-…
mkdir -p /home/daytona/workspace/ecg-out && cp /home/daytona/workspace/ecg-mi-gu…
python3 -c "import reportlab; print(reportlab.Version)"
~/ecg-mi-guide/build_pdf.py
from reportlab.lib.pagesizes import A4
from reportlab.lib import colors
from reportlab.lib.units import mm, cm
from reportlab.lib.styles import getSampleStyleSheet, ParagraphStyle
from reportlab.platypus import (
    SimpleDocTemplate, Paragraph, Spacer, Table, TableStyle, PageBreak,
    HRFlowable, KeepTogether
)
from reportlab.lib.enums import TA_LEFT, TA_CENTER, TA_RIGHT
from reportlab.platypus import Frame, PageTemplate
from reportlab.pdfgen import canvas as pdfcanvas

OUT = "/home/daytona/workspace/ecg-mi-guide/ECG_MI_Reference_Guide.pdf"

# ── Colours ───────────────────────────────────────────────────────────────────
C_DARKRED   = colors.HexColor("#922B21")
C_RED       = colors.HexColor("#C0392B")
C_LIGHTRED  = colors.HexColor("#FADBD8")
C_BLUE      = colors.HexColor("#1A5276")
C_LIGHTBLUE = colors.HexColor("#D6EAF8")
C_DARKGRAY  = colors.HexColor("#2C3E50")
C_MIDGRAY   = colors.HexColor("#566573")
C_LIGHTGRAY = colors.HexColor("#F2F3F4")
C_ORANGE    = colors.HexColor("#D35400")
C_LIGHTORANGE = colors.HexColor("#FDEBD0")
C_GREEN     = colors.HexColor("#1E8449")
C_LIGHTGREEN= colors.HexColor("#D5F5E3")
C_PURPLE    = colors.HexColor("#6C3483")
C_LIGHTPURPLE = colors.HexColor("#E8DAEF")
C_WHITE     = colors.white
C_BLACK     = colors.black

W, H = A4

# ── Styles ────────────────────────────────────────────────────────────────────
styles = getSampleStyleSheet()

def S(name, **kw):
    return ParagraphStyle(name, **kw)

TITLE_S = S("title_s", fontName="Helvetica-Bold", fontSize=22, textColor=C_WHITE,
             alignment=TA_CENTER, spaceAfter=2, spaceBefore=0)
SUBTITLE_S = S("subtitle_s", fontName="Helvetica-Oblique", fontSize=11, textColor=C_WHITE,
                alignment=TA_CENTER, spaceAfter=8)
SECHEAD_S = S("sechead_s", fontName="Helvetica-Bold", fontSize=13, textColor=C_WHITE,
               alignment=TA_LEFT, spaceAfter=4, spaceBefore=10,
               leftIndent=6)
BODY_S = S("body_s", fontName="Helvetica", fontSize=9.5, textColor=C_DARKGRAY,
            spaceAfter=3, spaceBefore=2, leading=13)
BODYBOLD_S = S("bodybold_s", fontName="Helvetica-Bold", fontSize=9.5, textColor=C_DARKGRAY,
               spaceAfter=3, spaceBefore=2, leading=13)
NOTE_S = S("note_s", fontName="Helvetica-Oblique", fontSize=8.5, textColor=C_BLUE,
            leftIndent=8, rightIndent=8, spaceAfter=4, spaceBefore=4, leading=12)
WARN_S = S("warn_s", fontName="Helvetica-Bold", fontSize=8.5, textColor=C_ORANGE,
            leftIndent=8, rightIndent=8, spaceAfter=4, spaceBefore=4, leading=12)
CELL_S = S("cell_s", fontName="Helvetica", fontSize=8.5, textColor=C_DARKGRAY, leading=12)
CELLB_S = S("cellb_s", fontName="Helvetica-Bold", fontSize=8.5, textColor=C_WHITE, leading=12,
             alignment=TA_CENTER)
CELLBG_S = S("cellbg_s", fontName="Helvetica-Bold", fontSize=8.5, textColor=C_WHITE, leading=12)
FOOTER_S = S("footer_s", fontName="Helvetica", fontSize=7, textColor=C_MIDGRAY,
              alignment=TA_CENTER)

# ── Helpers ───────────────────────────────────────────────────────────────────
def title_block(main, sub):
    tbl = Table(
        [[Paragraph(main, TITLE_S)], [Paragraph(sub, SUBTITLE_S)]],
        colWidths=[W - 4*cm]
    )
    tbl.setStyle(TableStyle([
        ("BACKGROUND", (0,0), (-1,0), C_DARKRED),
        ("BACKGROUND", (0,1), (-1,1), C_RED),
        ("TOPPADDING", (0,0), (-1,-1), 8),
        ("BOTTOMPADDING", (0,0), (-1,-1), 8),
        ("LEFTPADDING", (0,0), (-1,-1), 12),
        ("RIGHTPADDING", (0,0), (-1,-1), 12),
    ]))
    return tbl

def sec_head(text, bg=C_BLUE):
    tbl = Table([[Paragraph(text.upper(), SECHEAD_S)]], colWidths=[W - 4*cm])
    tbl.setStyle(TableStyle([
        ("BACKGROUND", (0,0), (-1,-1), bg),
        ("TOPPADDING", (0,0), (-1,-1), 5),
        ("BOTTOMPADDING", (0,0), (-1,-1), 5),
        ("LEFTPADDING", (0,0), (-1,-1), 8),
    ]))
    return tbl

def note_box(text, bg=C_LIGHTBLUE, border=C_BLUE, style=NOTE_S):
    tbl = Table([[Paragraph(text, style)]], colWidths=[W - 4*cm])
    tbl.setStyle(TableStyle([
        ("BACKGROUND", (0,0), (-1,-1), bg),
        ("BOX", (0,0), (-1,-1), 1.2, border),
        ("TOPPADDING", (0,0), (-1,-1), 6),
        ("BOTTOMPADDING", (0,0), (-1,-1), 6),
        ("LEFTPADDING", (0,0), (-1,-1), 8),
        ("RIGHTPADDING", (0,0), (-1,-1), 8),
    ]))
    return tbl

def warn_box(text):
    return note_box("⚠  " + text, bg=C_LIGHTORANGE, border=C_ORANGE, style=WARN_S)

def sp(h=6):
    return Spacer(1, h)

def hcell(text, bg=C_BLUE):
    return Paragraph(text, CELLB_S)

def dcell(text, bold=False):
    s = CELLB_S if bold else CELL_S
    return Paragraph(text, s)

def make_table(headers, rows, header_bg=C_RED, col_widths=None, stripe=True):
    col_w = W - 4*cm
    n_cols = len(headers)
    if col_widths is None:
        col_widths = [col_w / n_cols] * n_cols

    data = [[Paragraph(h, CELLB_S) for h in headers]]
    for row in rows:
        data.append([Paragraph(str(c), CELL_S) for c in row])

    style_cmds = [
        ("BACKGROUND", (0, 0), (-1, 0), header_bg),
        ("ROWBACKGROUNDS", (0, 1), (-1, -1), [C_LIGHTGRAY, C_WHITE] if stripe else [C_WHITE]),
        ("GRID", (0, 0), (-1, -1), 0.3, C_MIDGRAY),
        ("VALIGN", (0, 0), (-1, -1), "MIDDLE"),
        ("TOPPADDING", (0, 0), (-1, -1), 5),
        ("BOTTOMPADDING", (0, 0), (-1, -1), 5),
        ("LEFTPADDING", (0, 0), (-1, -1), 5),
        ("RIGHTPADDING", (0, 0), (-1, -1), 5),
        ("FONTNAME", (0, 0), (-1, 0), "Helvetica-Bold"),
        ("FONTSIZE", (0, 0), (-1, -1), 8.5),
    ]
    tbl = Table(data, colWidths=col_widths, repeatRows=1)
    tbl.setStyle(TableStyle(style_cmds))
    return tbl

def bullet_row(label, rest, label_color=C_RED):
    return Paragraph(
        f'<bullet>\u2022</bullet><font name="Helvetica-Bold" color="#{label_color.hexval()[1:]}">{label}</font>'
        f'<font name="Helvetica">{rest}</font>',
        ParagraphStyle("br", fontName="Helvetica", fontSize=9.5, textColor=C_DARKGRAY,
                        leftIndent=14, firstLineIndent=-10, spaceAfter=3, leading=13)
    )

# ── Content ───────────────────────────────────────────────────────────────────
story = []

# Title
story.append(title_block(
    "ECG IN MYOCARDIAL INFARCTION",
    "Quick Reference Guide — Localization, Diagnosis & Patterns"
))
story.append(sp(10))

# ── 1. Sequential Evolution ──────────────────────────────────────────────────
story.append(sec_head("1. Sequential ECG Evolution in STEMI", C_DARKRED))
story.append(sp(4))
story.append(Paragraph(
    "Ischemia creates currents of injury producing predictable, time-dependent ECG changes:", BODY_S))
story.append(sp(4))

story.append(make_table(
    ["Stage", "Timing", "ECG Changes"],
    [
        ["Hyperacute", "Minutes", "Tall, broad, peaked (asymmetric, bulky) T waves — earliest sign"],
        ["Acute Injury", "Minutes to hours", "ST elevation (convex/tombstone upward); T waves still upright"],
        ["Evolving", "Hours to days", "T-wave inversion in same leads; Q waves begin to form"],
        ["Old / Subacute", "Days to weeks", "Deep Q waves + persistent T-wave inversion; ST may normalize"],
        ["Chronic", "Weeks to months", "Persistent Q waves; ST/T may normalize or remain abnormal"],
    ],
    header_bg=C_DARKRED,
    col_widths=[3.5*cm, 4*cm, (W - 4*cm - 7.5*cm)]
))
story.append(sp(6))
story.append(note_box(
    "A single normal ECG does NOT exclude MI. Repeat every 15–30 min if initial ECG is non-diagnostic and symptoms persist."
))
story.append(sp(8))

# ── 2. Localization Table ─────────────────────────────────────────────────────
story.append(sec_head("2. MI Localization by Lead Distribution", C_RED))
story.append(sp(4))
story.append(Paragraph(
    "ST elevation in ≥2 contiguous leads in these distributions indicates the affected territory:", BODY_S))
story.append(sp(4))

pw = W - 4*cm
story.append(make_table(
    ["Territory", "ST Elevation Leads", "Reciprocal Changes", "Culprit Artery"],
    [
        ["Anteroseptal", "V1, V2 (± V3)", "II, III, aVF (variable)", "LAD — proximal septal branches"],
        ["Anterior", "V1 – V4", "II, III, aVF", "LAD (mid)"],
        ["Anterolateral", "V1 – V6, I, aVL", "II, III, aVF", "LAD (proximal) or LCx"],
        ["Lateral", "I, aVL (± V5, V6)", "II, III, aVF", "LCx or diagonal (D1)"],
        ["Inferior", "II, III, aVF", "I, aVL; V1–V3", "RCA (80%) or LCx (20%)"],
        ["Inferolateral", "II, III, aVF, V5, V6", "I, aVL, V1–V3", "Dominant RCA or LCx"],
        ["True Posterior", "None in standard leads", "STD + tall R in V1–V2 (R/S ≥1, R >0.04 s)", "LCx or RCA-PL branch"],
        ["Right Ventricular", "II, III, aVF + V3R–V6R", "ST depression lateral leads", "Proximal RCA"],
    ],
    header_bg=C_RED,
    col_widths=[3.2*cm, 3.8*cm, 4.5*cm, (pw - 11.5*cm)]
))
story.append(sp(6))
story.append(warn_box(
    "Inferior MI (II, III, aVF) — always obtain right-sided ECG (V3R–V6R). RV infarction is present in ~40% of inferior MIs. "
    "ST elevation in V4R is the most sensitive single sign."
))
story.append(sp(4))
story.append(note_box(
    "True Posterior MI has NO ST elevation on standard 12-lead. Look for: tall R in V1–V2 + horizontal ST depression in V1–V3. "
    "Confirm with posterior leads V7–V9 (STE ≥0.5 mm)."
))

story.append(PageBreak())

# ── 3. STEMI Criteria ─────────────────────────────────────────────────────────
story.append(sec_head("3. Standard STEMI Diagnostic Criteria (J-Point Elevation in ≥2 Contiguous Leads)", C_RED))
story.append(sp(4))
story.append(make_table(
    ["Leads", "Men < 40 yrs", "Men ≥ 40 yrs", "Women (any age)"],
    [
        ["V2 – V3", "≥ 2.5 mm", "≥ 2.0 mm", "≥ 1.5 mm"],
        ["All other leads", "≥ 1.0 mm", "≥ 1.0 mm", "≥ 1.0 mm"],
        ["V3R / V4R (RV MI)", "≥ 0.5 mm", "≥ 0.5 mm", "≥ 0.5 mm"],
        ["V7 – V9 (Posterior)", "≥ 0.5 mm", "≥ 0.5 mm", "≥ 0.5 mm"],
    ],
    header_bg=C_RED,
    col_widths=[4.5*cm, 3.5*cm, 3.5*cm, (pw - 11.5*cm)]
))
story.append(sp(5))
story.append(note_box(
    "New LBBB with ischemic symptoms = STEMI equivalent. Analyse with Sgarbossa criteria (see below). "
    "New or presumably new LBBB in context of chest pain — activate cath lab."
))
story.append(sp(8))

# ── 4. Sgarbossa ──────────────────────────────────────────────────────────────
story.append(sec_head("4. MI in LBBB — Sgarbossa Criteria", C_PURPLE))
story.append(sp(4))
story.append(Paragraph("LBBB masks ischaemia. Use Sgarbossa score (≥3 points = highly specific for MI):", BODY_S))
story.append(sp(4))
story.append(make_table(
    ["Criterion", "ECG Finding", "Score"],
    [
        ["1 — Concordant STE", "ST elevation ≥1 mm in leads with predominantly positive QRS", "5 pts"],
        ["2 — Concordant STD", "ST depression ≥1 mm in V1, V2, or V3", "3 pts"],
        ["3 — Discordant STE (original)", "Excessively discordant ST elevation ≥5 mm", "2 pts"],
        ["Modified criterion 3 (Smith)", "ST/S ratio > 0.25 — more sensitive than absolute 5 mm", "—"],
        ["Interpretation", "Score ≥ 3 = highly specific for MI in LBBB context", ""],
    ],
    header_bg=C_PURPLE,
    col_widths=[4.5*cm, 9*cm, (pw - 13.5*cm)]
))
story.append(sp(8))

# ── 5. OMI Patterns ───────────────────────────────────────────────────────────
story.append(sec_head("5. High-Risk Patterns & OMI Equivalents", C_GREEN))
story.append(sp(4))
story.append(Paragraph(
    "The STEMI/NSTEMI binary misses ~25–40% of acute coronary occlusions. Recognise these OMI (Occlusion MI) patterns:", BODY_S))
story.append(sp(4))
story.append(make_table(
    ["Pattern", "ECG Finding", "Significance"],
    [
        ["Hyperacute T waves", "Broad, bulky, asymmetric T waves; taller than normal", "Earliest sign of STEMI — precedes ST elevation"],
        ["de Winter T waves", "Upsloping ST depression + tall symmetric T in V1–V4; NO ST elevation", "LAD occlusion — STEMI equivalent; activate cath lab"],
        ["Wellens Syndrome", "Biphasic (Type A) or deep symmetric (Type B) T-wave inversion V2–V3, in pain-free state", "Critical LAD stenosis; pre-infarction warning"],
        ["Posterior MI", "ST depression + tall R in V1–V2 (R/S ≥1); confirm V7–V9", "Isolated posterior infarction — often missed"],
        ["aVR Elevation", "STE in aVR ≥1 mm + diffuse ST depression in other leads", "LMCA or proximal LAD occlusion / severe 3-vessel disease"],
        ["Reciprocal Changes", "ST depression in leads electrically opposite the infarct zone", "Strongly supports true STEMI vs pericarditis / early repolarisation"],
    ],
    header_bg=C_GREEN,
    col_widths=[3.5*cm, 6.5*cm, (pw - 10*cm)]
))
story.append(sp(5))
story.append(note_box(
    "OMI paradigm achieves ~80% sensitivity for acute coronary occlusion vs ~44% for standard STEMI criteria. "
    "When in doubt, repeat ECG, compare with prior, and consult cardiology urgently."
))

story.append(PageBreak())

# ── 6. NSTEMI ─────────────────────────────────────────────────────────────────
story.append(sec_head("6. NSTEMI / Ischaemia ECG Changes", C_BLUE))
story.append(sp(4))
story.append(bullet_row("ST Depression: ", "Horizontal or downsloping ≥0.5 mm in ≥2 contiguous leads (upsloping is less specific)"))
story.append(bullet_row("T-Wave Inversion: ", "Symmetric ≥1 mm in leads with dominant R wave"))
story.append(bullet_row("Dynamic changes: ", "New ST/T changes vs baseline are highly specific for ischaemia"))
story.append(bullet_row("Normal ECG: ", "Does NOT exclude NSTEMI — serial high-sensitivity troponins mandatory"))
story.append(sp(5))
story.append(warn_box(
    "NSTEMI cannot be excluded on ECG alone. Normal ECG + typical symptoms still requires serial hs-troponin "
    "(0h/1h or 0h/2h rule-out protocols per ESC/ACC)."
))
story.append(sp(8))

# ── 7. Q Waves ───────────────────────────────────────────────────────────────
story.append(sec_head("7. Pathological Q Waves", C_BLUE))
story.append(sp(4))
story.append(bullet_row("Criteria: ", "Width ≥0.04 s (1 small square) AND depth ≥25% of following R wave"))
story.append(bullet_row("Old concept: ", "Q waves = transmural infarction — this is no longer accurate"))
story.append(bullet_row("Current view: ", "Q waves can occur in subendocardial infarcts; transmural infarcts may have no Q waves"))
story.append(bullet_row("Regression: ", "Q waves may shrink or disappear over months in some patients"))
story.append(bullet_row("Posterior/lateral MI: ", "Loss of forces causes tall R in V1–V2 without Q waves in standard leads"))
story.append(sp(8))

# ── 8. Differentials ─────────────────────────────────────────────────────────
story.append(sec_head("8. STEMI Mimics — Differential Diagnosis", C_ORANGE))
story.append(sp(4))
story.append(make_table(
    ["Mimic", "Key Distinguishing Feature"],
    [
        ["Pericarditis", "Diffuse concave (saddle-shaped) STE; PR depression; NO reciprocal changes; no Q waves"],
        ["Early Repolarisation", "J-point elevation with notching in V2–V5; concave ST; benign, no evolution"],
        ["LVH", "Strain pattern (asymmetric STD/T-inversion) in lateral leads; voltage criteria met"],
        ["Brugada Pattern", "Pseudo-RBBB with coved (type 1) or saddle-back (type 2) STE in V1–V2 only"],
        ["Hyperkalemia", "Peaked narrow T waves; widened QRS; sine wave pattern; PR prolongation"],
        ["LBBB (baseline)", "ST changes discordant to QRS; apply Sgarbossa criteria if MI suspected"],
        ["Takotsubo (Stress) CMP", "Anterior T-inversion + QTc prolongation; apical ballooning on echo; no culprit lesion"],
        ["Aortic Dissection", "May cause inferior STEMI if dissection extends to RCA ostium; rule out before thrombolytics"],
    ],
    header_bg=C_ORANGE,
    col_widths=[4.5*cm, (pw - 4.5*cm)]
))

story.append(PageBreak())

# ── 9. Lead Groups ───────────────────────────────────────────────────────────
story.append(sec_head("9. At-a-Glance: Lead Groups", C_DARKRED))
story.append(sp(4))
story.append(make_table(
    ["Lead Group", "Leads", "Region Viewed"],
    [
        ["Septal", "V1, V2", "Interventricular septum (LAD septal branches)"],
        ["Anterior", "V3, V4", "Anterior LV wall (LAD diagonal)"],
        ["Lateral", "I, aVL, V5, V6", "Lateral LV wall (LCx or diagonal)"],
        ["Inferior", "II, III, aVF", "Inferior LV wall (RCA or LCx)"],
        ["Right-sided", "V3R, V4R, V5R, V6R", "Right ventricle (proximal RCA)"],
        ["Posterior", "V7, V8, V9", "Posterior LV wall (LCx or RCA-posterolateral)"],
    ],
    header_bg=C_DARKRED,
    col_widths=[3.5*cm, 4*cm, (pw - 7.5*cm)]
))
story.append(sp(10))

# ── 10. Reciprocal Summary ───────────────────────────────────────────────────
story.append(sec_head("10. Reciprocal ST Depression — Summary", C_BLUE))
story.append(sp(4))
story.append(Paragraph(
    "Reciprocal changes strongly favour true MI over pericarditis or early repolarisation.", BODY_S))
story.append(sp(4))
story.append(make_table(
    ["Infarct Territory", "Reciprocal Depression In"],
    [
        ["Anterior / Anterolateral", "II, III, aVF"],
        ["Inferior", "I, aVL; often V1–V3"],
        ["Posterior", "Entire picture IS reciprocal: STD + tall R in V1–V2"],
        ["RV (inferior-right)", "ST depression in lateral leads (I, aVL, V5–V6)"],
        ["aVR elevation + diffuse STD", "Suggests LMCA / proximal LAD occlusion"],
    ],
    header_bg=C_BLUE,
    col_widths=[5*cm, (pw - 5*cm)]
))
story.append(sp(10))

# ── 11. Clinical Workflow ─────────────────────────────────────────────────────
story.append(sec_head("11. Clinical Workflow — Chest Pain with Suspected MI", C_DARKRED))
story.append(sp(4))
steps = [
    ("Step 1:", "Obtain 12-lead ECG within 10 min of arrival; interpret immediately"),
    ("Step 2:", "Check for STEMI criteria (ST elevation in ≥2 contiguous leads per thresholds above)"),
    ("Step 3:", "If inferior STEMI — obtain right-sided ECG (V4R for RV MI)"),
    ("Step 4:", "If STD in V1–V3 with tall R wave — obtain posterior leads V7–V9"),
    ("Step 5:", "If LBBB — apply Sgarbossa criteria; new LBBB = STEMI equivalent"),
    ("Step 6:", "Check for OMI equivalents: de Winter, Wellens, hyperacute T, aVR elevation"),
    ("Step 7:", "If ECG non-diagnostic — repeat in 15–30 min; serial hs-troponins mandatory"),
    ("Step 8:", "If STEMI confirmed — activate cath lab; target door-to-balloon ≤90 min"),
]
for label, text in steps:
    story.append(bullet_row(label + " ", text))

story.append(sp(10))
story.append(note_box(
    "Sources: Harrison's Principles of Internal Medicine, 22nd Edition (2025, McGraw-Hill Medical) | "
    "Tintinalli's Emergency Medicine: A Comprehensive Study Guide, 9th Edition. "
    "For clinical education only — not a substitute for clinical judgement."
))

# ── Build PDF ─────────────────────────────────────────────────────────────────
def on_page(canvas, doc):
    canvas.saveState()
    canvas.setFont("Helvetica", 7)
    canvas.setFillColor(C_MIDGRAY)
    # Header line
    canvas.drawRightString(W - 2*cm, H - 1.2*cm,
        "ECG in MI — Quick Reference Guide  |  Harrison's 22E & Tintinalli's EM")
    canvas.line(2*cm, H - 1.4*cm, W - 2*cm, H - 1.4*cm)
    # Footer line
    canvas.line(2*cm, 1.5*cm, W - 2*cm, 1.5*cm)
    canvas.drawCentredString(W / 2, 1.0*cm,
        f"Page {doc.page}  |  For educational use only — not a substitute for clinical judgment")
    canvas.restoreState()

doc = SimpleDocTemplate(
    OUT,
    pagesize=A4,
    leftMargin=2*cm,
    rightMargin=2*cm,
    topMargin=1.8*cm,
    bottomMargin=2*cm,
    title="ECG in Myocardial Infarction — Quick Reference Guide",
    author="Orris Medical Reference",
    subject="ECG localization of MI",
)
doc.build(story, onFirstPage=on_page, onLaterPages=on_page)
print("Done:", OUT)
python3 /home/daytona/workspace/ecg-mi-guide/build_pdf.py 2>&1
~/ecg-mi-guide/build_pdf.py
Successfully replaced 1 instance(s) of the string in '/home/daytona/workspace/ecg-mi-guide/build_pdf.py'
python3 /home/daytona/workspace/ecg-mi-guide/build_pdf.py 2>&1
ls -lh /home/daytona/workspace/ecg-mi-guide/
- (15 KB, 4 pages)
ECG MI Reference Guide
PDF Document · PDF
- (17 KB, fully editable)
ECG MI Reference Guide
Word Document · DOCX
| Section | Content |
|---|---|
| 1 | Sequential ECG evolution in STEMI (hyperacute → chronic) |
| 2 | MI localization table — territory, ST elevation leads, reciprocal leads, culprit artery |
| 3 | Standard STEMI diagnostic criteria (sex/age-specific thresholds) |
| 4 | Sgarbossa criteria for MI in LBBB |
| 5 | OMI equivalents — de Winter, Wellens, posterior MI, aVR elevation |
| 6 | NSTEMI / ischaemia ECG changes |
| 7 | Pathological Q waves |
| 8 | STEMI mimics (pericarditis, Brugada, LVH, takotsubo, etc.) |
| 9–10 | At-a-glance lead groups + reciprocal changes summary |
| 11 | 8-step clinical workflow for chest pain with ECG |