
Ecg
What would you like to know about ECG?
Give all above
ECG components waves P QRS T normal electrocardiogram
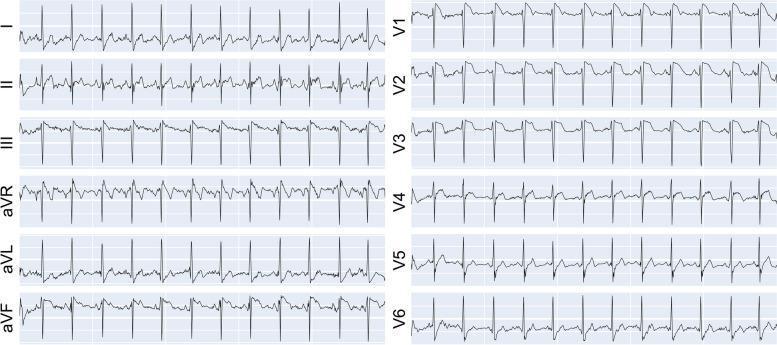
A standard 12-lead electrocardiogram (ECG) tracing presented in a 2x6 grid format. The left column displays the limb leads (I, II, III, aVR, aVL, and aVF), while the right column shows the precordial leads (V1 through V6). The image illustrates a synthesized normal cardiac rhythm with clearly identifiable waveform components: P waves representing atrial depolarization, narrow QRS complexes indicating ventricular depolarization, and T waves representing ventricular repolarization. The isoelectric lines are stable, and the R-R intervals are regular, suggesting a normal sinus rhythm. Lead II shows upright P waves and a predominant R wave, while lead aVR shows the expected global inversion. The precordial leads (V1-V6) demonstrate normal R-wave progression from right-to-left across the chest. This visual is used to teach basic ECG interpretation, waveform morphology recognition, and the spatial arrangement of cardiac electrical vectors in clinical cardiology.
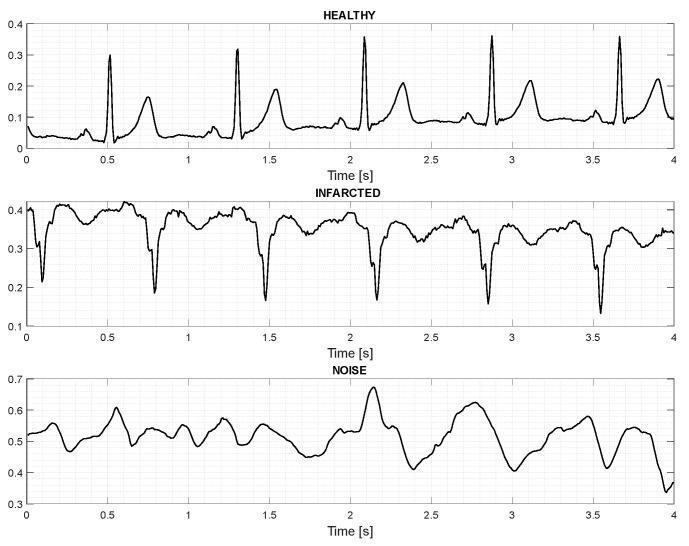
This diagnostic image displays a comparison chart of three separate electrocardiogram (ECG) waveforms over a 4-second time window, categorized as 'Healthy', 'Infarcted', and 'Noise'. The 'Healthy' trace exhibits a physiological sinus rhythm characterized by repeating, well-defined P-waves, narrow QRS complexes (peaking at ~0.35 mV), and distinct T-waves. The 'Infarcted' trace shows significant morphological alterations, including a shift in baseline and deep, irregular downward deflections suggestive of pathological Q-waves or significant ST-segment deviations associated with myocardial infarction. The 'Noise' trace illustrates a chaotic signal with high-frequency artifacts and wandering baseline (amplitude 0.35-0.65 mV), where no discernible cardiac components (P-QRS-T) are present. This visual comparison is utilized in medical signal processing and neural network training for automated cardiac event detection and signal quality assessment, highlighting the distinctive temporal and morphological features used to differentiate normal cardiac activity from ischemic events and signal interference.
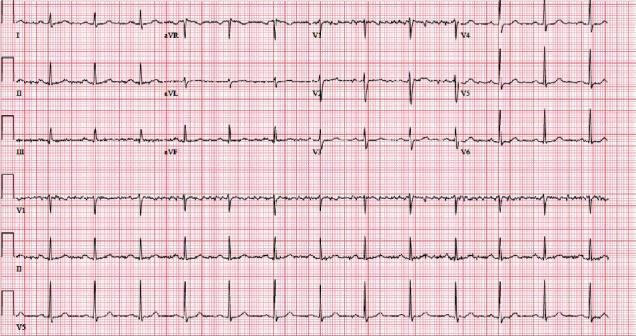
A standard 12-lead electrocardiogram (ECG) displayed on a pink grid background. The tracing represents a normal sinus rhythm. Key visible features include a regular atrial and ventricular rate with a consistent 1:1 P-to-QRS relationship. The P waves are upright in leads I, II, and aVF, and inverted in aVR, indicating a normal sinus axis. The PR interval is within the normal physiological range (approximately 176 ms). QRS complexes exhibit normal morphology and duration without significant axis deviation or pathological Q waves. R-wave progression across precordial leads V1-V6 is appropriate, with the transition occurring between V3 and V4. T waves are upright and symmetrical in the limb and lateral precordial leads. This diagnostic image serves as a baseline comparison for clinical scenarios such as drug-induced bradycardia or cardiovascular monitoring in critical care settings. It illustrates the fundamental components of a healthy cardiac conduction cycle for medical students and clinicians.
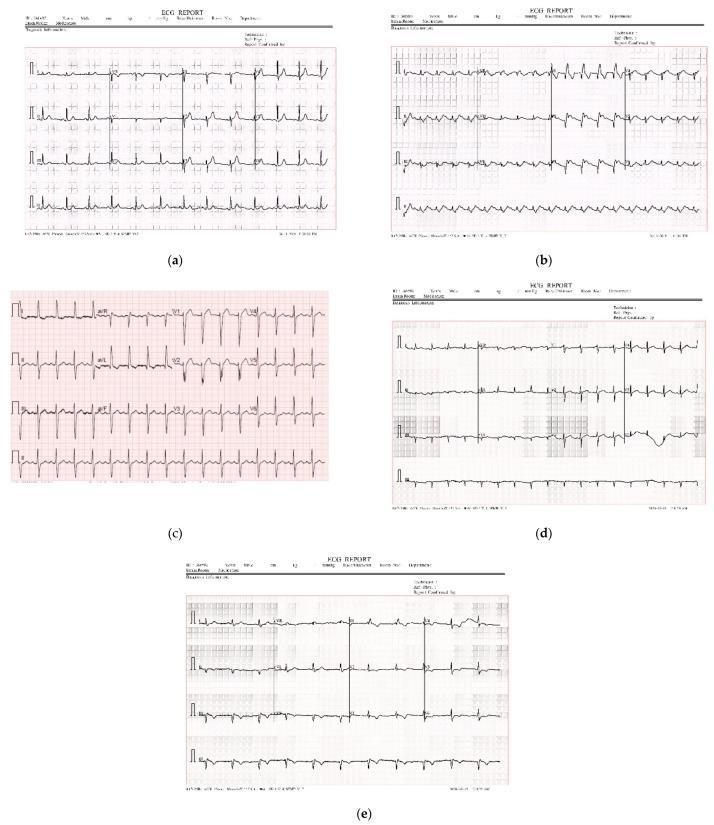
A composite diagnostic image featuring five paper-based 12-lead electrocardiogram (ECG) reports (labeled a through e). The collection demonstrates varying cardiac conditions including Normal Heart Beat (NHB), Myocardial Infarction (MI), COVID-19, Abnormal Heart Beat (AHB), and History of Myocardial Infarction (HMI). Each report displays the standard 12-lead arrangement—I, II, III, aVR, aVL, aVF, and V1-V6—plotted on standard pink or gray grid paper. The visuals exhibit typical ECG components: P waves, QRS complexes, and T waves. The dataset illustrates common challenges in digitizing paper-based medical records, such as varying signal-to-noise ratios, differences in contrast between the waveform and background grid, baseline wander, and potential artifacts from scanning. These images serve as educational materials for clinical cardiology and provide a basis for developing deep learning algorithms for automated cardiac disease classification and digital signal preprocessing.
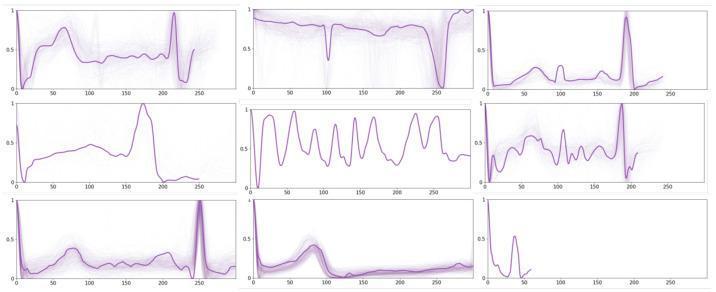
This Comparison Chart displays nine individual subplots of ECG (electrocardiogram) prototypes, representing various cardiac rhythms and wave morphologies. Each plot uses a normalized scale with the x-axis representing time (0–250 units) and the y-axis representing amplitude (0.0–1.0). The purple waveforms illustrate a range of diagnostic features, including normal sinus rhythm components and pathological variations. Key morphological features shown across the prototypes include variations in P-wave presence and width, QRS complex configurations (ranging from narrow and sharp to widened and deformed), and T-wave abnormalities. Specifically, the central prototype displays irregular, high-frequency oscillations characteristic of atrial fibrillation (AF), while other panels demonstrate conduction disturbances via supplementary peaks, ST-segment deviations, and inverted or heightened T-waves. These prototypes serve as educational models for clinical rhythm identification, highlighting differentiating features between normal cardiac cycles and various arrhythmias or ischemic states.
ECG myocardial infarction ST elevation MI STEMI leads
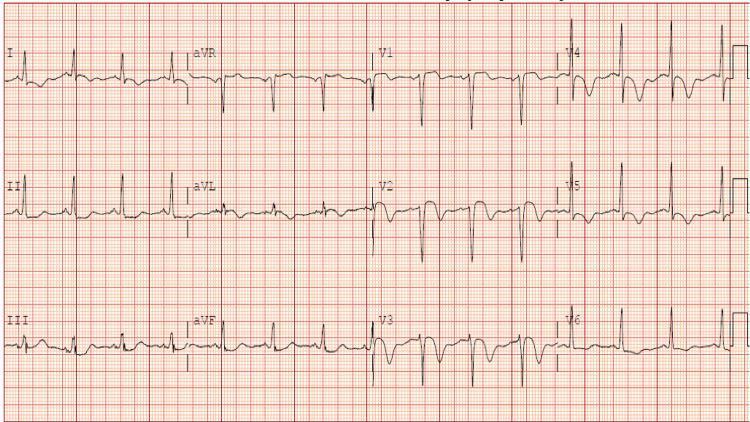
A 12-lead electrocardiogram (ECG) tracing presented on a standard grid format. The tracing demonstrates a regular sinus rhythm with visible P waves preceding each QRS complex. Significant diagnostic findings include ST-segment elevation predominantly visible in the precordial leads (V1-V4), suggesting acute myocardial injury. Additionally, there are prominent, symmetric T-wave inversions observed across the precordial leads (V1-V6) and lateral leads (I, aVL), which are often indicative of myocardial ischemia or reperfusion. The QRS complexes are relatively narrow with normal morphology, and the electrical axis is unremarkable. This ECG illustrates a typical presentation of acute coronary syndrome (ACS) or myocardial infarction (MI) affecting the anterior and lateral walls of the heart. The material is suitable for cardiovascular education focusing on the recognition of ST-elevation myocardial infarction (STEMI) patterns and ischemic T-wave changes.
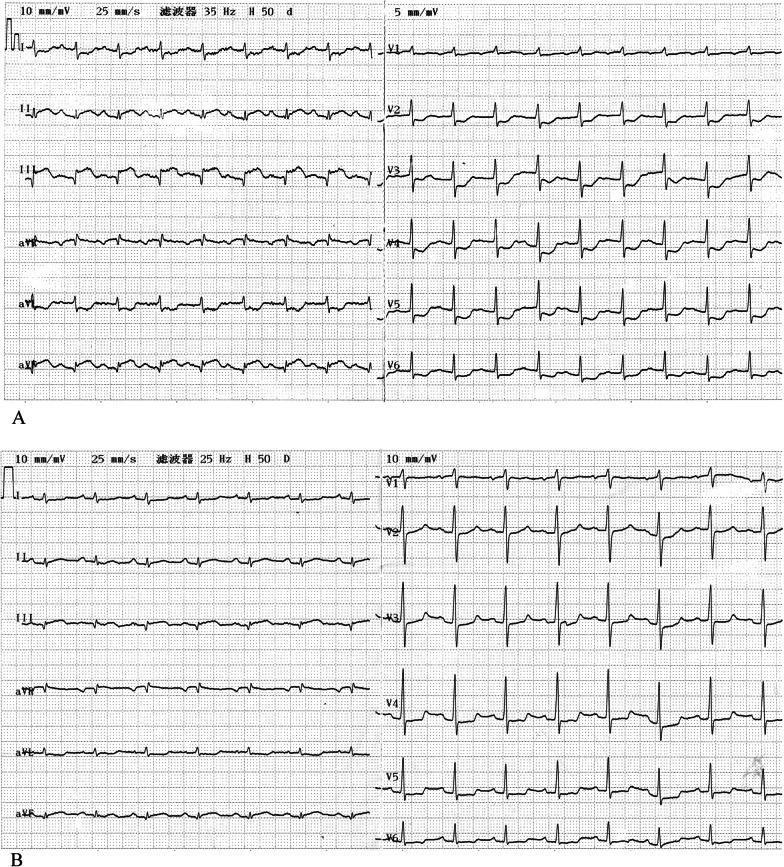
This diagnostic image consists of two 12-lead electrocardiograms (ECGs) labeled A and B, demonstrating the evolution of an acute inferior myocardial infarction (MI). Figure A shows a baseline ECG upon admission with sinus tachycardia (approximately 113 bpm). Significant findings include ST-segment elevation in the inferior leads (II, III, and aVF) accompanied by prominent pathologic Q-waves, indicative of acute transmural ischemia in the right coronary artery (RCA) territory. Reciprocal ST-segment depression is also visible in several precordial leads. Figure B displays the follow-up ECG after primary percutaneous coronary intervention (PCI). This panel demonstrates a notable attenuation of the ST-segment elevation toward the baseline and a reduction in the depth of the pathologic Q-waves, signifying successful reperfusion and resolution of the acute injury phase. The comparison illustrates the classic electrocardiographic sequence of successful intervention for an ST-elevation myocardial infarction (STEMI).
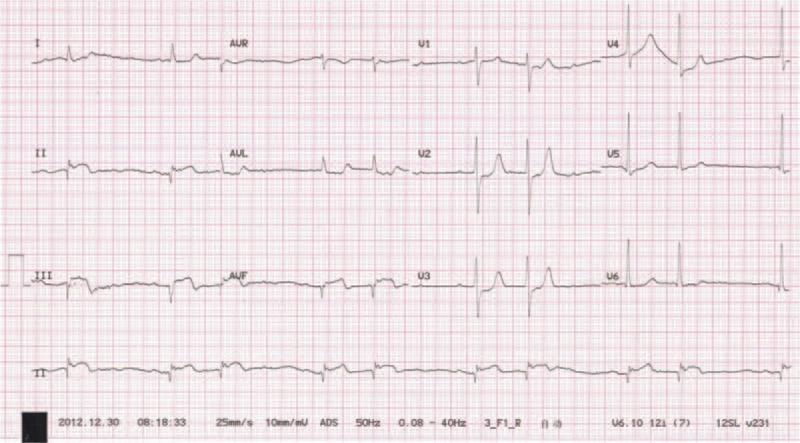
A 12-lead diagnostic electrocardiogram (ECG) tracing displaying classic signs of an inferior wall myocardial infarction (MI). The tracing exhibits significant convex-upwards ST-segment elevation (Pardee waves) and T-wave inversions in the inferior leads (II, III, and aVF). Notably, deep and wide pathological Q waves are present in these same leads, suggesting myocardial necrosis or a completed infarction sequence. Additionally, the rhythm strip demonstrates evidence of a second-degree atrioventricular (AV) block, characterized by a non-conducted P wave following a consistent PR interval pattern. Reciprocal ST-segment depression is visible in the lateral leads (I, aVL), a common finding in acute inferior ST-elevation myocardial infarction (STEMI). This visual provides critical educational evidence for diagnosing coronary artery occlusion, specifically involving the right coronary artery (RCA) or left circumflex artery, and illustrates the potential conduction system complications associated with inferior wall damage.
ECG arrhythmia atrial fibrillation heart block bundle branch
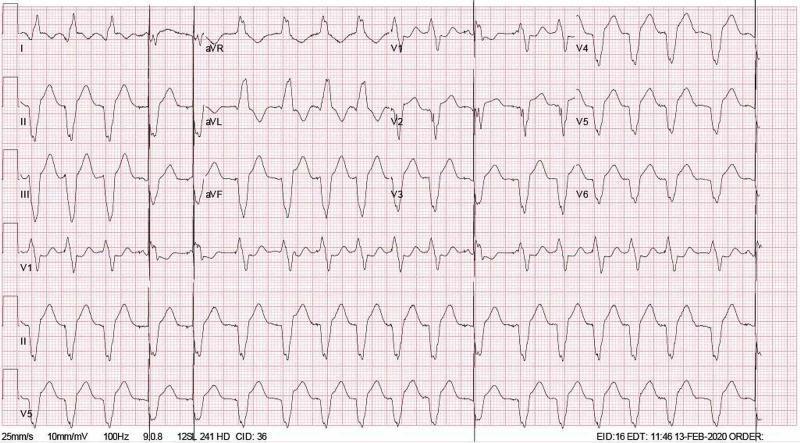
A standard 12-lead electrocardiogram (ECG) demonstrating a ventricular paced rhythm, consistent with Cardiac Resynchronization Therapy (CRT). The tracing shows a regular rhythm at a rate of approximately 111 beats per minute. Each QRS complex is preceded by a distinct, sharp vertical pacemaker spike, most visible in the inferior leads (II, III, aVF) and precordial leads (V1-V6). The QRS complexes are wide (prolonged duration) and exhibit a left bundle branch block-like morphology, common in biventricular pacing. There is an absence of discernible native P waves before the pacing spikes, suggesting either atrial pacing with a programmed AV delay or an underlying atrial arrhythmia like atrial fibrillation with a paced ventricular response. ST-segment and T-wave changes are present, which are secondary to the abnormal ventricular depolarization pattern. This ECG is a key diagnostic tool for evaluating pacemaker function and captured cardiac response in patients with heart failure and conduction system disease.
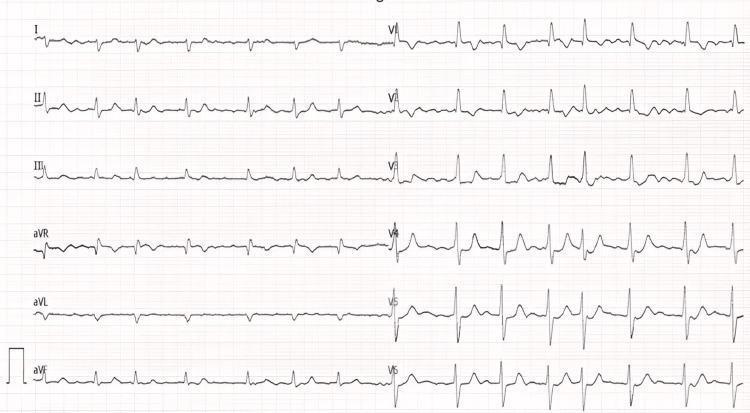
A 12-lead electrocardiogram (ECG) demonstrating a cardiac arrhythmia and signs of right ventricular strain. The tracing shows atrial fibrillation, characterized by an irregularly irregular rhythm and the absence of distinct P waves, replaced by fine fibrillatory waves most visible in leads II, III, and aVF. There is a notable right-axis deviation (negative QRS in lead I, positive in aVF) and an incomplete right bundle branch block (RSR' pattern in lead V1 with a narrow QRS duration). T-wave inversions are present in the right precordial leads (V1, V2, and V3), which is a common finding in right ventricular overload. The QRS morphology in the precordial leads shows a transition with S-waves persisting through V6 and the largest R-wave amplitude in V6. These features collectively suggest right heart strain, often associated with conditions like pulmonary hypertension or congenital heart defects such as atrial septal defects.