
Explain details in different ventilator graphs monitoring and significance
Reading File
Now let me search the medical library for ventilator monitoring content in parallel.
Finding Sources
Finding Sources
Searching the Web
ventilator waveform monitoring graphs pressure volume flow loop clinical significance
Good results. Now let me read the key textbook sections - Fischer's "Essential Waveforms" is perfect, plus Tintinalli's ventilator waveform section, and Rosen's flow vs time section.
Reading File
Reading File
Reading File
Excellent content. Now let me fetch the key textbook images and read more of the Fischer's section on P-V loops and patient-ventilator dyssynchrony.
Reading File
Reading File
Loading Image
Now let me fetch the P-V loop image and the pressure-time/flow-time traces image from Fischer's, plus read the Murray & Nadel dyssynchrony section.
Loading Image
Loading Image
Reading File
Excellent - I now have comprehensive, well-illustrated content from multiple authoritative textbooks. Let me also fetch the high-resistance pressure waveform image and the dyssynchrony graph image.
Loading Image
Loading Image
I now have comprehensive textbook content and key illustrations. Let me compose the full detailed response.
Ventilator Waveform Monitoring: A Complete Guide
Ventilator graphics give clinicians a real-time, bedside window into respiratory mechanics - analogous to how an ECG reflects cardiac function. There are two categories: scalars (one parameter plotted vs. time) and loops (two parameters plotted against each other, with no time axis).
THE THREE SCALAR WAVEFORMS
1. Pressure-Time (P-t) Scalar
What it shows: Cyclic changes in airway pressure breath-by-breath. Time on x-axis, pressure (cmH₂O) on y-axis.
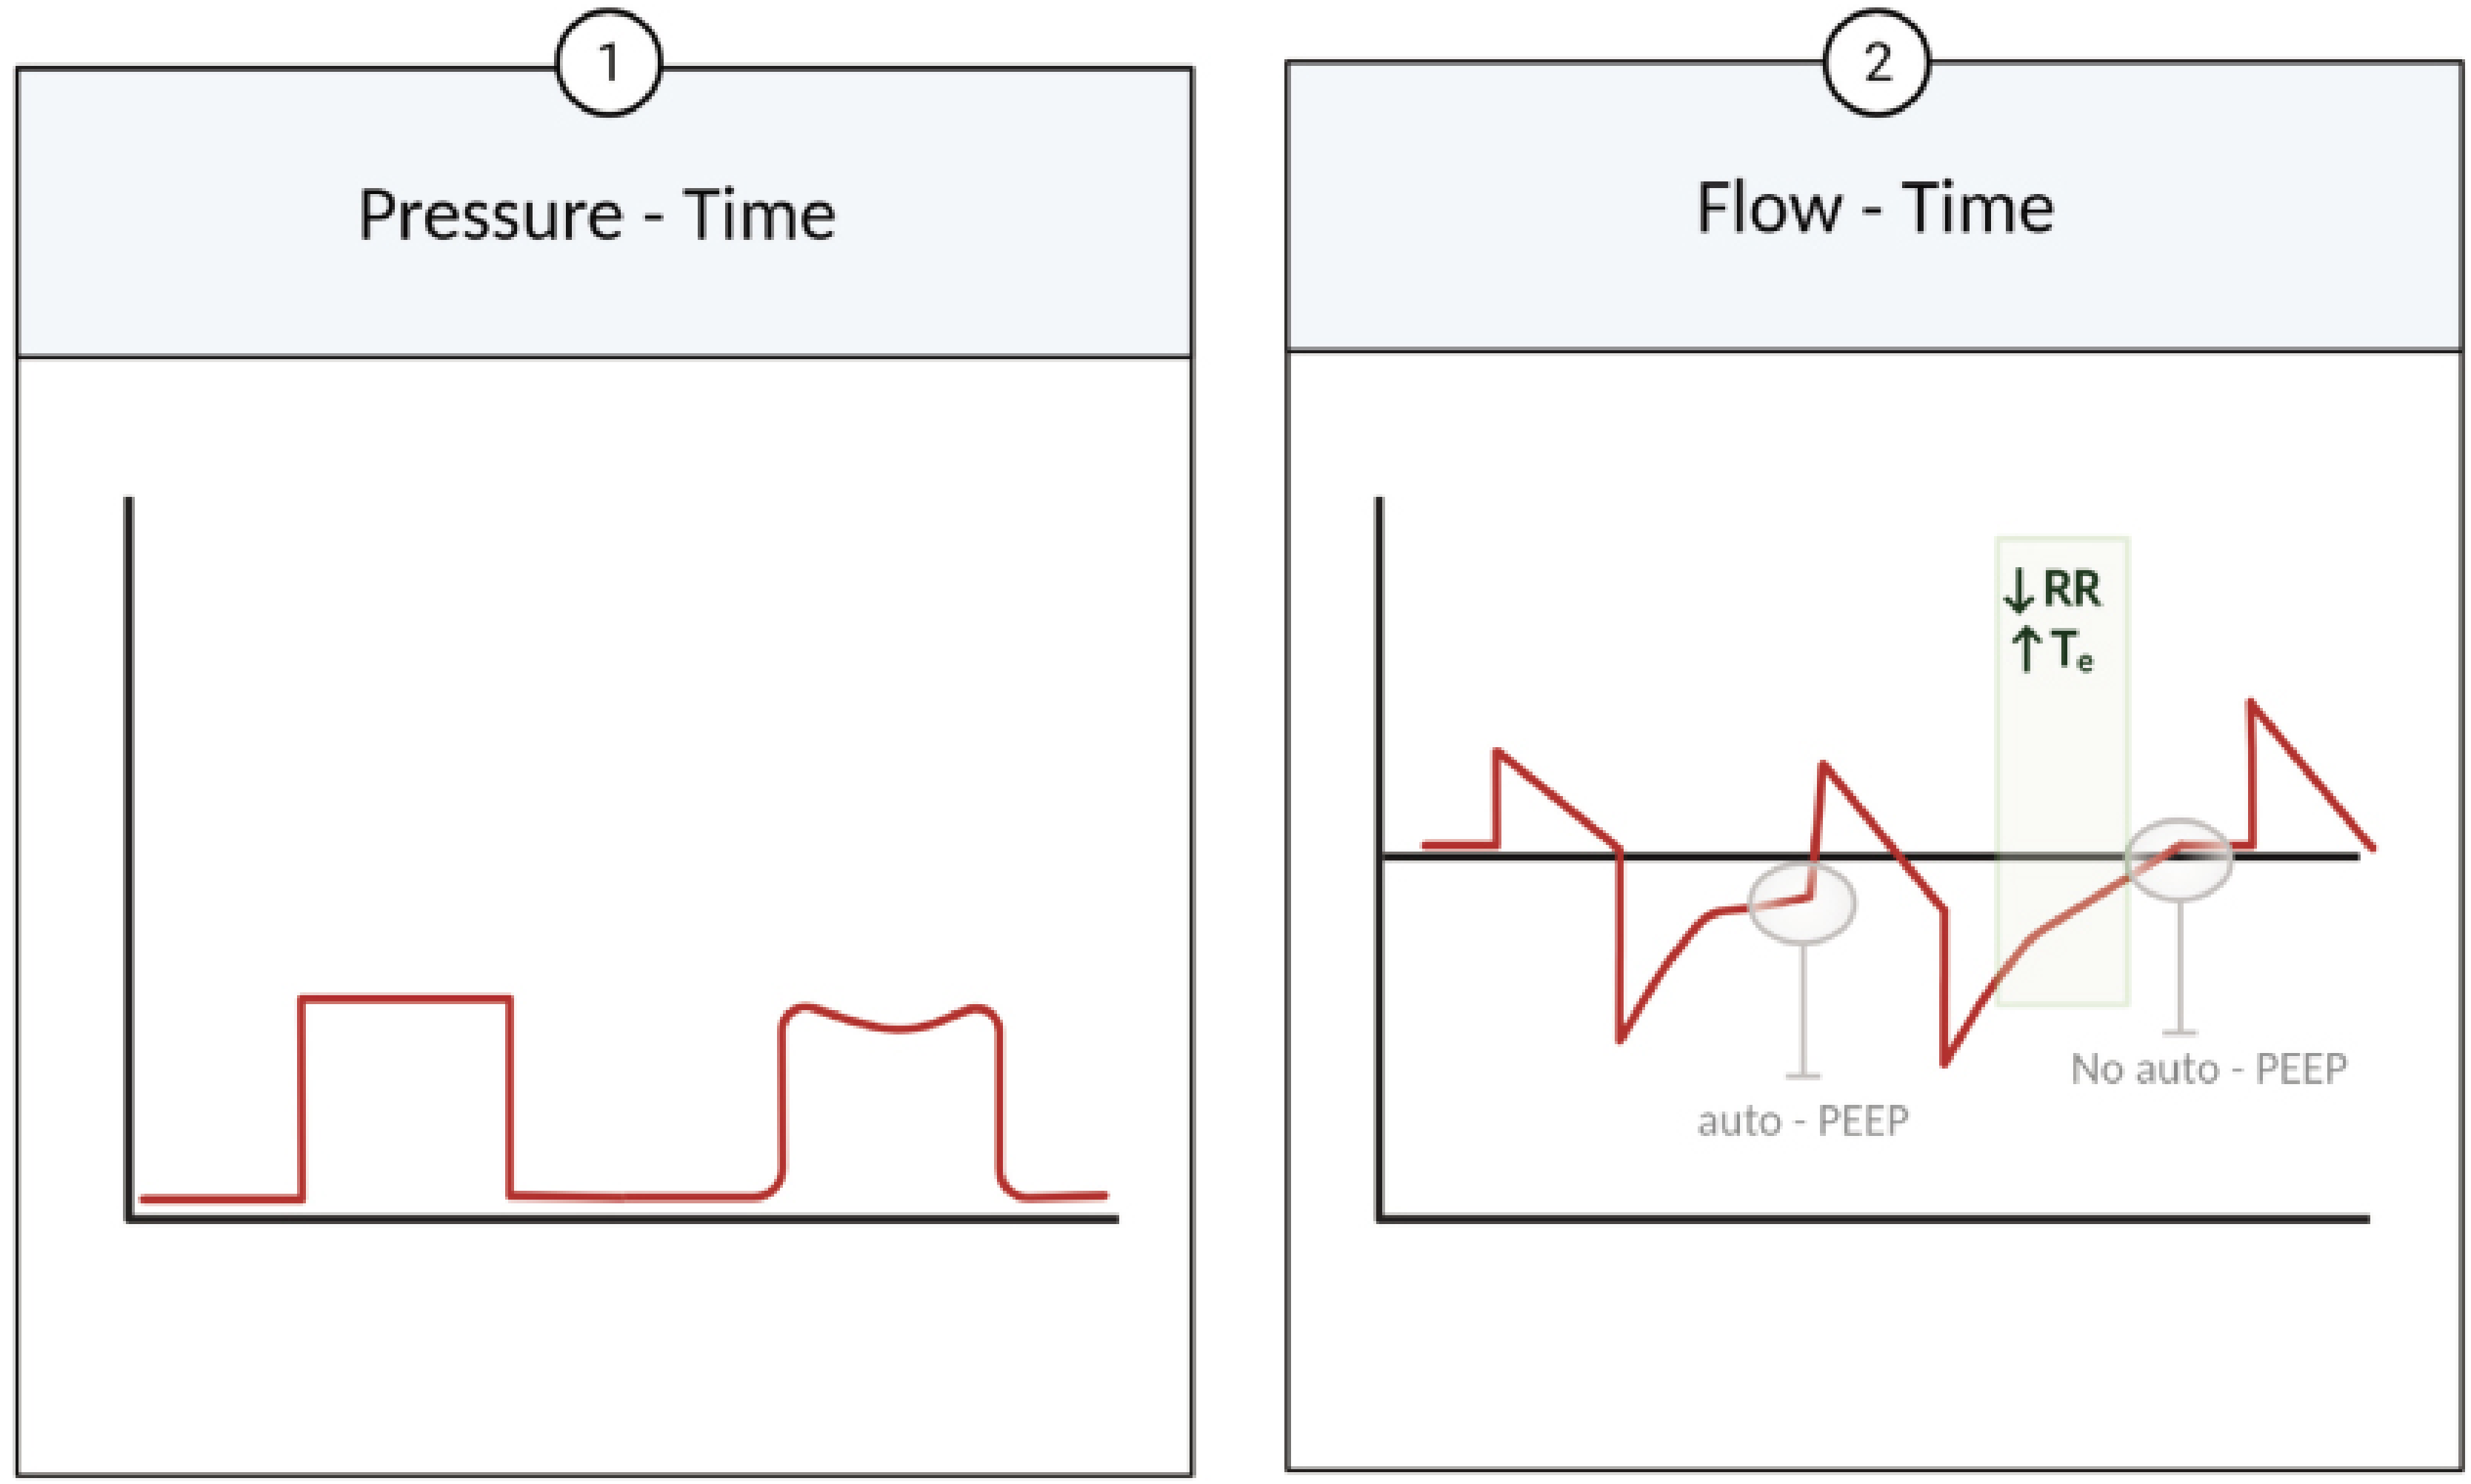
Key landmarks and their significance:
| Landmark | Normal Value | Significance |
|---|---|---|
| PEEP | Set value (typically 5-8 cmH₂O) | Baseline resting pressure; prevents alveolar collapse |
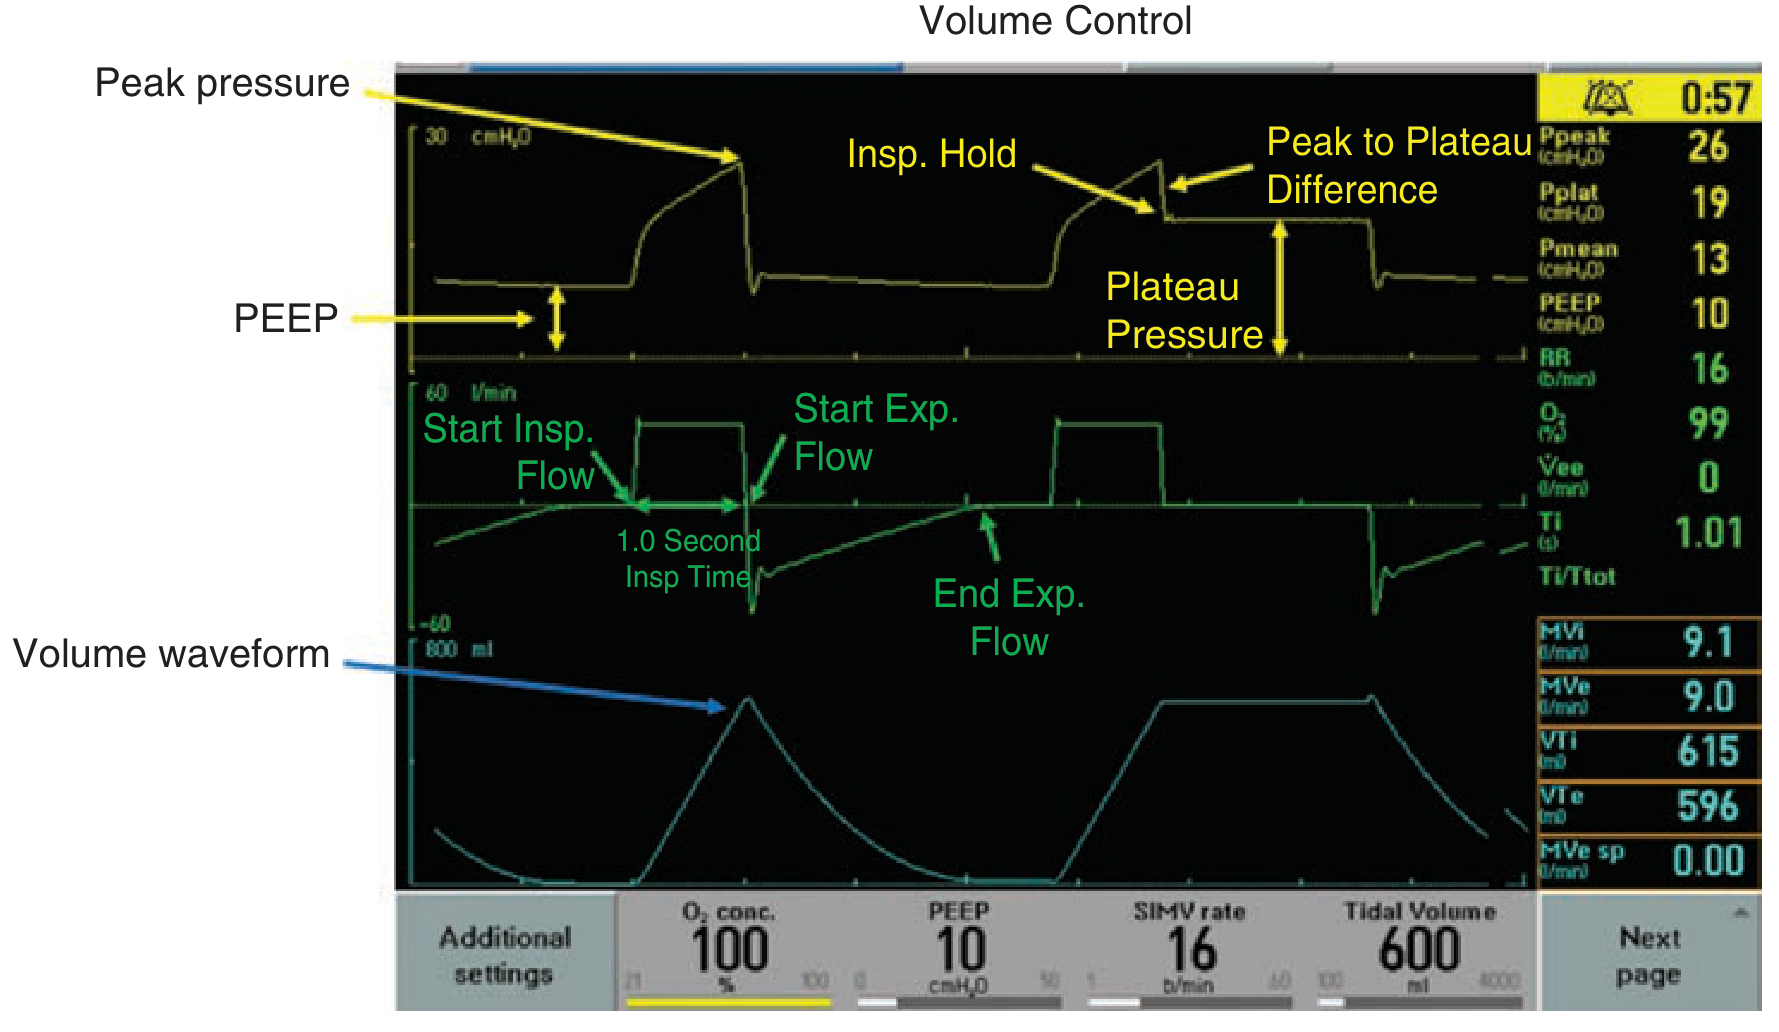
| Peak Inspiratory Pressure (PIP) | < 40 cmH₂O | Highest pressure during breath delivery; reflects airway resistance + compliance |
| Plateau Pressure (Pplat) | < 30 cmH₂O | Measured during inspiratory hold; reflects alveolar pressure and lung compliance |
| Peak-to-Plateau Gradient | < 10 cmH₂O | Elevated gradient = ↑ airway resistance (bronchospasm, mucus plug, kinked ETT) |
| Driving Pressure (DP) | < 15 cmH₂O | DP = Pplat - PEEP; reflects lung stress; strongly linked to VILI and mortality |
| Mean Airway Pressure (Pmean) | Variable | Reflects oxygenation; higher Pmean = better recruitment |
Normal shape in Volume Control (VC):
- Pressure rises during inspiration (concave upward)
- Drops abruptly at end-inspiration to PEEP level
Abnormal patterns:
- Concave "scooped" appearance mid-breath (like a bite taken out of the plateau): indicates patient is inhaling additional flow during a fixed-flow breath - a sign of flow dyssynchrony / insufficient inspiratory flow. Fix: increase flow rate or switch to pressure control.
- High PIP + low Pplat (large peak-to-plateau gap): high airway resistance - think COPD, asthma, bronchospasm, secretions, kinked ETT.
- High PIP + high Pplat (both elevated): low compliance - think ARDS, pulmonary edema, pneumothorax, abdominal distension.
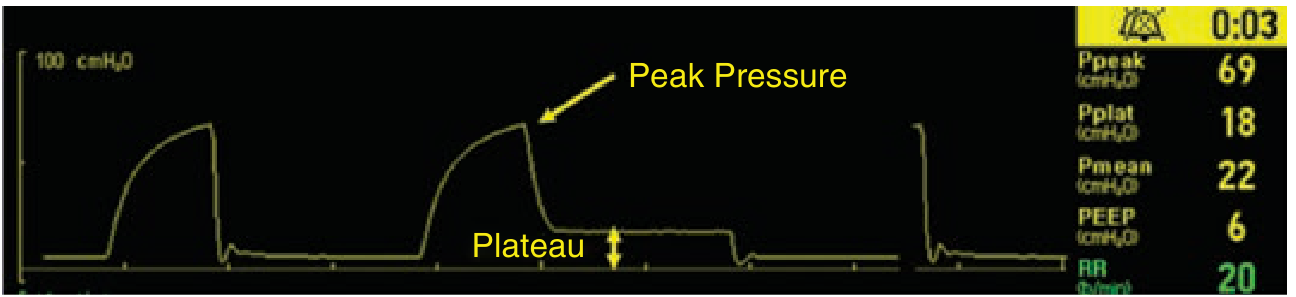
2. Flow-Time (F-t) Scalar
What it shows: Gas flow rate (L/min) over time. Positive values = inspiratory flow (ventilator delivering gas). Negative values = expiratory flow (passive exhalation).
Waveform shapes (set by clinician in Volume Control):
| Shape | Description | Clinical use |
|---|---|---|
| Square (constant) | Fixed flow throughout inspiration | Simple, predictable; most commonly studied |
| Decelerating ramp | Flow starts high, declines linearly | Better gas distribution; lower PIP |
| Sine wave | Mimics natural breathing | Used in older ventilators |
In Pressure Control, the flow waveform is always decelerating (exponential decay) because pressure is fixed and flow responds passively to lung mechanics.
Critical finding - AUTO-PEEP:
If expiratory flow (the negative portion) does not return to zero (baseline) before the next breath is triggered, the patient has not fully exhaled. This is auto-PEEP (intrinsic PEEP, air trapping):
- Causes dynamic hyperinflation
- Raises end-expiratory lung volume
- Increases risk of barotrauma and hemodynamic compromise
- Fix: ↓ respiratory rate, ↓ tidal volume, ↓ inspiratory time (to lengthen expiratory time)
From Rosen's Emergency Medicine: "If the expiratory flow limb does not reach zero prior to the next delivered breath, there will be dynamic hyperinflation because exhalation was not complete." - Rosen's Emergency Medicine
3. Volume-Time (V-t) Scalar
What it shows: Cumulative volume delivered vs. time. Rises during inspiration, falls during expiration.
Normal shape: Smooth S-curve rise during inspiration, mirror image decline during expiration, returns to zero (baseline) at end-expiration.
Abnormal patterns:
- Volume does not return to zero at end-expiration: air trapping / auto-PEEP (same finding as flow-time)
- Delivered volume (VTi) ≠ exhaled volume (VTe): circuit leak, cuff leak, or bronchopleural fistula
- VTe consistently less than VTi by >10%: clinically significant leak - recheck ETT cuff, circuit connections
The real-time ventilator screen below shows all three scalars together:
THE TWO LOOP GRAPHICS
Loops plot two variables against each other (no time axis). They complete one full cycle per breath.
4. Pressure-Volume (P-V) Loop
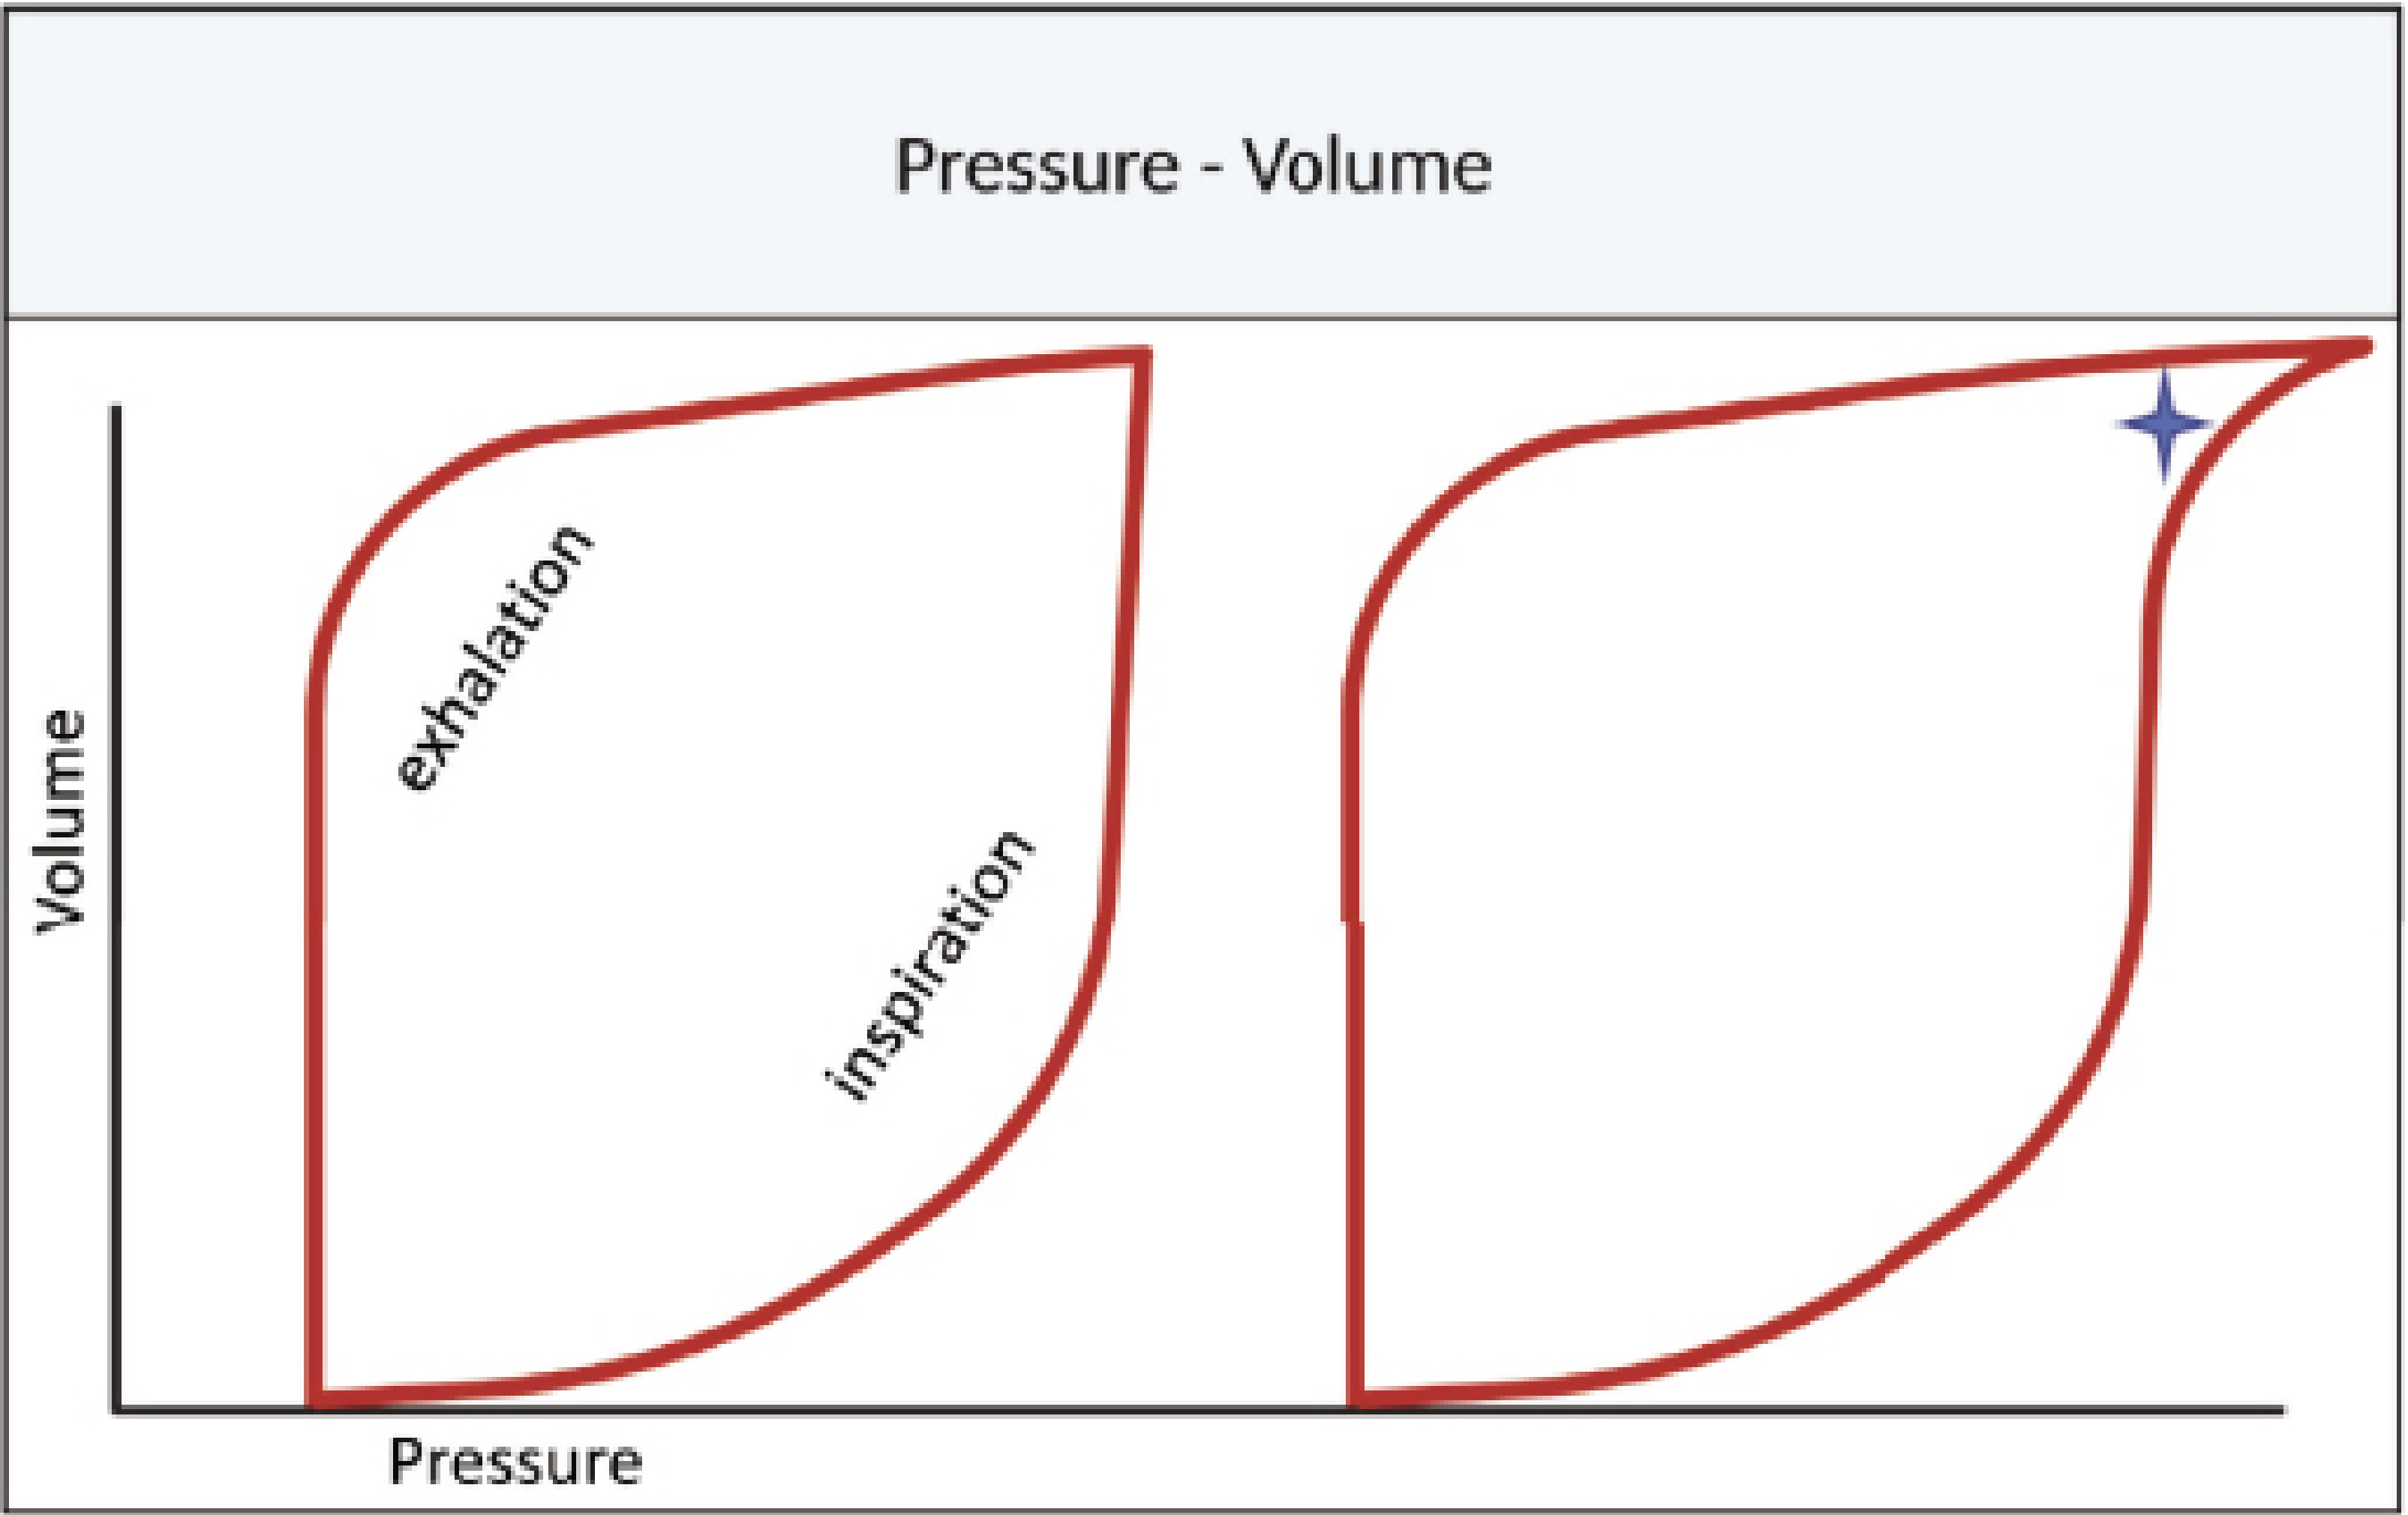
What it shows: Volume (y-axis) vs. pressure (x-axis) for each breath. Also called the "hysteresis curve" because inspiration and expiration trace different paths.
How to read it:
- Inspiration: traces the right-lower limb (pressure rises as volume increases)
- Expiration: traces the left-upper limb (volume decreases at lower pressure)
- The loop should begin and end at the PEEP level
Key abnormalities on the P-V loop:
| Finding | Appearance | Cause | Action |
|---|---|---|---|
| Overdistension ("bird's beak") | Loop bends rightward/hooks at end of inspiration | Excessive volume/pressure | ↓ Tidal volume, ↓ PEEP, ↓ Ti |
| Under-recruitment / low PEEP | Loop starts from very low pressure; early steep portion | Insufficient PEEP causing alveolar de-recruitment | ↑ PEEP |
| Lower inflection point (LIP) | Sharp change in compliance at start of inspiration | Represents the pressure at which collapsed alveoli begin to open | PEEP should be set above LIP |
| Upper inflection point (UIP) | Change in compliance at end of inspiration | Represents onset of overdistension | Peak pressure should stay below UIP |
| Shift rightward (wider loop) | Same volume requires more pressure | Decreased compliance (ARDS, pulmonary edema) | Lung-protective ventilation |
| Shift leftward (narrower loop) | Same volume with less pressure | Improved compliance | Good prognostic sign during treatment |
| Increased loop width (area) | Greater area between inspiratory and expiratory limbs | Increased resistive work of breathing | Assess for secretions, bronchospasm |
5. Flow-Volume (F-V) Loop
What it shows: Flow rate (y-axis) vs. volume (x-axis). Inspiratory limb is above the x-axis; expiratory limb below (convention may vary by ventilator).
Clinical use: Primarily evaluates airway resistance. Complements the peak-to-plateau gradient on the P-t scalar.
Key findings:
| Pattern | Appearance | Significance |
|---|---|---|
| Normal | Smooth inspiratory and expiratory curves meeting cleanly at origin | Normal resistance and compliance |
| Sawtooth pattern (on inspiratory and/or expiratory limb) | Irregular, serrated appearance | Secretions in airway ("secretion flag"); response to suctioning shows immediate smoothing |
| Scooped expiratory limb | Concave (bowing inward toward x-axis) | Air trapping, expiratory flow limitation - classic for COPD/asthma |
| Loop not closing at baseline | Gap between start and end of loop | Air trapping / auto-PEEP |
| Reduced peak expiratory flow | Diminished height of expiratory curve | Bronchospasm or fixed obstruction |
PATIENT-VENTILATOR DYSSYNCHRONY
Dyssynchrony occurs when ventilator breath delivery does not match patient neural respiratory timing. It is identified visually on the waveforms.
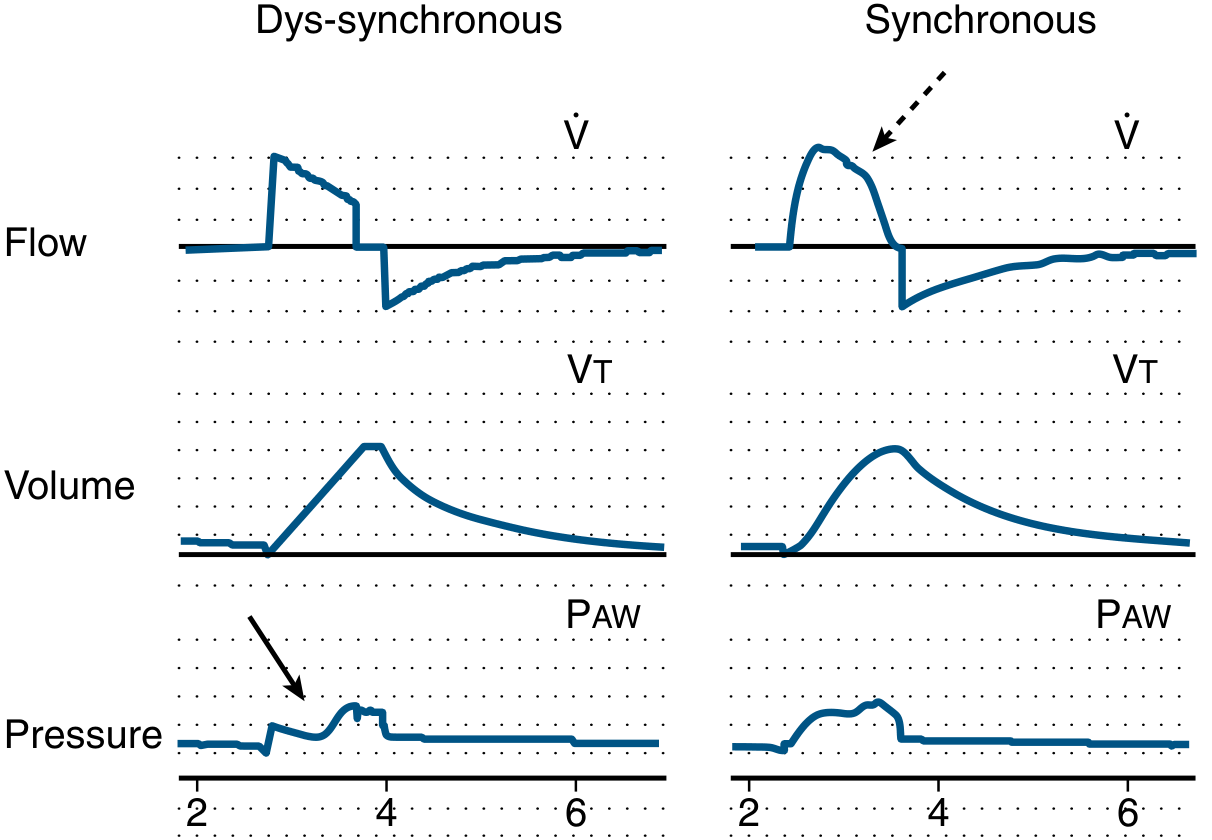
Types of dyssynchrony and their waveform signatures:
| Type | Waveform finding | Mechanism | Fix |
|---|---|---|---|
| Trigger dyssynchrony (ineffective trigger) | Effort visible on flow/pressure but no breath delivered | PEEP too low, weak effort, over-sedation | ↑ Sensitivity, ↑ extrinsic PEEP to offset auto-PEEP |
| Auto-triggering | Extra breaths not patient-initiated | Sensitivity too high; cardiogenic oscillations, circuit condensation | ↓ Sensitivity |
| Flow dyssynchrony | Concave (scooped) pressure scalar in VC | Inspiratory flow too low for demand | ↑ Flow rate, or switch to PC |
| Cycle dyssynchrony (delayed cycling) | Active exhalation effort visible on waveform | Inspiratory time too long | ↓ Inspiratory time |
| Double triggering | Two consecutive pressure peaks very close together | Patient's neural Ti > ventilator Ti; second effort triggers extra breath | ↑ Inspiratory time; breath stacking increases VT and VILI risk |
SPECIAL MONITORING: INSPIRATORY AND EXPIRATORY HOLDS
Inspiratory Hold (Plateau Pressure Maneuver)
- Performed by pausing flow at end-inspiration on a passively breathing (no spontaneous effort) patient
- PIP drops to plateau level (Pplat) as airway resistance is eliminated
- Pplat goal: < 30 cmH₂O (lung-protective ventilation)
- Driving pressure = Pplat - PEEP; target < 15 cmH₂O
- Driving pressure is currently the best surrogate for volutrauma risk in ARDS
Expiratory Hold (Auto-PEEP Measurement)
- Prolonged expiratory pause traps the remaining pressure in the circuit
- The pressure measured rises above set PEEP = auto-PEEP (intrinsic PEEP)
- Auto-PEEP = total PEEP (measured) - extrinsic PEEP (set)
- Clinically important in obstructive disease and high respiratory rates
SUMMARY: QUICK INTERPRETATION FRAMEWORK
Step 1 - Pressure-Time:
  → Check PIP, Pplat, driving pressure, peak-plateau gap
  → Concave scooping = flow dyssynchrony

Step 2 - Flow-Time:
  → Does expiratory flow return to zero? No → auto-PEEP

Step 3 - Volume-Time:
  → VTi ≈ VTe? No → leak; Volume returns to zero? No → air trapping

Step 4 - P-V Loop:
  → Bird's beak at top → overdistension
  → Loop starting low → under-recruitment

Step 5 - F-V Loop:
  → Sawtooth → secretions (suction)
  → Scooped expiratory limb → obstruction/air trapping
Sources:
- Fischer's Mastery of Surgery, 8th ed. - "Essential Waveforms" (pp. 285-287)
- Tintinalli's Emergency Medicine - "Managing Ventilator Settings" (pp. 232-234)
- Murray & Nadel's Textbook of Respiratory Medicine - "Patient-Ventilator Dys-synchrony" (p. 135.4)
- Rosen's Emergency Medicine - "Invasive Ventilation" (pp. 60.6-60.7)
- The Basics of Ventilator Waveforms - PMC (open-access review)
This is a shared conversation. Sign in to Orris to start your own chat.