
Explain pressure half time in mitral stenosis to calculate mitral valve area
pressure half time mitral stenosis Doppler echocardiography
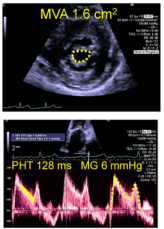
Summary : This figure presents two echocardiographic images assessing mitral valve stenosis, including mitral valve area (MVA), pressure half-time (PHT), and mean gradient (MG).
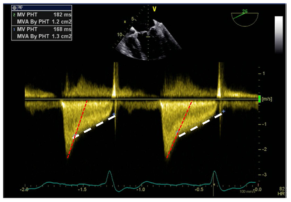
Summary : This image shows a Doppler echocardiography spectral tracing of mitral inflow, used to assess mitral valve area (MVA) by pressure half-time (PHT) method, with on-image measurements and calculations.
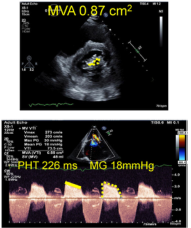
Summary : This figure presents two echocardiographic images assessing mitral valve stenosis, including planimetry and Doppler measurements, with key values for mitral valve area (MVA), pressure half-time (PHT), and mean gradient (MG) annotated.
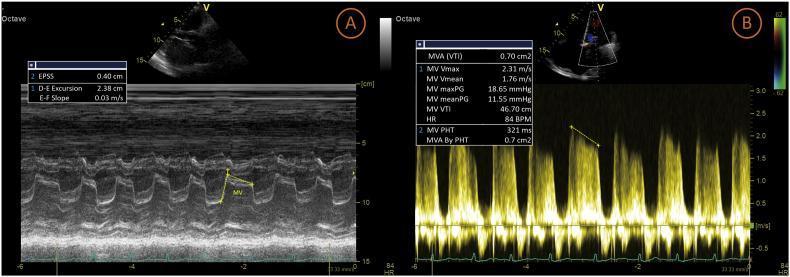
This diagnostic image consists of two panels (A and B) demonstrating echocardiographic findings of severe mitral stenosis. Panel A is an M-mode echocardiogram of the mitral valve showing characteristic morphology of stenotic leaflets. Key visible findings include a significantly flattened E-F slope (measured at 0.03 m/s), indicating slow early diastolic closure, and a decreased D-E excursion (2.38 cm) with a measured EPSS of 0.40 cm. Panel B displays a continuous-wave Doppler echocardiography tracing across the mitral valve. The Doppler envelope shows increased diastolic flow velocities and a prolonged pressure half-time (PHT). Superimposed hemodynamic data indicates a mean pressure gradient (MV meanPG) of 11.55 mmHg, a maximum velocity (Vmax) of 2.31 m/s, and a calculated mitral valve area (MVA) of 0.70 cm² by both velocity time integral (VTI) and pressure half-time (PHT 321 ms). These quantitative and qualitative features are diagnostic of severe rheumatic mitral stenosis, characterized by restricted leaflet mobility and high-pressure transvalvular gradients.
Pressure Half-Time (PHT) in Mitral Stenosis
What is Pressure Half-Time?
V_max / √2 (i.e., ~0.707 × V_max)
The Physiologic Basis
The Hatle Formula: Calculating MVA
- Textbook of Clinical Echocardiography, p. 350
Worked Example (from the textbook):
MVA = 220 / 260 = 0.85 cm² → severe mitral stenosis
Severity Classification (AHA/ACC)
| Stage | Definition | PHT | MVA |
|---|---|---|---|
| B | Progressive MS | <150 ms | >1.5 cm² |
| C/D | Severe MS | ≥150 ms | ≤1.5 cm² |
| C/D | Very severe MS | ≥220 ms | ≤1.0 cm² |
- Fuster and Hurst's The Heart, 15th Ed., Table 32-1
How to Measure PHT on CW Doppler (Step by Step)
- Align the CW Doppler beam with the mitral inflow jet (apical 4-chamber view), keeping the intercept angle parallel to flow throughout diastole.
- Identify V_max - the peak early-diastolic (E-wave) velocity.
- Calculate V_max/√2 (multiply V_max × 0.707).
- Trace the deceleration slope - most echocardiography machines have a dedicated PHT/deceleration time button. Draw a line along the linear portion of the deceleration slope.
- Read PHT directly from the machine (it calculates the time from V_max to the point where V = V_max/√2).
- Apply Hatle formula: MVA = 220 / PHT.
Pitfalls and Limitations
| Situation | Effect | Reason |
|---|---|---|
| Immediately after balloon valvuloplasty (24-72 hrs) | Overestimates MVA | Sudden change in LA/LV compliance before equilibration |
| Significant aortic regurgitation | Overestimates MVA (falsely short PHT) | AR jet rapidly raises LV pressure, shortening pressure equalization |
| Elevated LV filling pressure (poor LV compliance) | Underestimates MVA (falsely long PHT) | LV stiffness slows pressure equalization independently of valve area |
| Atrial fibrillation | Variable measurements | RR interval changes alter filling; must average multiple beats |
| Very high heart rate | May be unmeasurable | Atrial contraction obscures the deceleration slope |
| Non-linear deceleration slope | Use mid-diastolic slope | Curve fitting error |
Comparison with Other MVA Methods
| Method | Formula / Basis | Notes |
|---|---|---|
| PHT (Hatle) | MVA = 220/T½ | Simple, widely used; pitfalls above |
| 2D Planimetry | Direct tracing of orifice | Gold standard; requires optimal short-axis view |
| Continuity Equation | MVA = SV / VTI_MS jet | Best when compliance is abnormal; needs no MR |
| PISA method | 2πr²·Valiasing / Vpeak | Useful when MR coexists |
| 3D Echo | Direct volumetric | Most accurate for commissural asymmetry |
Key Numbers to Remember
| PHT (ms) | MVA (cm²) | Severity |
|---|---|---|
| 55 | 4.0 | Normal |
| 110 | 2.0 | Mild |
| 147 | 1.5 | Moderate/severe threshold |
| 220 | 1.0 | Severe |
| 320 | 0.7 | Very severe |
Explain in simple terms for easy understanding
Pressure Half-Time Made Simple
Start with a Basic Picture of the Heart
- When the tap is wide open (normal valve) → water flows quickly → tank empties fast
- When the tap is nearly closed (mitral stenosis) → water drains slowly → tank stays full longer
What is "Pressure Half-Time"?
Think of it like timing how fast air leaks from a balloon through a hole:
- Big hole → air escapes fast → pressure drops quickly → short half-time
- Tiny hole → air escapes slowly → pressure drops slowly → long half-time
How Do We Measure It?
V_max  ●
        \
         \   ← This slope is the deceleration of blood velocity
          \
           \●  ← When velocity has dropped to V_max ÷ 1.41
              \
               \___
- Top of the slope = peak blood velocity (when pressure difference is maximum)
- Slope going down = blood slowing as pressures equalize
- PHT = time from the top to where the velocity has dropped to about 70% of the peak
The Magic Formula: MVA = 220 ÷ PHT
Simple examples:
| PHT (ms) | Calculation | MVA (cm²) | What it means |
|---|---|---|---|
| 110 | 220 ÷ 110 | 2.0 | Mild - not much obstruction |
| 150 | 220 ÷ 150 | 1.5 | Moderate - significant narrowing |
| 220 | 220 ÷ 220 | 1.0 | Severe - very narrow |
| 320 | 220 ÷ 320 | 0.7 | Critical - dangerously narrow |
The Core Idea in One Sentence
The tighter the valve, the longer it takes for pressures to equalize, so the longer the PHT - and dividing 220 by that time gives you the valve area.
When the Formula Can Mislead You
| Situation | What goes wrong | Direction of error |
|---|---|---|
| Aortic regurgitation | AR jets fill the LV rapidly from above, forcing LV pressure up quickly - pressures equalize fast even with a tight mitral valve | Falsely short PHT → overestimates MVA (looks better than it is) |
| Stiff left ventricle (poor LV compliance) | LV resists filling, so pressure rises quickly regardless of valve size | Falsely short PHT → overestimates MVA |
| Right after balloon valvuloplasty | The sudden opening of the valve drastically changes the pressure dynamics; chambers haven't adapted yet | Unreliable for 24-72 hours |
Quick Summary
Tight valve  →  Slow pressure equalization  →  Long PHT  →  Small MVA
Loose valve  →  Fast pressure equalization  →  Short PHT →  Large MVA

MVA (cm²) = 220 ÷ PHT (ms)