
mood disorder
What aspect of mood disorders are you looking for? · What level of detail do you need?
overview and classification major depressive disorder bipolar disorder treatment pathophysiology and neurobiology
mood disorder classification bipolar depression diagram
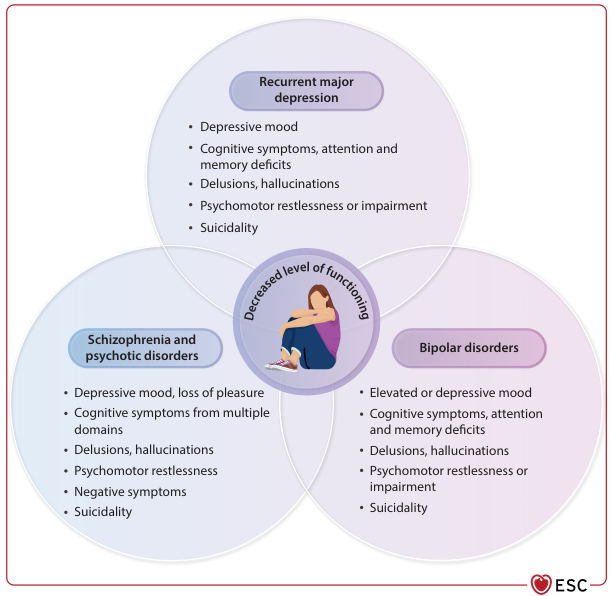
Summary : This Venn diagram compares the overlapping and distinct symptoms of three major psychiatric disorders—recurrent major depression, schizophrenia and psychotic disorders, and bipolar disorders—highlighting their shared impact on decreased level of functioning. venn diagram: # Disorders Compared : • Recurrent major depression • Schizophrenia and psychotic disorders • Bipolar disorders # Symptom Lists : ## Recurrent major depression : • Depressive mood • Cognitive symptoms, attention and memory deficits • Delusions, hallucinations • Psychomotor restlessness or impairment • Suicidality ## Schizophrenia and psychotic disorders : • Depressive mood, loss of pleasure • Cognitive symptoms from multiple domains • Delusions, hallucinations • Psychomotor restlessness • Negative symptoms • Suicidality ## Bipolar disorders : • Elevated or depressive mood • Cognitive symptoms, attention and memory deficits • Delusions, hallucinations • Psychomotor restlessness or impairment • Suicidality # Central Overlap (Shared Features) : • Decreased level of functioning (illustrated by a person sitting with head down) • Delusions, hallucinations • Psychomotor restlessness or impairment • Suicidality • Cognitive symptoms # Design Encodings : • Three overlapping circles, each shaded differently and labeled with the disorder name. • Central overlap contains an illustration of a person and the phrase “Decreased level of functioning.” • Each disorder’s symptoms are listed in bullet points within its respective circle. • ESC logo in the bottom right corner. # Analysis : • All three disorders share several core symptoms: cognitive impairment, delusions/hallucinations, psychomotor changes, and suicidality, which collectively contribute to decreased functioning. • Schizophrenia and psychotic disorders uniquely list “negative symptoms” and “loss of pleasure.” • Bipolar disorder uniquely includes “elevated mood.” • The diagram visually emphasizes the substantial overlap in symptoms and functional impairment among these psychiatric conditions.
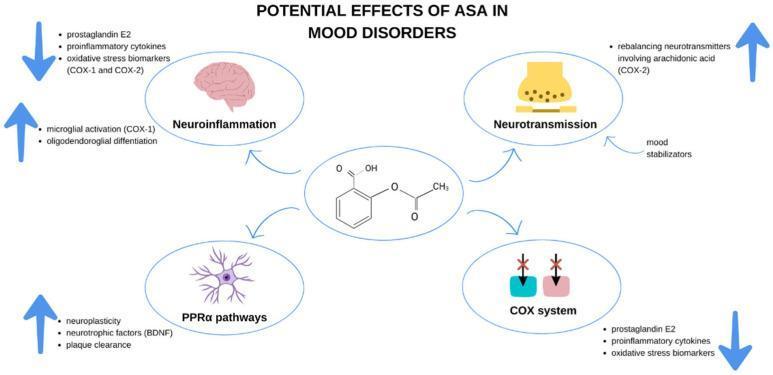
This pathophysiology diagram illustrates the potential mechanisms of action for Acetylsalicylic Acid (ASA) in the treatment and prevention of mood disorders. The central element is the chemical structure of ASA, which branches out to four key neurological and immunological domains. 1) Neuroinflammation: ASA is associated with decreased levels of prostaglandin E2, proinflammatory cytokines, and oxidative stress biomarkers (COX-1/COX-2), while potentially influencing microglial activation and oligodendroglial differentiation. 2) COX System: The diagram depicts the direct inhibition of cyclooxygenase enzymes, leading to a downstream reduction in inflammatory mediators. 3) Neurotransmission: The visual indicates a role in rebalancing neurotransmitters via the arachidonic acid pathway (COX-2), interacting with mood stabilizers. 4) PPARα Pathways: ASA is shown to enhance neuroplasticity, brain-derived neurotrophic factor (BDNF) levels, and plaque clearance. Directional arrows signify the increase or decrease of specific biological processes and molecular markers, summarizing how ASA acts as a multi-target modulator within the central nervous system to alleviate symptoms of depression and bipolar disorder.
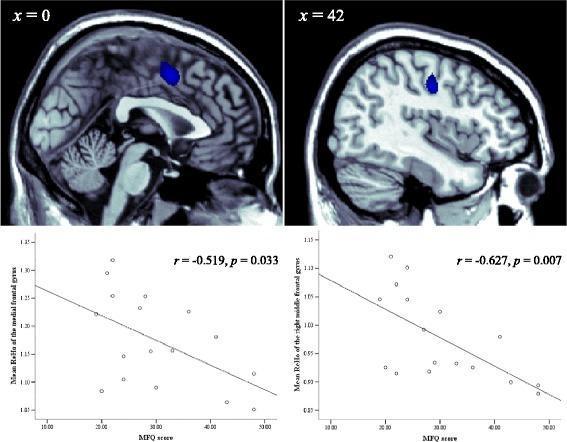
This composite educational graphic presents a neuroimaging correlation analysis in the context of Pediatric Bipolar Disorder (PBD) with depression. The top row features two sagittal MRI brain scans with blue highlighted regions of interest (ROIs) representing areas of significantly decreased Regional Homogeneity (ReHo). The scan at x = 0 (midline) highlights the medial frontal gyrus, while the scan at x = 42 identifies the right middle frontal gyrus. The bottom row displays corresponding scatter plots showing the relationship between Mood and Feelings Questionnaire (MFQ) scores on the x-axis and mean ReHo values on the y-axis. Both plots demonstrate a statistically significant negative correlation: the left plot (medial frontal gyrus) shows r = -0.519, p = 0.033, and the right plot (right middle frontal gyrus) shows r = -0.627, p = 0.007. This visualization illustrates the pathophysiology of depression in PBD patients, linking clinical symptom severity (MFQ scores) with specific functional neuroimaging biomarkers in the prefrontal cortex.
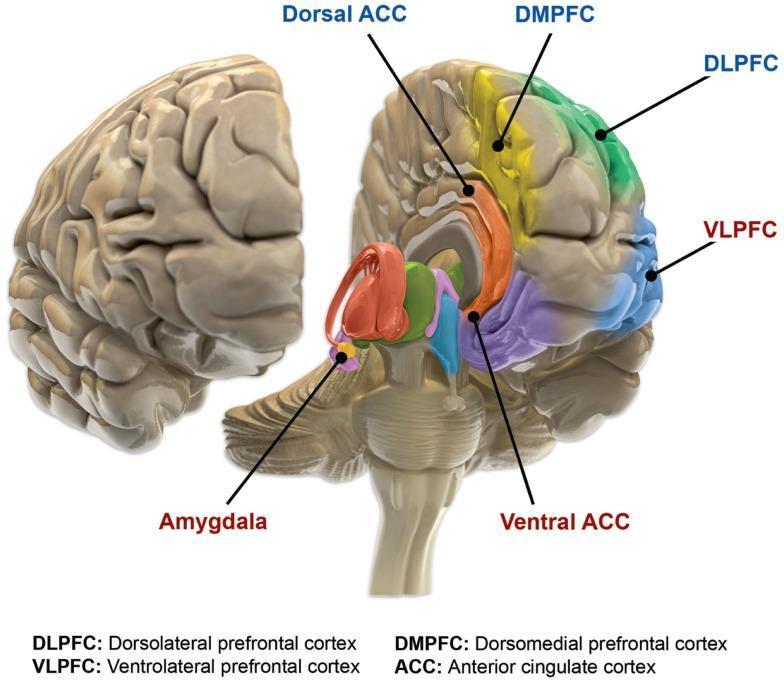
This anatomical diagram provides a sagittal and three-quarter view of the human brain, specifically illustrating the functional neuroanatomy involved in bipolar disorder and emotional regulation. Key regions are color-coded to distinguish between cognitive control networks and limbic/para-limbic systems. The cognitive control regions, typically exhibiting reduced responsiveness in euthymic bipolar patients, include the Dorsolateral Prefrontal Cortex (DLPFC) in green, the Dorsomedial Prefrontal Cortex (DMPFC) in yellow, and the Dorsal Anterior Cingulate Cortex (ACC) in orange. In contrast, limbic and para-limbic areas associated with emotional regulation and increased responsiveness are highlighted, including the Ventral ACC in purple, the Ventrolateral Prefrontal Cortex (VLPFC) in light blue, and the amygdala, located deep within the temporal lobe, in red/pink. The diagram emphasizes the spatial relationships between the cortical prefrontal areas and subcortical structures like the amygdala and brainstem. This visual resource is designed for medical education regarding the pathophysiology of mood disorders, illustrating the imbalance between top-down volitional control and bottom-up emotional reactivity.
monoamine hypothesis serotonin norepinephrine depression neurotransmitter
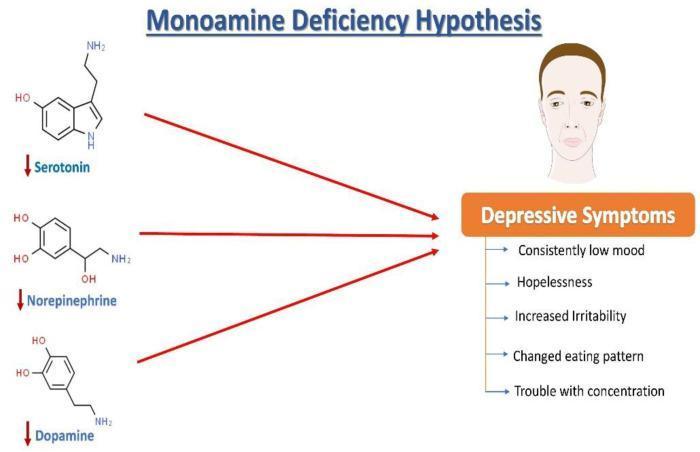
A pathophysiology diagram illustrating the 'Monoamine Deficiency Hypothesis' of depression. On the left, the chemical structures of three key monoamine neurotransmitters are shown: Serotonin (5-HT), Norepinephrine (NE), and Dopamine (DA). Each neurotransmitter is accompanied by a downward-pointing red arrow, indicating quantitative deficiency or reduced levels in the synaptic cleft or extracellular fluid. Red directional arrows point from these molecules toward a central clinical outcome box labeled 'Depressive Symptoms.' To the right, an illustration of a human face with a somber expression is paired with a bulleted list of common clinical manifestations, including consistently low mood, hopelessness, increased irritability, changed eating patterns, and trouble with concentration. The diagram effectively maps the biochemical theory of monoamine dysregulation to the neuropsychiatric presentation of Major Depressive Disorder (MDD), serving as an educational summary of the biological basis for antidepressant pharmacotherapy targeting monoamine reuptake or degradation.
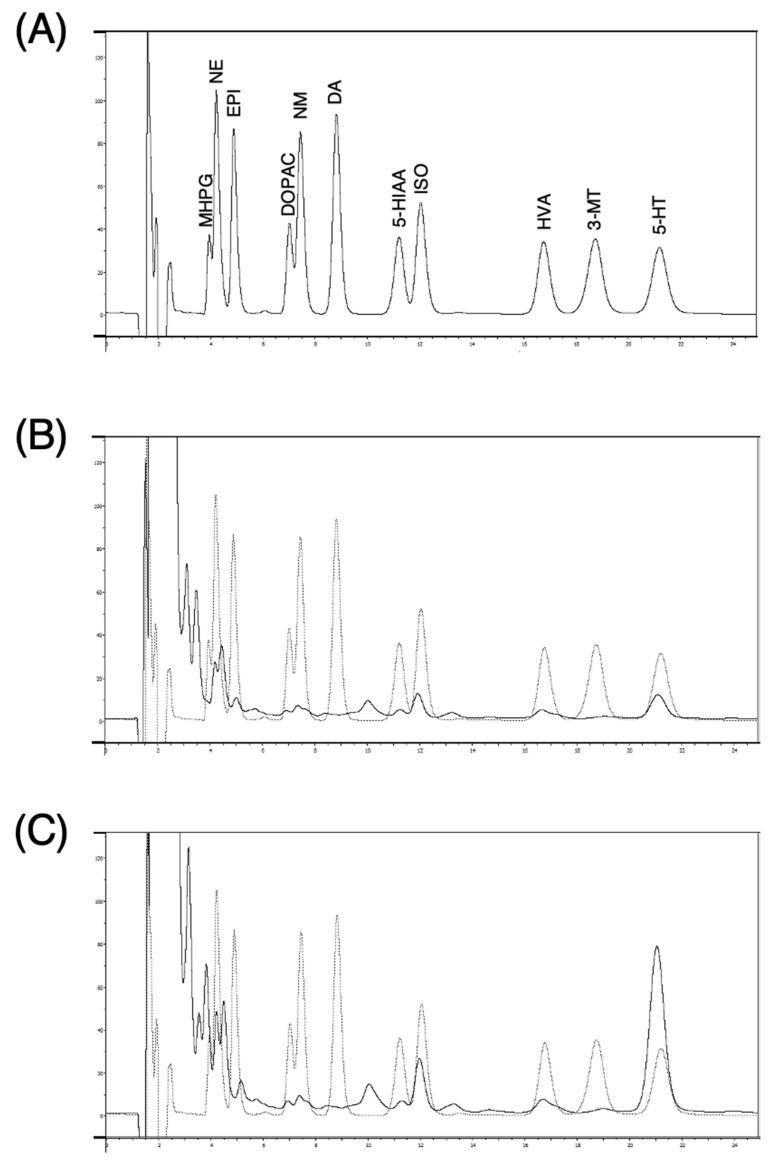
The image displays three representative high-performance liquid chromatography (HPLC) chromatograms (labeled A, B, and C) used to measure monoamine neurotransmitters and their metabolites. Panel A shows a standard solution with clearly resolved and labeled peaks for MHPG, Norepinephrine (NE), Epinephrine (EPI), DOPAC, Normetanephrine (NM), Dopamine (DA), 5-HIAA, Isoprenaline (ISO), HVA, 3-MT, and Serotonin (5-HT). Panels B and C illustrate microdialysis samples obtained from a biological model. Panel B represents the baseline (pre-treatment) sample, showing significantly lower peak amplitudes for most monoamines compared to the standard. Panel C demonstrates the neurochemical profile after the infusion of 1 mM imipramine, a tricyclic antidepressant. Visually, Panel C shows a marked increase in the peak height and area for Serotonin (5-HT) and Norepinephrine (NE) relative to Panel B, reflecting the drug's mechanism as a reuptake inhibitor. This comparison serves as an educational tool for analytical chemistry and pharmacology, demonstrating how microdialysis and HPLC are used to monitor real-time changes in interstitial neurotransmitter concentrations following pharmacological intervention.
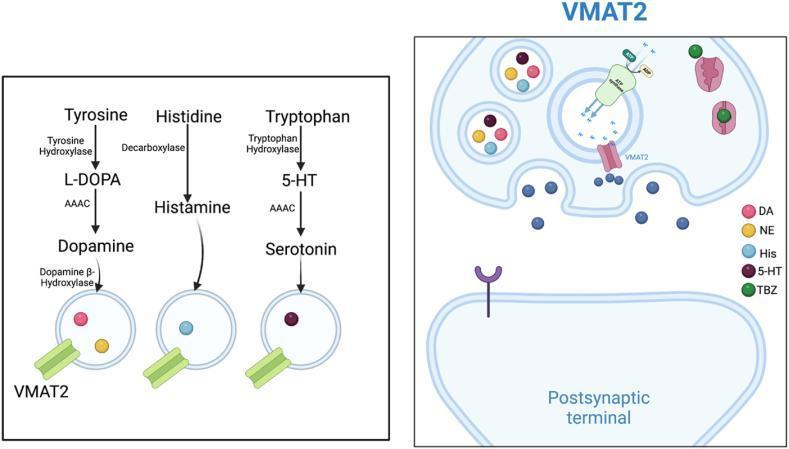
This medical illustration comprises two panels detailing the role of Vesicular Monoamine Transporter 2 (VMAT2) in neurotransmitter synthesis, storage, and release within the central nervous system. The left panel is a biochemical flowchart illustrating the metabolic pathways for three major monoamines: Dopamine (synthesized from Tyrosine via L-DOPA by Tyrosine Hydroxylase and AAAC), Histamine (from Histidine via Decarboxylase), and Serotonin/5-HT (from Tryptophan via Tryptophan Hydroxylase and AAAC). It shows VMAT2 facilitating the uptake of these neurotransmitters into storage vesicles. The right panel depicts a presynaptic terminal showing the active transport mechanism where VMAT2 utilizes an H+ gradient, generated by a vesicular ATP-synthase (V-ATPase), to sequester monoamines. The diagram illustrates neurotransmitter exocytosis into the synaptic cleft towards postsynaptic receptors and includes pharmacological modulation, showing Tetrabenazine (TBZ) as a VMAT2 inhibitor that blocks vesicular sequestration. Visual legends identify Dopamine (DA), Norepinephrine (NE), Histamine (His), and Serotonin (5-HT). This educational material focuses on neuropharmacology and synaptic physiology, suitable for medical students and neuroscience researchers.
Mood Disorders - Comprehensive Review
1. Overview and Classification
DSM-5 Classification
| Category | Disorders |
|---|---|
| Depressive Disorders | Major Depressive Disorder (MDD), Persistent Depressive Disorder (Dysthymia), Premenstrual Dysphoric Disorder, Disruptive Mood Dysregulation Disorder |
| Bipolar and Related Disorders | Bipolar I, Bipolar II, Cyclothymic Disorder |
| Other | Substance/medication-induced mood disorder, Mood disorder due to another medical condition |
ICD-11 Classification
| Code | Disorder |
|---|---|
| 6A70-6A7Z | Depressive disorders |
| 6A60 | Bipolar type I |
| 6A61 | Bipolar type II |
| 6A62 | Cyclothymic disorder |
- The term "unipolar" is avoided in DSM-5 - MDD, especially early-onset, can switch to bipolar
- "Melancholic features" qualifies MDD with prominent biological features (endogenous depression)
- "Mixed states" = simultaneous manic and depressive features
- Cyclothymia = attenuated bipolar variant; Dysthymia/Persistent Depressive Disorder = attenuated depressive variant
2. Major Depressive Disorder (MDD)
Diagnostic Criteria (DSM-5)
| Symptom | Mnemonic |
|---|---|
| Depressed mood | S - Sleep disturbance (↑ or ↓) |
| Anhedonia | I - Interest loss (anhedonia) |
| Weight/appetite change (↑ or ↓) | G - Guilt/worthlessness |
| Sleep disturbance | E - Energy loss |
| Psychomotor agitation or retardation | C - Concentration difficulty |
| Fatigue/energy loss | A - Appetite change |
| Feelings of worthlessness or guilt | P - Psychomotor changes |
| Diminished concentration | S - Suicidal ideation |
| Recurrent thoughts of death or suicidal ideation |
Must cause significant distress or functional impairment. Not attributable to substances or a medical condition.
Specifiers (Important Subtypes)
| Specifier | Features |
|---|---|
| With Psychotic Features | Mood-congruent ("I deserve punishment") or mood-incongruent delusions/hallucinations; severe disease, poor prognosis |
| With Melancholic Features | Severe anhedonia, early morning awakening, weight loss, profound guilt, worse in AM, psychomotor disturbance; often called "endogenous depression" |
| With Atypical Features | Mood reactivity, hypersomnia, hyperphagia, leaden paralysis, rejection sensitivity |
| With Anxious Distress | Prominent anxiety/tension |
| Peripartum Onset | During pregnancy or within 4 weeks postpartum |
| Seasonal Pattern | Fall/winter onset, spring remission |
Special Populations
3. Bipolar Disorder
Bipolar I vs. Bipolar II vs. Cyclothymia
| Type | Definition |
|---|---|
| Bipolar I | At least one full manic episode (may or may not have depressive episodes) |
| Bipolar II | At least one hypomanic episode + at least one major depressive episode; no full mania |
| Cyclothymia | Chronic fluctuating mood with hypomanic and depressive symptoms over ≥2 years, never meeting full criteria for mania or MDD |
Manic Episode - DSM-5 Criteria
- Inflated self-esteem or grandiosity
- Decreased need for sleep (feels rested after only 3 hours)
- More talkative than usual / pressured speech
- Flight of ideas or racing thoughts
- Distractibility
- Increased goal-directed activity or psychomotor agitation
- Excessive involvement in pleasurable activities with high risk of painful consequences (spending sprees, sexual indiscretions, foolish investments)
Hypomanic Episode
Clinical Features of Bipolar Disorder
- Depressive episodes in bipolar disorder are symptomatically identical to unipolar depression, but are often harder to treat and less responsive to antidepressants.
- The most common inter-episode state is chronic low-grade depression, not euthymia (contradicting older teaching).
- Rapid cycling = ≥4 mood episodes per year; less responsive to mood stabilizers.
- Sleep deprivation can precipitate a manic episode; jet lag and shift work are thus known triggers.
- Onset typically in young adulthood, but can range from adolescence to the 5th decade.
- Psychotic symptoms are common during mania - usually mood-congruent (delusions of special powers, grandiosity).
4. Pathophysiology and Neurobiology
A. The Monoamine Hypothesis (Classic)
- Reserpine (depletes monoamines) can induce depression
- All early antidepressants work by increasing monoamine availability

B. The Monoamine Receptor Hypothesis
C. The Neuroplasticity / Neuroprogression Hypothesis (Modern)
- Stress, inflammation, and genetic vulnerability → loss of BDNF (Brain-Derived Neurotrophic Factor)
- Loss of BDNF → synaptic maintenance failure → loss of dendritic spines → neuronal atrophy
- This produces measurable hippocampal and prefrontal cortex volume loss on structural MRI
- Neuroprogression can become irreversible if untreated over time
- Antidepressants trigger downstream BDNF synthesis - this, not immediate monoamine rise, may be the true mechanism of clinical benefit
D. HPA Axis Dysregulation
- Chronic stress activates the hypothalamic-pituitary-adrenal (HPA) axis
- Elevated cortisol levels are found in many depressed patients (especially melancholic subtype)
- Cortisol excess damages hippocampal neurons (which express high densities of glucocorticoid receptors)
- The dexamethasone suppression test (DST) was an early biological marker - positive in ~50% of melancholic MDD
E. Neural Circuit Dysfunction in Bipolar Disorder
| Region | Finding |
|---|---|
| Dorsolateral PFC (DLPFC) | Reduced activity - impaired cognitive control |
| Dorsomedial PFC | Reduced activation |
| Dorsal Anterior Cingulate Cortex (ACC) | Reduced responsiveness |
| Ventral ACC | Increased activity |
| Amygdala | Hyperactivated - excessive emotional reactivity |
| Ventrolateral PFC (VLPFC) | Dysregulated emotional modulation |
F. Genetic Factors
- Both MDD and bipolar disorder have strong heritability (~40-70% for MDD; ~80% for bipolar I)
- No single causative gene; polygenic risk involving multiple small-effect variants
- Epigenetic changes from early life adversity interact with inherited risk genes to alter HPA axis set points and circuit connectivity
- Monozygotic vs. dizygotic twin studies confirm genetic propensity extends beyond classic melancholia to subsume a spectrum of mood disorders
5. Treatment
A. Antidepressants (for MDD and Bipolar Depression)
| Class | Drugs | Mechanism |
|---|---|---|
| SSRIs | Fluoxetine, sertraline, escitalopram, paroxetine | Selective serotonin reuptake inhibition |
| SNRIs | Venlafaxine, duloxetine, desvenlafaxine | Serotonin + NE reuptake inhibition |
| TCAs | Amitriptyline, nortriptyline, imipramine | NE + 5-HT reuptake inhibition; multiple receptor actions |
| MAOIs | Phenelzine, tranylcypromine, selegiline | Monoamine oxidase inhibition → ↑ monoamines |
| Atypical | Bupropion, mirtazapine, trazodone | Various; bupropion inhibits DA/NE reuptake |
| Novel | Esketamine (intranasal), brexanolone | NMDA antagonism (esketamine); GABA-A modulation (brexanolone for PPD) |
- All antidepressants are considered roughly equally efficacious; selection depends on side effect profile, comorbidities, and prior response
- SSRIs and SNRIs are first-line due to safety in overdose and broad indications
- Brexanolone is FDA-approved specifically for postpartum depression
- Esketamine is used for treatment-resistant depression
- Olanzapine + fluoxetine combination is approved for both treatment-resistant MDD and bipolar depression
B. Mood Stabilizers (for Bipolar Disorder)
| Drug | Key Points |
|---|---|
| Lithium | Gold standard; effective in 60-80% of mania/hypomania; prophylactic use; very narrow therapeutic index (monitor serum levels); risk of nephrogenic DI, thyroid dysfunction; best for hepatic impairment patients |
| Valproate (divalproex) | Antiepileptic; mood stabilizer; use with caution in women of childbearing age (teratogenic) |
| Carbamazepine | Antiepileptic; approved as mood stabilizer |
| Lamotrigine | Particularly effective for bipolar depression; less effective for acute mania |
C. Antipsychotics in Mood Disorders
- Atypical antipsychotics: risperidone, olanzapine, quetiapine, ziprasidone, aripiprazole, asenapine, cariprazine
- Typical antipsychotics: chlorpromazine, haloperidol
- Quetiapine, lurasidone, cariprazine, olanzapine + fluoxetine combination
D. Non-Pharmacological Treatments
| Treatment | Indication |
|---|---|
| Psychotherapy (CBT, IPT, behavioral activation) | MDD (mild-moderate); maintenance; in combination with meds |
| Electroconvulsive Therapy (ECT) | Severe/refractory MDD, psychotic depression, catatonia, severe suicidality |
| Transcranial Magnetic Stimulation (TMS) | Treatment-resistant MDD |
| Bright Light Therapy | Seasonal MDD, bipolar depression |
| Psychoeducation | Bipolar disorder - reduce relapse |
E. Special Treatment Considerations
- Antidepressant monotherapy in bipolar disorder is generally avoided - risk of triggering mania or rapid cycling; always combine with a mood stabilizer
- Individuals with rapid cycling respond poorly to mood stabilizers and may require combination therapy
- Childhood MDD: treatment with antidepressants requires caution (FDA black-box warning for suicidality in <25 years)
- Untreated bipolar disorder carries considerable long-term disability and is still underdiagnosed globally - Kaplan & Sadock's Comprehensive Textbook
- Kaplan and Sadock's Synopsis of Psychiatry and Kaplan & Sadock's Comprehensive Textbook of Psychiatry - classification, MDD, clinical features
- Eric Kandel, Principles of Neural Science, 6th Edition - bipolar neuroscience
- Stahl's Essential Psychopharmacology: Neuroscientific Basis and Practical Applications - monoamine and neuroplasticity hypotheses
- Lippincott Illustrated Reviews: Pharmacology, 16th Edition - treatment pharmacology