
/generatehandwrittenimages Describe the layers of retina. Describe the visual pathway in detail from retina to visual cortex. What do you understand by sparing of macula. (3+5+2) for md physiology 10 marks theory question. You can make many images and not just one for completing the answer
layers of retina diagram histology photoreceptors ganglion cells
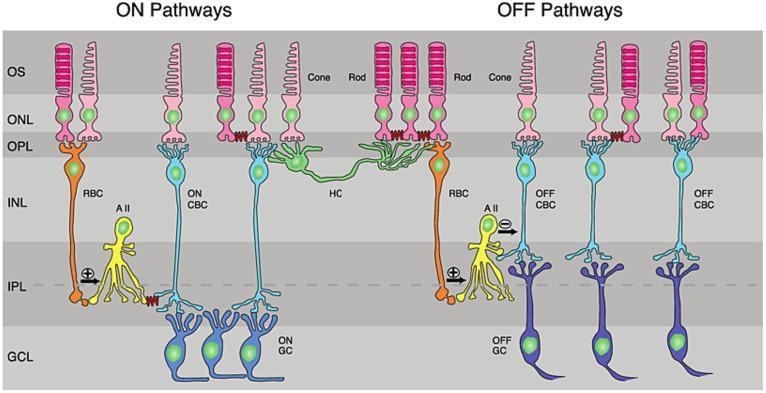
This pathophysiology diagram illustrates the functional retinal circuitry of the ON and OFF pathways. The vertical organization of the retina is shown across six distinct layers: Outer Segments (OS), Outer Nuclear Layer (ONL), Outer Plexiform Layer (OPL), Inner Nuclear Layer (INL), Inner Plexiform Layer (IPL), and Ganglion Cell Layer (GCL). The diagram depicts key cell types and their synaptic relationships: Rods and Cones (photoreceptors) in the outer layers; Rod Bipolar Cells (RBC) and Cone Bipolar Cells (ON CBC and OFF CBC) in the INL; Horizontal Cells (HC) providing lateral inhibition in the OPL; and AII Amacrine Cells facilitating signal transfer. The ON pathway demonstrates rod signals traversing RBCs to AII cells, which سپس stimulate ON Ganglion Cells (ON GC). The OFF pathway shows direct transmission from photoreceptors via OFF CBCs to OFF Ganglion Cells (OFF GC). This schematic serves as a high-level educational resource for understanding neuro-ophthalmology, visual signal processing, and the stratification of the human retina.
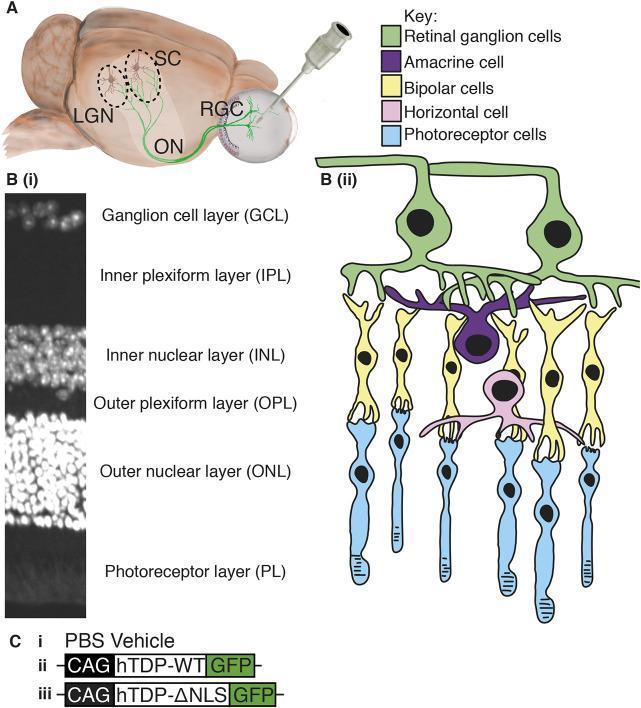
This composite educational graphic details the neuroanatomy and experimental modeling of the mammalian visual system. Panel A features an anatomical diagram of an eye model and brain, illustrating an intravitreal injection. It highlights retinal ganglion cells (RGCs) extending axons through the optic nerve (ON) to the lateral geniculate nucleus (LGN) and superior colliculus (SC). Panel B(i) shows a diagnostic DAPI-stained histological cross-section of the retina, identifying six distinct layers: Ganglion cell layer (GCL), Inner plexiform layer (IPL), Inner nuclear layer (INL), Outer plexiform layer (OPL), Outer nuclear layer (ONL), and Photoreceptor layer (PL). Panel B(ii) provides a matching color-coded cellular schematic showing the vertical and horizontal organization of RGCs (green), amacrine cells (purple), bipolar cells (yellow), horizontal cells (pink), and photoreceptors (blue). Panel C lists experimental genetic constructs (PBS vehicle, hTDP-WT, and hTDP-ΔNLS tagged with GFP) used for disease modeling. This visual resource is designed for intermediate to advanced study of ocular anatomy, histopathology, and neurodegenerative disease research methodology.
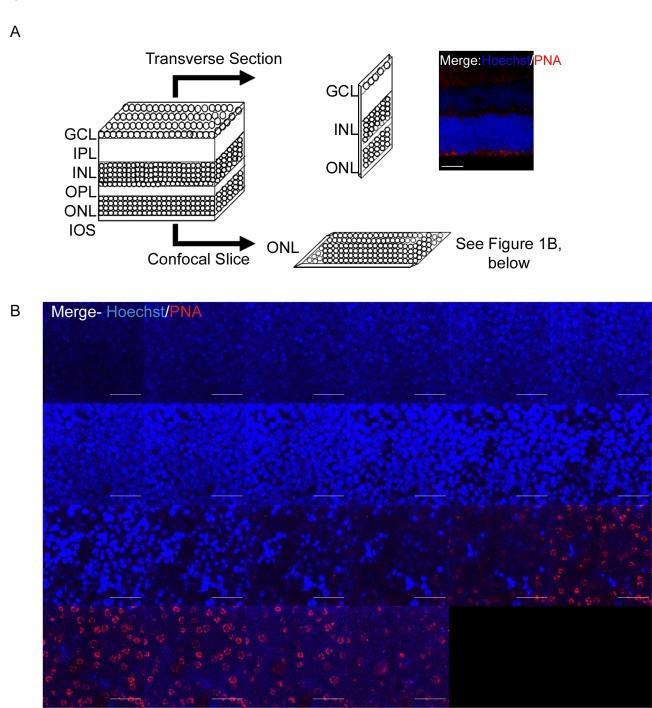
This medical educational image combines an anatomical schematic and diagnostic confocal microscopy to illustrate retinal layer orientation and staining. Panel A displays a schematic diagram of the retina, labeling layers including the ganglion cell layer (GCL), inner plexiform layer (INL), and outer nuclear layer (ONL). It clarifies the difference between a transverse section (vertical cut) and a confocal slice (horizontal plane or 'whole mount'). An accompanying transverse merge image shows Hoechst nuclear staining (blue) and Peanut Agglutinin (PNA) cone staining (red). Panel B presents a high-magnification confocal microscopy whole-mount of the retinal outer nuclear layer. The image demonstrates a merged fluorescence signal where Hoechst (blue) labels the densely packed nuclei of the photoreceptor cells, and PNA (red) specifically highlights cone inner and outer segments. The spatial relationship shows PNA-positive structures in a separate focal plane from the bulk of the Hoechst-positive nuclei, demonstrating that PNA identifies cone membranes adjacent to but distinct from the nuclear layer. This material is designed to teach methods for differentiating rod and cone photoreceptors in retinal research.
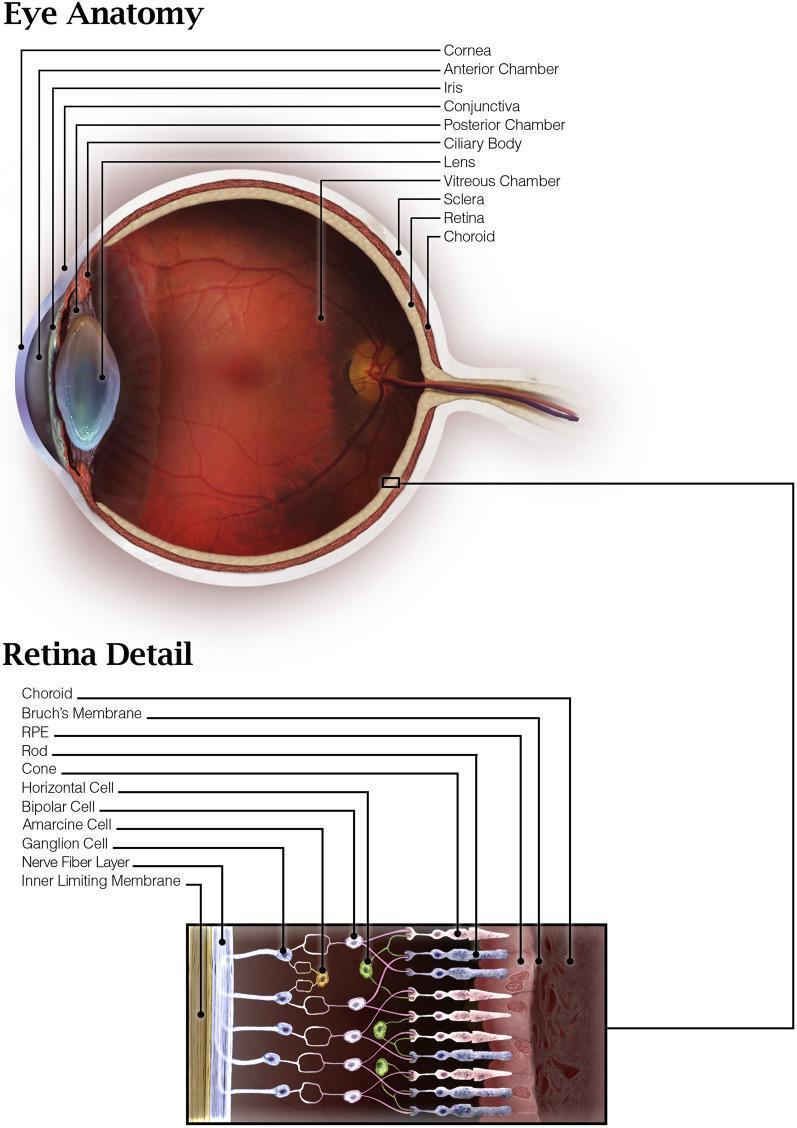
This medical illustration presents a detailed anatomical overview of the human eye, featuring a primary cross-sectional diagram and a magnified 'Retina Detail' inset. The main diagram identifies key anterior structures including the cornea, anterior chamber, iris, and lens, alongside the posterior vitreous chamber. The globe's wall is depicted in three distinct layers: the outer sclera, the vascular choroid, and the inner light-sensitive retina. The optic nerve is visible at the posterior pole. The lower 'Retina Detail' inset provides a high-resolution view of retinal microanatomy, illustrating the stratified organization from the outer choroid and Bruch's membrane to the inner limiting membrane. This section highlights the sequence of retinal pigment epithelium (RPE), photoreceptors (rods and cones), and the complex neural network involving horizontal, bipolar, amacrine, and ganglion cells. The nerve fiber layer is shown as the innermost cellular component, conveying signals toward the optic nerve. This illustration serves as an educational resource for understanding ocular histology and the blood-retinal barrier.
visual pathway optic chiasm lateral geniculate nucleus optic radiation visual cortex diagram
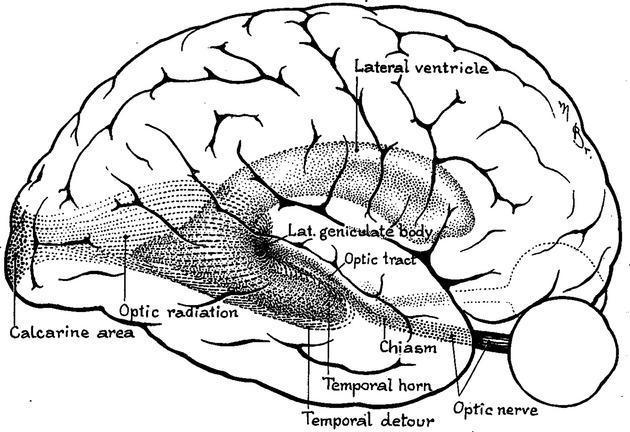
This anatomical diagram provides a lateral view of the human brain, specifically illustrating the visual pathway and the spatial distribution of the optic radiation. Based on Harvey Cushing's 1921 drawing, the illustration highlights the geniculocalcarine tract from its origin at the lateral geniculate body (LGB) to its termination in the primary visual cortex (calcarine area). A key educational focus is the 'temporal detour' or Meyer’s loop, where the ventral fibers of the optic radiation arc anteriorly around the temporal horn of the lateral ventricle before heading posteriorly toward the occipital lobe. Other labeled anatomical landmarks include the optic nerve, optic chiasm, optic tract, and the main body of the lateral ventricle. This diagram is significant for understanding neuroanatomy related to visual field deficits (e.g., quadrantanopia) that may arise from lesions or neurosurgical procedures in the temporal lobe, such as epilepsy surgery or tumor resection.
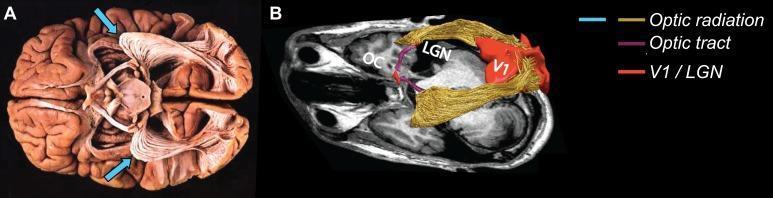
This dual-panel image provides a comparative view of the visual pathway's white matter tracts through anatomical dissection and neuroimaging. Panel A shows a postmortem gross dissection of a human brain from an inferior-lateral perspective. It highlights the optic radiation (OR) as prominent, fan-shaped white fibrous bundles. Blue arrows specifically denote Meyer's loop, the anterior-most extension of the optic radiation that curves around the temporal horn of the lateral ventricle. Panel B presents an in vivo diagnostic representation using 3D tractography overlaid on an axial MRI slice. The visual pathway is color-coded for educational clarity: the optic chiasm (OC) is visible anteriorly; the optic tracts are shown in purple extending toward the lateral geniculate nucleus (LGN); the optic radiations are pseudo-colored in gold, demonstrating their projection toward the primary visual cortex (V1), which is highlighted in red in the occipital lobe. The image serves as an educational tool for neuroanatomy, neuro-ophthalmology, and radiology to illustrate the complex spatial trajectory of axons carrying visual information from the diencephalon to the cortex.
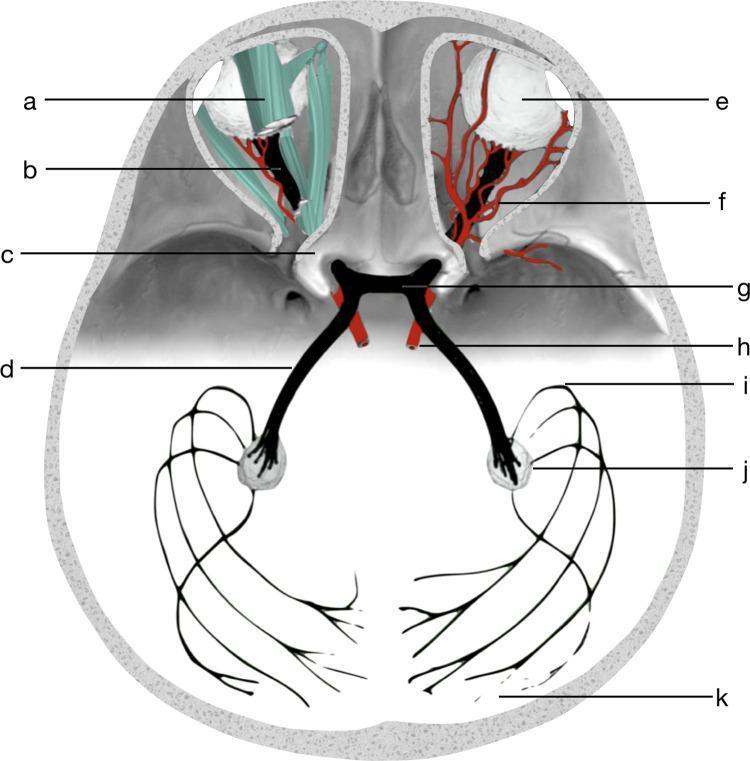
An anatomical diagram illustrating the human visual pathway and its surrounding cranial structures. The schematic highlights the progression from the anterior globes (eyeballs) to the posterior visual cortex. Key structures labeled include the optic nerves (b) extending from the eyeballs, passing through the bony optic canals (c) to converge at the central optic chiasm (g). The diagram demonstrates the decussation of fibers continuing as optic tracts (d) toward the lateral geniculate nuclei (j). The final segment depicts the optic radiation (k), including Meyer’s loop (i), projecting to the primary visual cortex. Surrounding clinical anatomy is integrated, showing the extraocular muscles and tendons (a), orbital blood vessels (f), and the ophthalmic artery (h) in close proximity to the neural structures. This visual summarizes the neuroanatomical relationships essential for understanding visual field defects and imaging diagnostics like CT and MRI tractography.
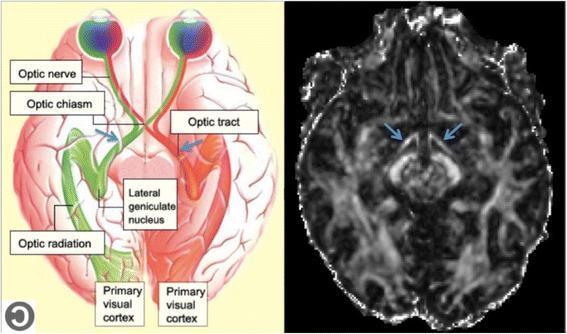
The image consists of two panels illustrating the human visual pathway. The left panel is an anatomical diagram showing a superior view of the brain with the visual system highlighted. It labels the eyes, optic nerves, optic chiasm, optic tracts (indicated by blue arrows), lateral geniculate nucleus (LGN), optic radiations, and primary visual cortex in the occipital lobes. Color-coded pathways demonstrate the decussation of nasal retinal fibers at the optic chiasm and the ipsilateral projection of temporal fibers. The right panel is a diagnostic image featuring an axial slice of a Diffusion Tensor Imaging (DTI) Fractional Anisotropy (FA) map at the level of the midbrain and optic tracts. On this grayscale map, white matter tracts with high anisotropy appear hyperintense (bright). Blue arrows specifically point to the bilateral optic tracts as they exit the optic chiasm and course posteriorly toward the LGN. This dual-panel presentation serves to correlate schematic anatomical knowledge with clinical neuroimaging used to assess white matter integrity in pathological conditions affecting the visual pathways.
macular sparing homonymous hemianopia visual field defect occipital cortex
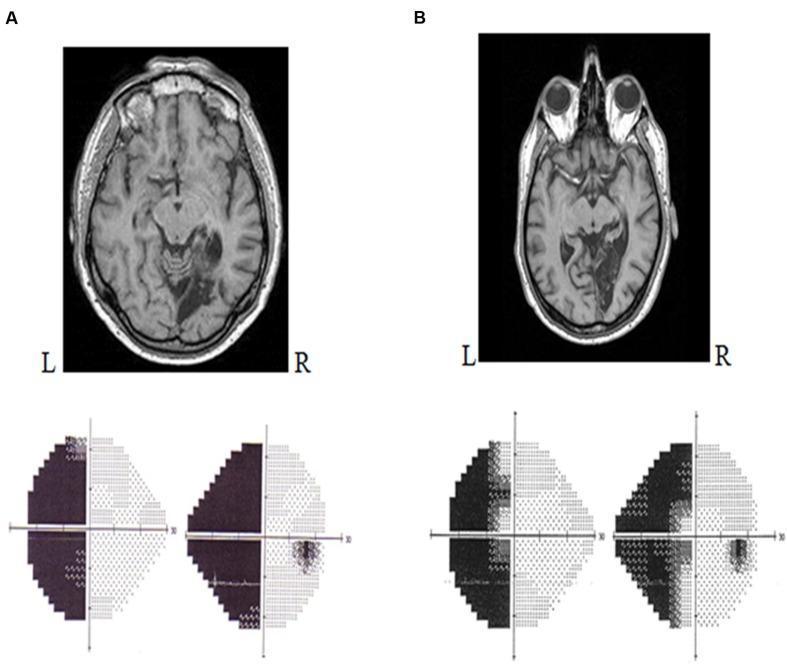
This composite educational graphic compares neuroimaging and corresponding visual field deficits in two clinical cases (A and B). The upper sections show axial T1-weighted MRI scans of the brain. In both cases, there is a large, hypointense (dark) lesion in the right posterior cerebrum, primarily involving the occipital lobe, consistent with a right-sided stroke or infarction in the territory of the posterior cerebral artery (PCA). The lower sections display Humphrey automated perimetry (SITA FAST 24-2) grayscale plots for both eyes. Case A illustrates a complete left homonymous hemianopia, characterized by dense, uniform darkening of the entire left visual field in both eyes, indicating total loss of peripheral and central vision on that side. Case B illustrates a left homonymous hemianopia with macular sparing. While the left hemi-field is largely darkened, there is a distinct preservation of visual sensitivity at the central fixation point (macula), a common clinical finding in PCA infarcts where the occipital pole receives collateral blood supply. This material is used to demonstrate the clinicopathological correlation between cerebral cortex lesions and specific patterns of visual field loss.
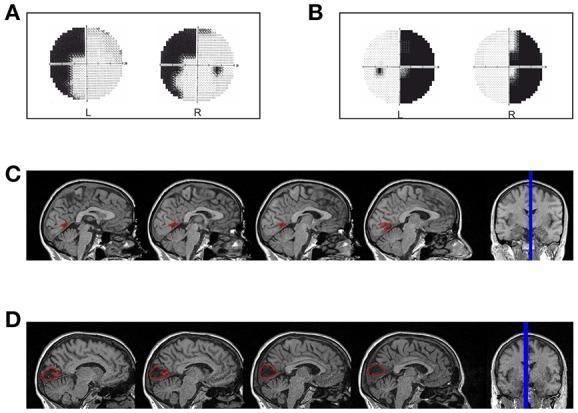
A multi-panel medical image illustrating the correlation between visual field defects and cortical lesions in two hemianopic patients. Panels A and B display Humphrey visual field perimetry results. Panel A shows a left superior quadrantanopia in patient LF, while Panel B shows a right homonymous hemianopia with foveal sparing in patient SL. Panels C and D provide diagnostic neuroimaging reconstructions via sagittal and coronal T1-weighted MRI slices. Panel C (Patient LF) highlights a focal red-labeled lesion in the anterior portion of the right calcarine fissure near the parieto-occipital fissure, consistent with the left-sided visual defect. Panel D (Patient SL) shows a larger red-labeled lesion in the left median para-sagittal occipital lobe involving the peri-calcarine cortex, corresponding to the right-sided hemianopia. The image serves as a clinical anatomical reference for mapping primary visual cortex (V1) damage to specific patterns of post-chiasmatic vision loss, such as quadrantanopia and hemianopia.
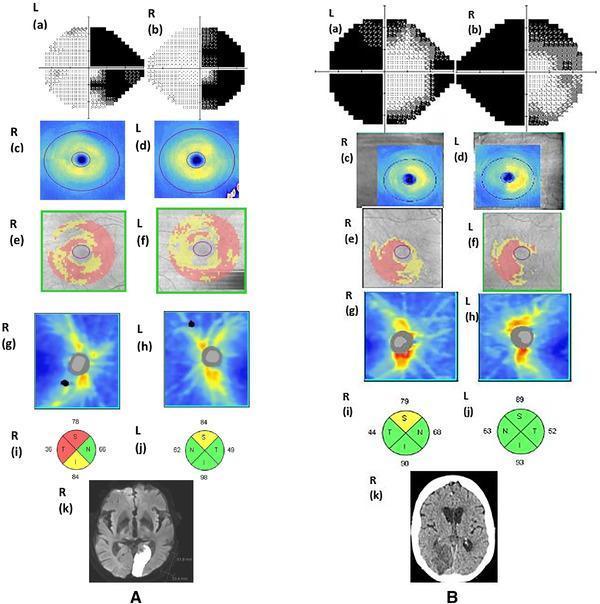
Educational comparison of neuro-ophthalmological findings in two patients (A and B) with occipital lobe infarctions and secondary retrograde trans-synaptic degeneration. Each case includes Humphrey visual field tests (a-b), Optical Coherence Tomography (OCT) ganglion cell-inner plexiform layer (GCIPL) thickness/deviation maps (c-f), Retinal Nerve Fiber Layer (RNFL) thickness/quadrant maps (g-j), and neuroimaging (k). Case A demonstrates a left occipital infarction on diffusion-weighted MRI resulting in right homonymous hemianopia with macular sparing and diffuse bilateral GCIPL thinning on OCT deviation maps. Case B shows a subacute right occipital infarction on CT associated with left homonymous hemianopia and corresponding right-sided homonymous hemi-GCIPL thinning. The RNFL quadrant analysis (i-j) utilizes standard color coding: green for within normal limits, yellow for borderline (p < 5%), and red for outside normal limits (p < 1%). This image illustrates the correlation between central nervous system lesions and retrograde retinal structural changes, highlighting the diagnostic utility of OCT in neuro-ophthalmological evaluation.
A handwritten medical student exam answer page for MD Physiology, written in blue ink on white lined paper with a slight paper texture. The heading reads "Q. Describe the layers of the retina. (3 marks)" underlined. The answer is written in neat medical student handwriting: "LAYERS OF THE RETINA The retina is a specialized sensory epithelium with photoreceptors & neurons arranged in 10 distinct layers (from outside to inside): 1. RETINAL PIGMENT EPITHELIUM (RPE) - Outermost layer, adjacent to choroid - Absorbs stray light; has tentacle-like processes between photoreceptors - Converts all-trans-retinal → 11-cis retinal (visual cycle) 2. PHOTORECEPTOR LAYER - Contains outer & inner segments of rods and cones - Rods: for dim light / scotopic vision; 120 million - Cones: for colour / photopic vision; 6-7 million; concentrated at fovea 3. OUTER LIMITING MEMBRANE - Formed by junctions between Müller cells & photoreceptors 4. OUTER NUCLEAR LAYER (ONL) - Contains nuclei/cell bodies of rods and cones 5. OUTER PLEXIFORM LAYER (OPL) - 1st synaptic layer - Synapses between photoreceptors and interneurons (bipolar & horizontal cells) 6. INNER NUCLEAR LAYER (INL) - Cell bodies of interneurons: • Bipolar cells (B) - vertical transmission • Horizontal cells (H) - lateral modulation • Amacrine cells (A) - lateral modulation at IPL 7. INNER PLEXIFORM LAYER (IPL) - 2nd synaptic layer - Synapses between interneurons and ganglion cells 8. GANGLION CELL LAYER (GCL) - Cell bodies of ganglion cells (output neurons of retina) - Concentrated at posterior pole 9. NERVE FIBRE LAYER (NFL) - Axons of ganglion cells converge at optic disc → form optic nerve - Unmyelinated within the eye 10. INNER LIMITING MEMBRANE (ILM) - Innermost layer; formed by Müller cell foot processes - Separates retina from vitreous KEY POINT: Light travels INWARD through layers 10→1 before reaching photoreceptors." On the right side, a neat hand-drawn cross-sectional diagram of the retinal layers is shown as a vertical column with arrows labeling each layer from outside (RPE at top) to inside (ILM at bottom), with small sketches of rods and cones in layer 2, cell nuclei dots in ONL and INL, wavy lines for synaptic layers OPL and IPL, and ganglion cell bodies in GCL.
A handwritten medical student exam answer page for MD Physiology, written in blue ink on white lined paper. The heading reads "Q. Describe the visual pathway from retina to visual cortex. (5 marks) - Part 1" underlined. Written in neat medical student handwriting: "VISUAL PATHWAY - RETINA TO VISUAL CORTEX OVERVIEW: Retina → Optic Nerve → Optic Chiasm → Optic Tract → Lateral Geniculate Nucleus (LGN) → Optic Radiation → Primary Visual Cortex (Area 17) ━━━━━━━━━━━━━━━━━━━━━━━━━━ STEP 1: RETINA • Photoreceptors (rods/cones) detect light • Signal passes: Photoreceptors → Bipolar cells → Ganglion cells • Axons of ganglion cells form the OPTIC NERVE (CN II) • Optic disc = blind spot (no photoreceptors) • ~1.2 million ganglion cell axons per optic nerve STEP 2: OPTIC NERVE • Leaves eye via optic canal • Covered by all 3 meningeal layers → CNS structure • Each optic nerve carries ALL visual info from ONE eye STEP 3: OPTIC CHIASM • Located above pituitary gland / anterior to hypothalamus • PARTIAL DECUSSATION occurs here: ✓ NASAL retinal fibres (from temporal visual fields) → CROSS to opposite side ✓ TEMPORAL retinal fibres (from nasal visual fields) → REMAIN ipsilateral • Result: each optic tract carries info from CONTRALATERAL visual field - Left optic tract = right visual field (from both eyes) - Right optic tract = left visual field (from both eyes) STEP 4: OPTIC TRACT • Runs around the midbrain • Contains fibres from BOTH eyes representing contralateral hemifield • A small portion of fibres leave here → pretectal area + superior colliculus (pupillary light reflex, visual tracking) • Main fibres → LGN STEP 5: LATERAL GENICULATE NUCLEUS (LGN) of THALAMUS • 1st relay station; located in thalamus • 6 layers: layers 1,4,6 = contralateral eye; layers 2,3,5 = ipsilateral eye Layer 1,2 = Magnocellular (M) - motion, depth Layer 3-6 = Parvocellular (P) - colour, fine detail • Retinotopic organisation maintained" A diagram on the right side shows a top-down view of both eyes, optic nerves meeting at the optic chiasm with crossing nasal fibers (shown as dashed lines crossing) and non-crossing temporal fibers (solid lines), then continuing as optic tracts to LGN boxes on each side. Clear labels with arrows. The visual fields (left and right) are shown above the eyes.
A handwritten medical student exam answer page for MD Physiology, written in blue ink on white lined paper. The heading reads "Visual Pathway - Part 2: LGN to Visual Cortex (continued)" underlined. Written in neat medical student handwriting: "STEP 6: OPTIC RADIATION (Geniculocalcarine Tract) • Axons from LGN neurons form the optic radiation • SPLIT into TWO DIVISIONS: A) UPPER DIVISION (Parietal radiation / Baum's bundle): • Carries fibres from SUPERIOR retinal quadrants • (representing INFERIOR visual field) • Runs through PARIETAL lobe → upper lip of calcarine cortex → Lesion: contralateral inferior quadrantanopia B) LOWER DIVISION (Meyer's Loop / Temporal loop): • Carries fibres from INFERIOR retinal quadrants • (representing SUPERIOR visual field) • Loops ANTERIORLY into TEMPORAL lobe (temporal horn of lateral ventricle) • Then swings posterior → lower lip of calcarine cortex → Lesion: contralateral superior quadrantanopia ('pie in the sky') → Classic: temporal lobectomy (epilepsy surgery) ⭐ MEYER'S LOOP is clinically important! It is the most vulnerable part of the optic radiation. A large temporal lobe lesion affects it first. ━━━━━━━━━━━━━━━━━━━━━━━━━━ STEP 7: PRIMARY VISUAL CORTEX (V1 / Area 17 / Striate Cortex) • Located on MEDIAL surface of occipital lobe • Along both LIPS of the CALCARINE SULCUS (calcarine fissure) • Contralateral hemifield represented (macula has LARGEST representation) • Organisation: - Upper lip = inferior visual field (upper retinal quadrant) - Lower lip = superior visual field (lower retinal quadrant) - Posterior pole (occipital tip) = MACULAR representation - Anterior calcarine = peripheral vision HIGHER VISUAL AREAS: • V2 (Area 18) - parastriate cortex: surrounds V1 • V3, V4 (colour), V5/MT (motion) • TWO STREAMS: → VENTRAL stream (V4 → Temporal lobe): 'WHAT' pathway - object recognition → DORSAL stream (V5 → Parietal lobe): 'WHERE' pathway - spatial/motion VISUAL CORTEX CELL TYPES (Hubel & Wiesel): • Simple cells: respond to oriented bars of light at correct position • Complex cells: respond to moving bars of light (correct orientation) • Hypercomplex cells: respond to lines of specific length, curves, angles" On the right side, a lateral brain diagram shows: LGN at thalamus level, upper optic radiation going through parietal lobe, Meyer's loop curving anteriorly through temporal lobe then posteriorly, both reaching the calcarine sulcus in the occipital lobe. The calcarine sulcus is drawn with the upper and lower lips labeled. A small inset shows the medial surface of the occipital lobe with Area 17 highlighted around the calcarine sulcus.
A handwritten medical student exam answer page for MD Physiology, written in blue ink on white lined paper. The heading reads "Visual Field Defects - Lesions at Different Levels of Visual Pathway" underlined, with a star symbol. Written in neat medical student handwriting with a table/diagram: "VISUAL FIELD DEFECTS WITH LESIONS AT DIFFERENT LEVELS: [A neat diagram showing two eye circles (L eye & R eye) on the left of a table, with columns for 'Site of Lesion', 'Visual Field Defect', and 'Reason'] SITE OF LESION → VISUAL FIELD DEFECT ① Optic nerve (pre-chiasm) e.g. optic neuritis → MONOCULAR BLINDNESS (complete loss, ipsilateral eye only) ② Optic chiasm (central) e.g. pituitary tumour → BITEMPORAL HEMIANOPIA (central fibres cut) (heteronymous; tunnel vision) = NASAL retinal fibres (carrying temporal field) cross here ③ Optic chiasm (lateral) e.g. carotid aneurysm → BINASAL HEMIANOPIA (lateral fibres cut) (rare) ④ Optic tract → CONTRALATERAL HOMONYMOUS e.g. temporal lobe HEMIANOPIA (WITHOUT macular sparing) herniation ⑤ Upper optic radiation → CONTRALATERAL LOWER QUADRANTANOPIA (parietal lobe) (inferior visual field loss) ⑥ Lower optic radiation → CONTRALATERAL UPPER QUADRANTANOPIA (Meyer's loop / temporal) 'Pie in the sky defect' ⑦ Visual cortex → CONTRALATERAL HOMONYMOUS HEMIANOPIA (PCA infarct / WITH MACULAR SPARING ⭐ occipital lobe) MNEMONIC: 'MOBILE' M - Monocular blindness (optic nerve) O - Optic chiasm → Bitemporal hemianopia B - Behind chiasm (optic tract) → Homonymous hemianopia I - If cortex involved → macular sparing L - Lower radiation (Meyer's loop) → superior quadrantanopia E - Eye (optic nerve) = no crossing yet KEY: Homonymous = same side loss in both eyes; Heteronymous = opposite sides" The right side of the page shows visual field diagrams - two columns (Left eye, Right eye) with 7 rows showing darkened (lost) areas for each lesion site, clearly labeled with numbers ① through ⑦, with macular sparing shown as a small preserved central area in defect ⑦.
Error calling model 'gemini-3-pro-image' (RESOURCE_EXHAUSTED): 429 RESOURCE_EXHAUSTED. {'error': {'code': 429, 'message': 'Resource has been exhausted (e.g. check quota).', 'status': 'RESOURCE_EXHAUSTED'}}
We encountered an error while processing your request. Please try again or reach out to us for help.