
Create a detail case presentation with detail history and examination for final year MD General Medicine Resident in front of professor with explanation also mention viva questions with answers with standard books . Topic Hemiplegia- CVA and its localisation in detail
CT scan middle cerebral artery territory infarct
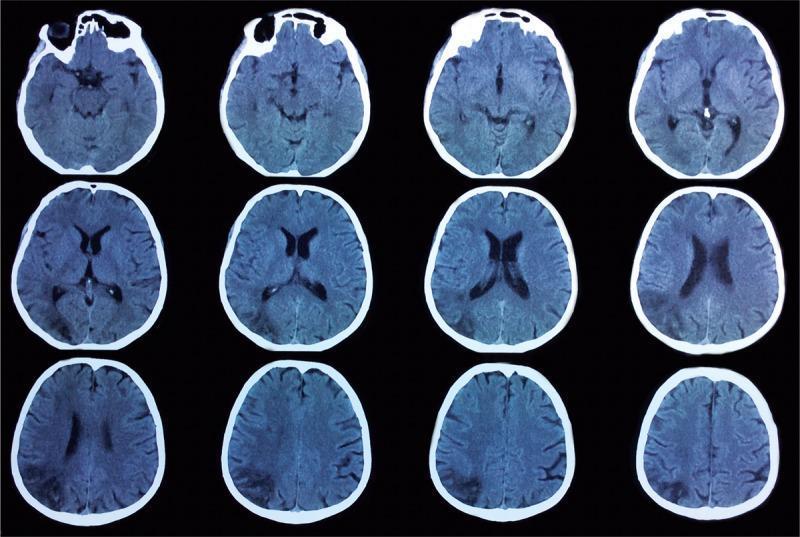
This diagnostic image is a non-contrast axial CT scan of the brain, presented in a 12-slice grid arrangement from superior to inferior. The imaging demonstrates multifocal subacute ischemic findings primarily localized to the right hemisphere. Key pathological features include well-defined areas of hypoattenuation (low density) in the right middle cerebral artery (MCA)–posterior cerebral artery (PCA) watershed territory, visible in the middle and lower rows. Additionally, there are hypodense lesions in the right anterior cerebral artery (ACA) territory and a subtle lacunar infarct in the right thalamus. Anatomical landmarks such as the lateral and third ventricles, basal ganglia, and cortical sulci are visualized. The midline remains stable without significant mass effect or shift, despite the established areas of infarction. This CT series illustrates the characteristic visual presentation of territorial and watershed strokes in a clinical neurology context, highlighting the importance of vascular territory recognition in neuroradiology.
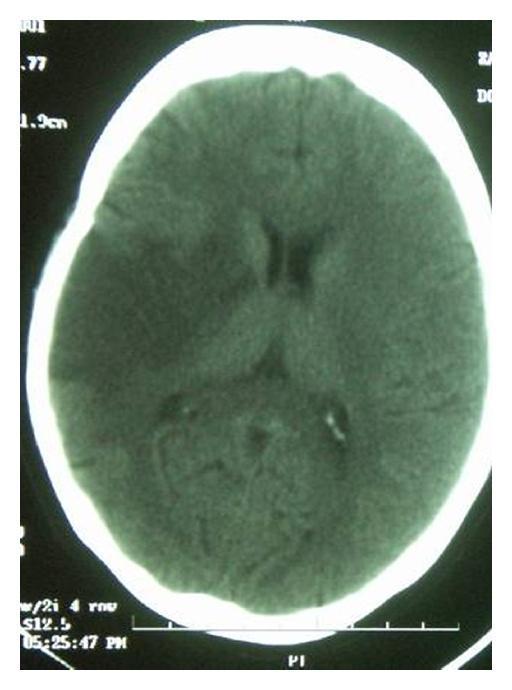
This diagnostic image is an axial non-contrast computed tomography (CT) scan of the brain, demonstrating a large acute ischemic stroke. The primary pathology is a massive territory infarct involving the right middle cerebral artery (MCA) distribution. Key radiological findings include a broad area of hypoattenuation (reduced density) in the right cerebral hemisphere, accompanied by the loss of normal grey-white matter differentiation and sulcal effacement, indicating cytotoxic edema. A notable diagnostic feature is the 'hyperdense MCA sign' visible within the right Sylvian fissure, representing acute thrombus or embolus within the M1 segment of the middle cerebral artery. The image also displays evidence of mass effect, including partial compression of the right lateral ventricle and a subtle midline shift toward the left. This visual provides a classic educational example of early CT signs of major vascular occlusion and territory-wide cerebral infarction suitable for neurology and radiology curricula.
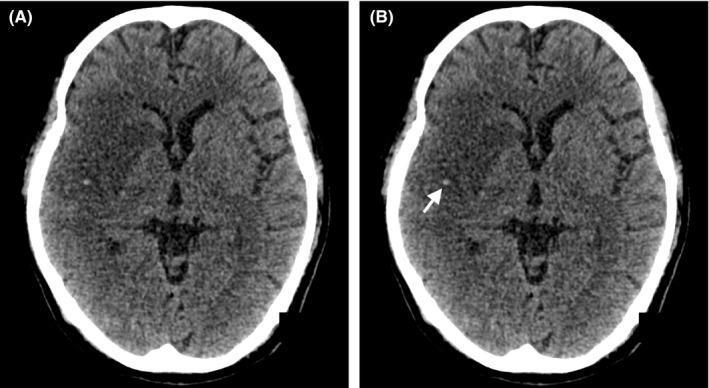
This diagnostic image displays two axial slices (A and B) of a non-contrast enhanced cranial CT scan demonstrating acute ischemic stroke. Image A reveals a large area of hypoattenuation within the right middle cerebral artery (MCA) territory, indicating an established infarct with loss of grey-white matter differentiation and subtle mass effect. In image B, a white arrow highlights the 'MCA dot sign,' characterized by a hyperdense punctate focus within the right Sylvian fissure. This radiological finding represents a thromboembolism within a distal branch of the middle cerebral artery, seen in cross-section. The images are used for medical education to teach early radiological markers of large vessel occlusion and cerebral infarction. Key concepts include identifying arterial hyperdensity (dot sign), assessing territory-specific hypodensity, and recognizing signs of cerebral edema in the context of acute neurological deficits such as hemiplegia.
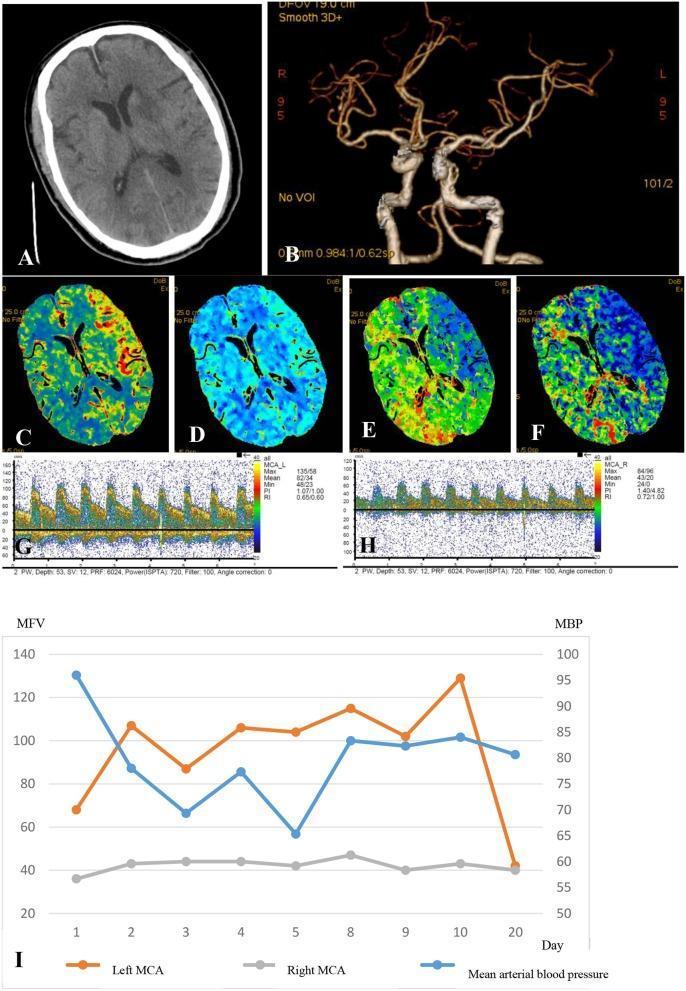
A multi-panel medical image illustrating a case of cerebral hyperperfusion syndrome following mechanical thrombectomy for acute ischemic stroke. Panel (A) is a non-contrast axial CT scan showing a hypodense infarct core in the left perforating middle cerebral artery (MCA) territory. Panel (B) is a CT angiography (CTA) reconstruction demonstrating patent left internal carotid artery (ICA) and MCA post-recanalization. Panels (C-F) present Computed Tomography Perfusion (CTP) maps including Cerebral Blood Flow (CBF), Cerebral Blood Volume (CBV), Mean Transit Time (MTT), and Time to Peak (TTP), highlighting increased CBF and CBV with decreased MTT in the left MCA territory relative to the infarct core. Panels (G-H) show Transcranial Doppler (TCD) waveforms comparing the left and right MCA; the left side demonstrates significantly higher peak systolic velocities and mean flow velocities. Panel (I) is a longitudinal line graph tracking mean flow velocity (MFV) for both MCAs alongside mean arterial blood pressure (MBP) over a 20-day period, documenting the management of hyperperfusion through blood pressure control.
motor homunculus corticospinal tract diagram internal capsule
"ischemic stroke" AND thrombolysis
upper motor neuron facial palsy versus lower motor neuron facial palsy
Where is answer of my previous question