
How different structures retina veiw in Optical coherence tomography and how we diagnose pathology explain me complete in detail
optical coherence tomography OCT retinal layers normal
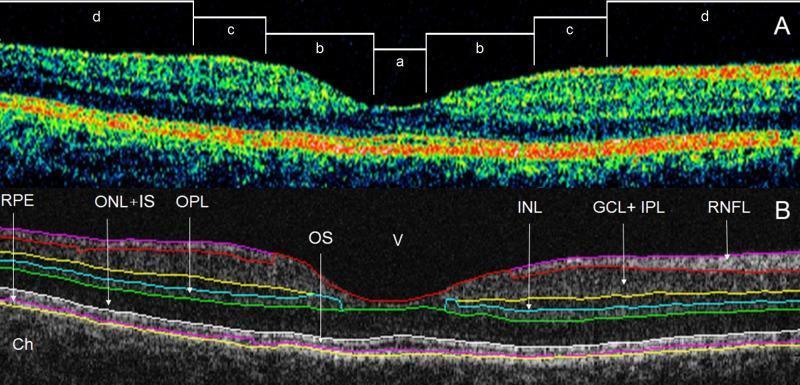
Diagnostic optical coherence tomography (OCT) scans of a healthy human macula, demonstrating retinal layer segmentation using the OCTRIMA program. Panel A displays a cross-sectional B-scan with color-coded reflectance intensities, categorized into four topographical regions: foveolar (a), foveal (b), parafoveal (c), and perifoveal (d). Panel B illustrates the segmented intraretinal boundaries based on optical density. The identified layers include the retinal nerve fiber layer (RNFL), the ganglion cell and inner plexiform layer complex (GCL+IPL), inner nuclear layer (INL), outer plexiform layer (OPL), outer nuclear layer and inner segment of photoreceptors (ONL+IS), outer segment (OS), and retinal pigment epithelium (RPE). The scan highlights normal anatomical features, such as the foveal depression where inner retinal layers thin centrally, leaving predominantly outer layers. Below the hyperreflective RPE/OS complex, the heterogeneous choroid (Ch) is visible, with the hyporeflective vitreous (V) located above the internal limiting membrane. This visual serves as an educational reference for normal retinal architecture and automated software segmentation in ophthalmology.
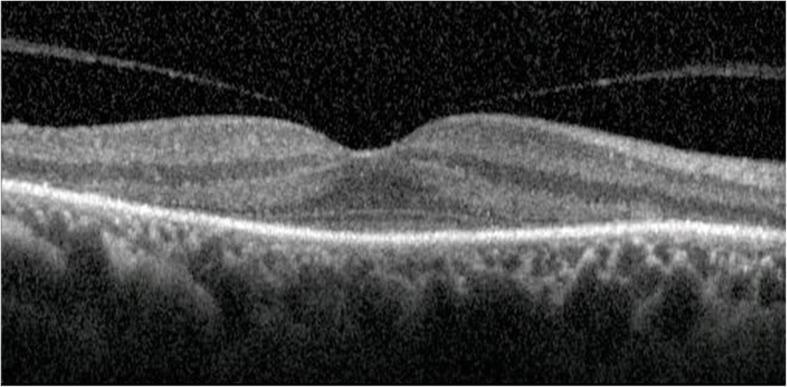
Spectral-domain optical coherence tomography (SD-OCT) of the human macula showing extensive outer retinal atrophy with characteristic foveal sparing. The diagnostic image demonstrates a progressive loss of normal retinal architecture in the extrafoveal regions, specifically the disappearance of the external limiting membrane (ELM), the inner segment/outer segment (IS/OS) junction (ellipsoid zone), the outer nuclear layer (ONL), and the outer plexiform layer (OPL). These affected layers appear thinned and disorganized with altered reflectivity. In contrast, the central foveal region maintains a relatively intact structure and distinct layering. This visual pattern is a key clinical sign often associated with cancer-associated retinopathy (CAR) or other paraneoplastic retinopathies. The OCT scan highlights the pedagogical importance of recognizing differential preservation of central vision despite diffuse peripheral outer retinal degeneration.
This diagnostic image composite presents a normal optical coherence tomography (OCT) scan of the right eye, featuring a cross-sectional retinal profile and a corresponding fundus photograph. The primary OCT image shows the characteristic foveal depression with intact, well-defined retinal layers. High-reflectivity bands (false-colored green/yellow) represent the retinal nerve fiber layer (RNFL), ganglion cell layer, and the outer plexiform/nuclear layers, while darker hypo-reflective regions indicate the inner plexiform and nuclear layers. At the base, a distinct hyper-reflective line signifies the retinal pigment epithelium (RPE) and Bruch's membrane. To the right, a color fundus photograph displays a normal reddish-orange hue with an overlaid grid indicating the macula and foveal region corresponding to the OCT scan. Below, a retinal thickness graph (line plot) visually quantifies the anatomy, showing the characteristic dip in thickness at the fovea. This image is used in ophthalmology to illustrate normal macular anatomy and to serve as a baseline for diagnosing macular holes, edema, or degeneration.
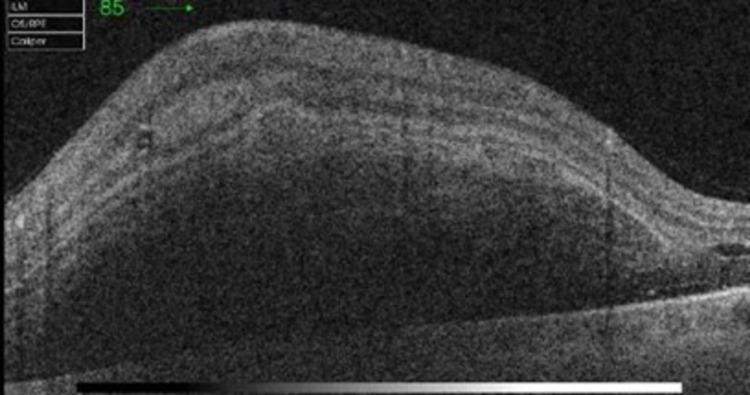
An optical coherence tomography (OCT) cross-sectional scan of the retina showing significant pathological structural alterations. The image demonstrates a massive, convex elevation of the retinal layers caused by a large accumulation of material. Key findings include dense, diffuse hyper-reflectivity localized within the inner retinal layers and the sub-retinal space, consistent with multi-layered (intra-retinal and sub-retinal) hemorrhage. This hyper-reflective material causes significant posterior shadowing, which obscures the underlying details of the outer retina, retinal pigment epithelium (RPE), and choroid. Adjacent to the primary mass, a sub-foveal area of hypo-reflectivity is visible, indicating the presence of sub-retinal serohematic fluid. The normal foveal contour and layered retinal architecture are severely disrupted. This diagnostic image is characteristic of acute macular hemorrhage, often associated with vascular conditions like retinal artery macroaneurysm (RAM) or wet age-related macular degeneration (AMD).
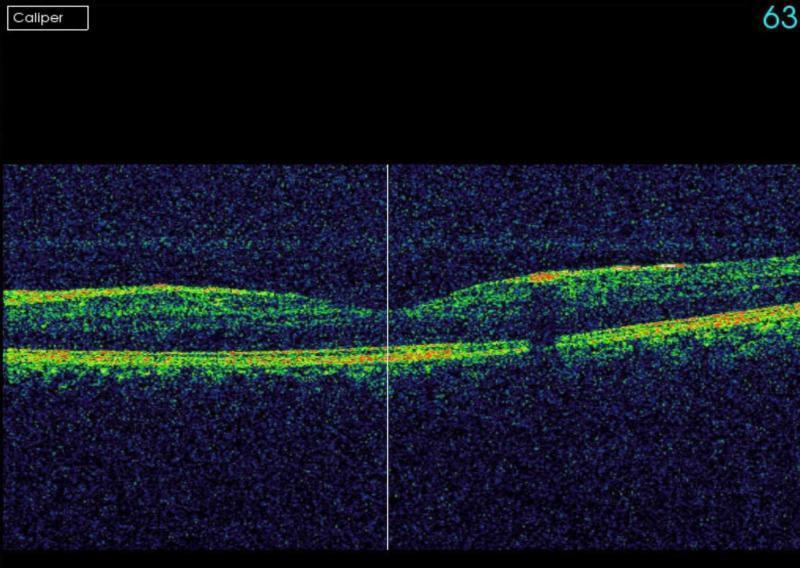
This diagnostic image is an Optical Coherence Tomography (OCT) cross-sectional scan of the human retina, specifically of the macula in the left eye. The scan demonstrates normal retinal architecture with clearly defined, continuous anatomical layers. Key visible features include a distinct, hyperreflective band representing the inner limiting membrane (ILM) and a parallel, highly hyperreflective layer corresponding to the retinal pigment epithelium (RPE) and Bruch's membrane complex. Between these layers, the neurosensory retinal layers exhibit expected variations in reflectivity and thickness. There is no evidence of intraretinal edema, subretinal fluid, retinal thickening, or structural disruptions such as drusen or membrane detachments. The foveal contour appears unremarkable, confirming a normal physiological state in this clinical view. This image serves as a reference for healthy retinal morphology in ophthalmology and optometry education.
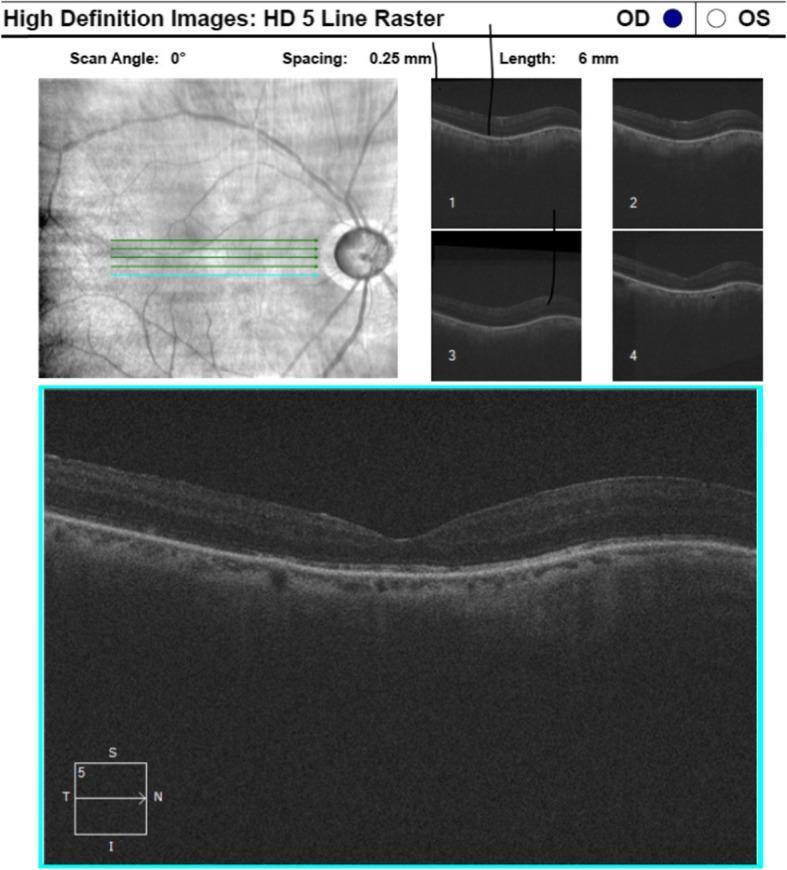
An Optical Coherence Tomography (OCT) report showing a macula scan of the right eye (OD). The visual displays a fundus infrared reflectance image with 5-line raster scan lines and corresponding cross-sectional B-scans. The primary B-scan shows a normal anatomical contour with a preserved foveal depression and intact retinal layers. The inner retinal layers exhibit uniform reflectivity, while the retinal pigment epithelium (RPE) appears as a distinct, hyperreflective band. No evidence of intraretinal or subretinal fluid, macular edema, or subretinal deposits is visible. The underlying choroid is visible and appears relatively thin (consistent with age-related changes or baseline physiology), showing no abnormal vascular formations or elevations. The orientation markers (Superior, Inferior, Temporal, Nasal) indicate the scan covers the temporal-nasal axis through the fovea.
OCT macular degeneration drusen subretinal fluid pathology
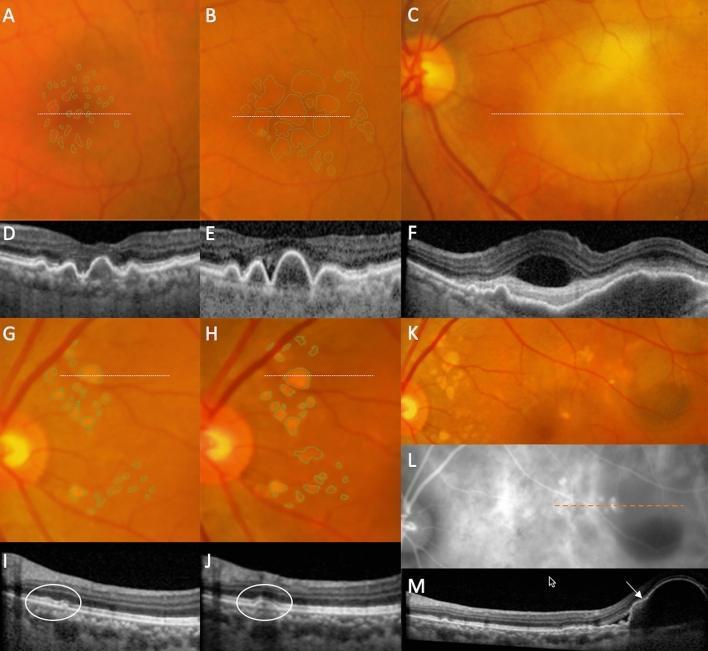
This composite diagnostic image illustrates the longitudinal progression of two subtypes of age-related macular degeneration (AMD): soft drusen (panels A–F) and pachydrusen (panels G–M), using color fundus photography (CFP), optical coherence tomography (OCT), and indocyanine green angiography (ICGA). Panels A–C show the enlargement and confluence of soft drusen over three years, leading to incident exudative macular neovascularization (MNV). Corresponding OCT scans (D–F) reveal an increase in drusen height followed by the development of subretinal fluid, subretinal hyperreflective material (SHRM), and an irregular pigment epithelial detachment (PED). Panels G–K demonstrate pachydrusen progression, characterized by ovoid, well-defined lesions. Panel K shows the development of a hemorrhagic PED, which ICGA (L) confirms as polypoidal choroidal vasculopathy (PCV). The final OCT (M) highlights a polypoidal lesion with associated serous detachment. This comparison highlights the distinct morphological pathways toward advanced exudative disease, emphasizing the role of multimodal imaging in monitoring choroidal vascular changes and drusen dynamics in retinal pathology.
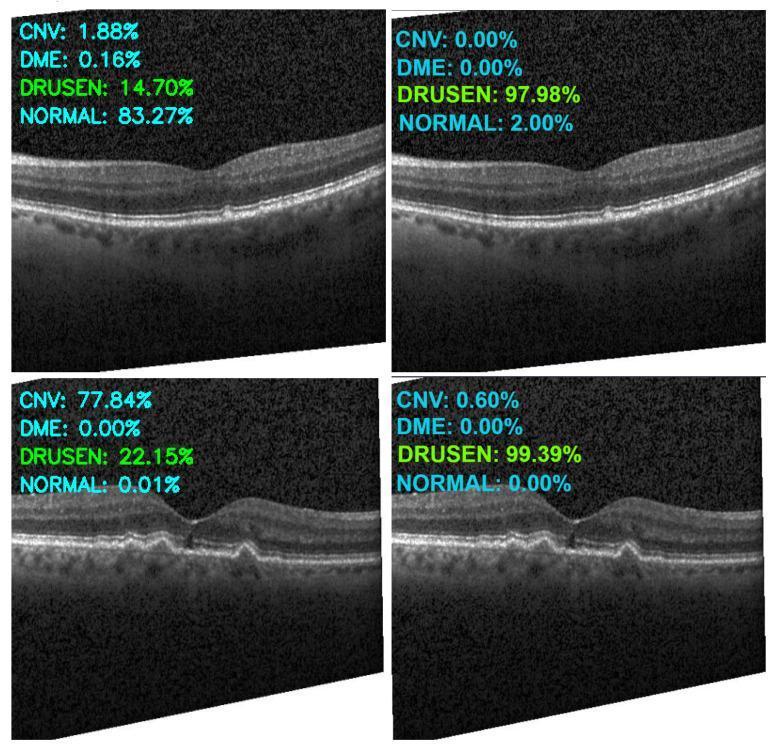
This diagnostic image displays four cross-sectional B-scans of the human retina obtained via Optical Coherence Tomography (OCT). The images are arranged in a 2x2 grid to demonstrate the classification performance of an artificial intelligence model on various macular pathologies. The OCT scans primarily highlight the foveal region and outer retinal layers. Key visible pathology includes subretinal hyperreflective material and undulations of the Retinal Pigment Epithelium (RPE) basement membrane, characteristic of 'Drusen,' which are focal deposits found in age-related macular degeneration. The images in the bottom row specifically show more prominent, dome-shaped elevations of the RPE. Each scan is overlaid with a diagnostic confidence score for four classes: Choroidal Neovascularization (CNV), Diabetic Macular Edema (DME), Drusen, and Normal. The left column represents model predictions without data augmentation, while the right column shows predictions using an augmented training set, illustrating improved diagnostic accuracy for the Drusen class (97.98% and 99.39% respectively) in the presence of subtle pathological features.
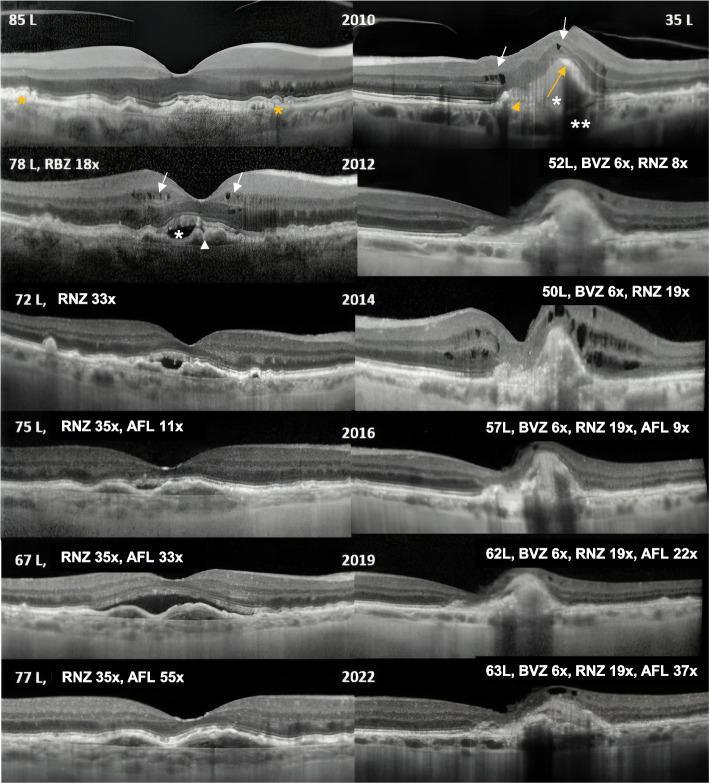
This figure presents a longitudinal comparative timeline of spectral-domain optical coherence tomography (OCT) macular scans for the right eye (RE, left column) and left eye (LE, right column) over a 12-year period (2010–2022). The series documents the progression and management of neovascular age-related macular degeneration (nAMD). At the 2010 baseline, the LE shows advanced pathology including a large pigment epithelial detachment (PED), subretinal hyper-reflective material (SHRM), intraretinal fluid (IRF) cysts, and underlying RPE atrophy with transmission defects. In contrast, the RE baseline demonstrates only drusen. By 2012, the RE develops exudative signs including subretinal fluid (SRF) and IRF. Subsequent scans from 2014 to 2022 track the morphological evolution under anti-VEGF therapy (Ranibizumab, Bevacizumab, and Aflibercept, as indicated by labels). The timeline illustrates fluctuating fluid levels and eventual stabilization, with the RE showing a relatively preserved foveal contour and the LE exhibiting chronic architectural distortion, subretinal fibrosis, and RPE atrophy by 2022. Annotations highlight specific features: white arrows for IRF, asterisks for SRF/SHRM, and orange markers for RPE/PED abnormalities.
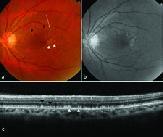
This multimodal diagnostic image set illustrates the clinical features of Age-related Macular Degeneration (AMD) through fundus photography, red-free imaging, and Spectral-Domain Optical Coherence Tomography (SD-OCT). The color fundus photograph displays yellowish-white soft drusen at the fovea with scattered dot-like subretinal drusenoid deposits (SDD) in the perifoveal region. The red-free image provides enhanced contrast, more clearly delineating the SDD against the retinal background compared to the soft drusen. The cross-sectional SD-OCT scan reveals specific morphological differences: soft drusen appear as smooth, dome-shaped elevations beneath the retinal pigment epithelium (RPE), whereas SDDs are identified as sharp, peaked, hyperreflective lesions located above the RPE (subretinal space), specifically disrupting the ellipsoid zone. This comparison highlights the importance of multimodal imaging in distinguishing between classical drusen and subretinal drusenoid deposits, which are critical markers in monitoring the progression of macular pathology.
OCT macular hole epiretinal membrane vitreoretinal pathology
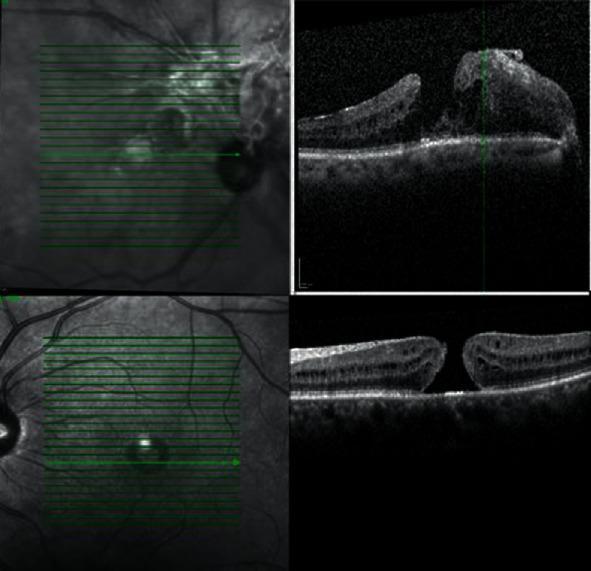
This composite diagnostic image displays macular Optical Coherence Tomography (OCT) scans and corresponding fundus images for both eyes, illustrating advanced vitreoretinal pathology. The top panels show the right eye (OD) exhibiting a lamellar macular hole. A prominent, hyperreflective epiretinal membrane (ERM) is visible, extending from the optic nerve head to the fovea, exerting tangential traction that has resulted in intra-retinal edema and structural disruption. The bottom panels show the left eye (OS) demonstrating a full-thickness macular hole (FTMH), characterized by a complete absence of neurosensory retinal tissue at the fovea, creating a distinct vertical void through all retinal layers. Fundus images on the left utilize green raster scan indicators to map the cross-sectional OCT segments. This clinical visualization is essential for differentiating partial versus full-thickness macular defects and assessing the impact of epiretinal traction on retinal architecture in ophthalmology.
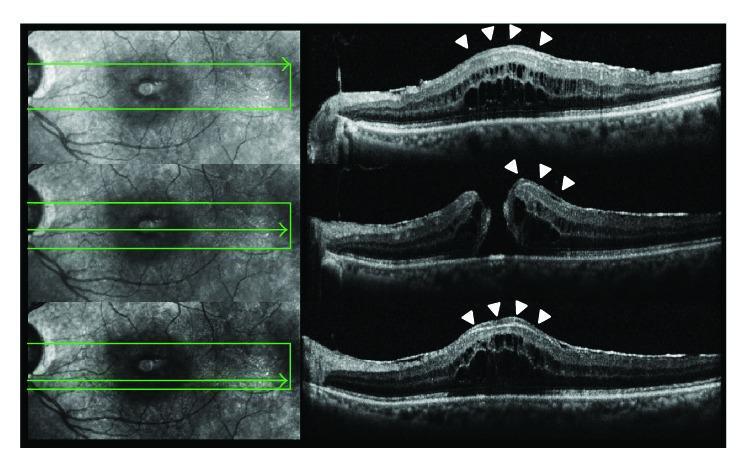
Diagnostic optical coherence tomography (OCT) of the human retina demonstrating a full-thickness macular hole (FTMH) associated with lamellar macular hole-associated epiretinal proliferation (LHEP). The image presents a composite of three vertical pairs: the left panel shows infrared fundus images with green horizontal scan lines indicating the cross-sectional path, while the right panel shows corresponding B-scan OCT images. The central OCT scan clearly reveals a full-thickness defect in the fovea extending from the internal limiting membrane (ILM) through to the photoreceptor layer. Distinctive features include a 'fluid cuff' surrounding the edges of the FTMH, marked by white arrowheads, which appears as hyporeflective intraretinal cystic spaces indicative of subretinal and intraretinal fluid accumulation. The hole exhibits an hourglass morphology where the minimum diameter is situated in the middle retinal layers. There is a notable disruption of the ellipsoid zone (EZ) and external limiting membrane (ELM) at the base of the hole. This visual is significant for diagnosing advanced macular pathology and planning surgical vitreoretinal intervention.
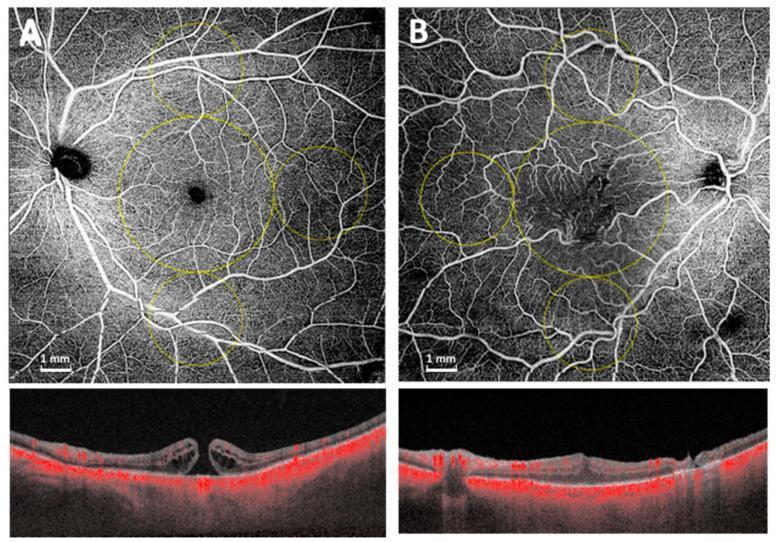
Educational diagnostic comparison using widefield Optical Coherence Tomography Angiography (OCTA) and structural OCT to distinguish between a full-thickness macular hole (MH) and an epiretinal membrane (ERM). Panel A displays a 12x12 mm OCTA scan of the superficial capillary plexus (SCP) in a patient with a macular hole, showing an enlarged foveal avascular zone (FAZ) and rarefied macular capillary density. The corresponding structural B-scan shows a full-thickness foveal defect with intraretinal cystic changes and elevated edges. Panel B displays an OCTA scan of an ERM, showing a more preserved FAZ but with tortuous vascular patterns. The corresponding structural B-scan reveals a hyperreflective band on the inner retinal surface causing tractional distortion and inner retinal thickening. Yellow circular overlays indicate the standardized 5 mm macular annulus and 3 mm mid-peripheral regions used for quantitative vascular analysis. This content is designed for intermediate to advanced ophthalmology education, focusing on vitreoretinal pathology and advanced imaging interpretation.
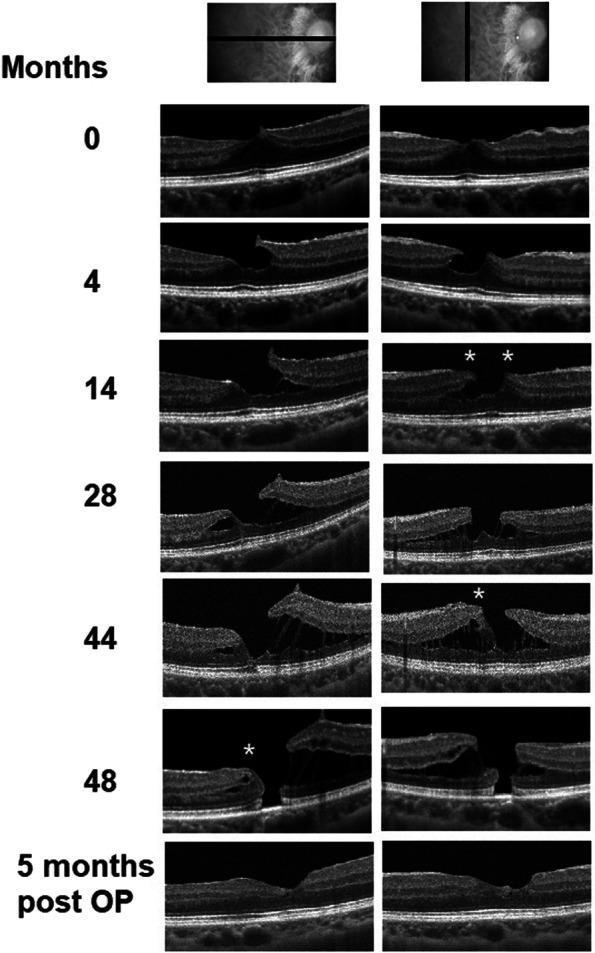
This composite diagnostic image features a series of Spectral-Domain Optical Coherence Tomography (SD-OCT) B-scans documenting the progression and treatment of a macular pathology over a 4-year period. The sequence illustrates the evolution of a lamellar macular hole (LMH) into a full-thickness macular hole (FTMH). At month 0, initial vitreoretinal traction is visible. By month 4, a tractional LMH forms, characterized by an irregular foveal contour. From month 14 to 44, the scans demonstrate the development of epiretinal proliferation (EP), marked by asterisks (*), appearing as medium-reflective material on the inner retinal surface. Concurrently, there is progressive dehiscence of the retinal layers and increasing foveal thinning. At month 48, the pathology has transitioned to a FTMH with complete discontinuity of all neurosensory retinal layers, including the ellipsoid zone. The final row, labeled '5 months post OP', shows the anatomical outcome following a pars plana vitrectomy with an inverted internal limiting membrane (ILM) flap; the scans demonstrate a successfully sealed macular hole with restored retinal continuity and improved macular architecture.
OCT glaucoma retinal nerve fiber layer RNFL optic disc
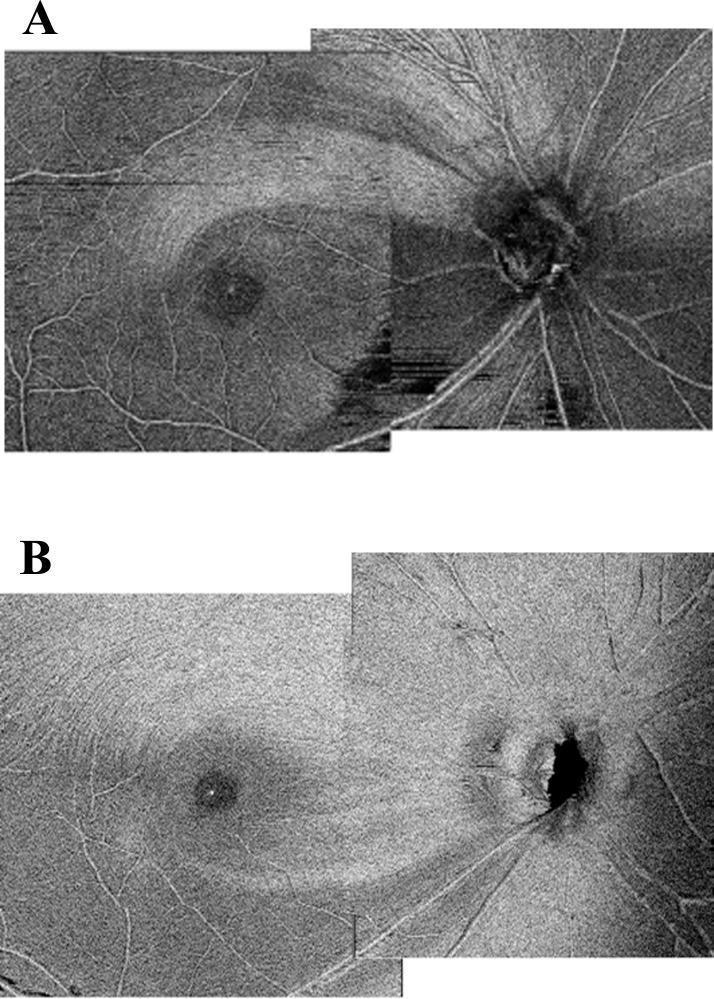
Diagnostic en-face optical coherence tomography (OCT) images of the human retina, illustrating two distinct patterns of Retinal Nerve Fiber Layer (RNFL) degradation associated with glaucoma or optic neuropathy. Panel A demonstrates localized, severe damage to the papillomacular bundle, characterized by a significant loss of nerve fiber density and disrupted texture between the optic disc and the macula. Only sparse, residual nerve fibers are visible in this critical functional zone. Panel B displays a diffuse RNFL defect, where thinning is widespread across the posterior pole rather than confined to a specific bundle. The overall texture in Panel B appears paler and more uniform due to global fiber attrition, with a marked reduction in the characteristic striations of a healthy RNFL. These images serve as an educational comparison for identifying different morphological presentations of nerve fiber loss, which correlates with visual field deficits observed in Humphrey Field Analyzer (HFA) 10-2 examinations.
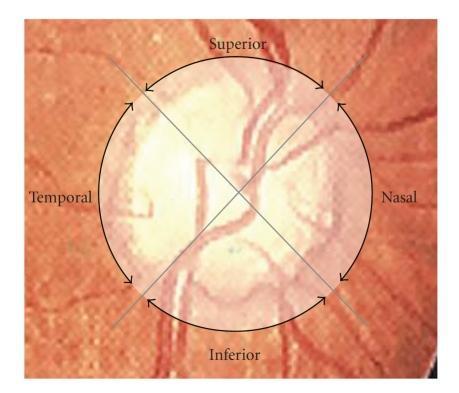
This diagnostic schematic illustrates the methodology for peripapillary retinal nerve fiber layer (RNFL) thickness measurement using Optical Coherence Tomography (OCT). The visual features a fundus photograph centered on the optic disc, overlaid with a 360-degree circular scan path measuring 3.4 mm in diameter. Two intersecting diagonal lines divide the circular scan area into four distinct anatomical quadrants labeled as Superior, Inferior, Nasal, and Temporal. The bright, central region of the image corresponds to the optic nerve head, with visible retinal vasculature emerging and radiating toward the periphery. This diagram demonstrates how OCT software segments the peripapillary region to calculate mean and quadrant-specific RNFL thickness, a critical metric in the clinical assessment and monitoring of glaucoma and other optic neuropathies. The educational focus is on the spatial orientation and standardized partitioning of retinal imaging for diagnostic data acquisition.
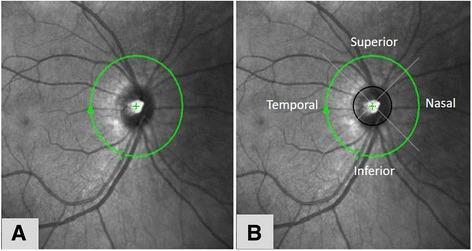
Diagnostic imaging showing fundus photographs with overlaid graphical markers for Retinal Nerve Fiber Layer (RNFL) measurement using Optical Coherence Tomography (OCT). Image A displays a green circular scan (peripapillary ring, typically 3.45 mm in diameter) centered on the optic disc, featuring a central crosshair and a directional arrow indicating the scan path. Image B adds an internal black circle delineating the optic disc margin and four diagonal lines that divide the peripapillary region into functional quadrants: superior, inferior, temporal, and nasal. The underlying anatomy shows the optic disc, emerging retinal vasculature, and subtle striations of the RNFL. This protocol is clinically used for quantifying nerve fiber loss in conditions such as glaucoma or diabetic retinopathy to assess neurodegeneration. The visualization demonstrates the methodology for regional thickness analysis relative to the optic nerve head.
Optical Coherence Tomography (OCT) of the Retina: Complete Guide
What is OCT?
Normal Retinal Layers on OCT
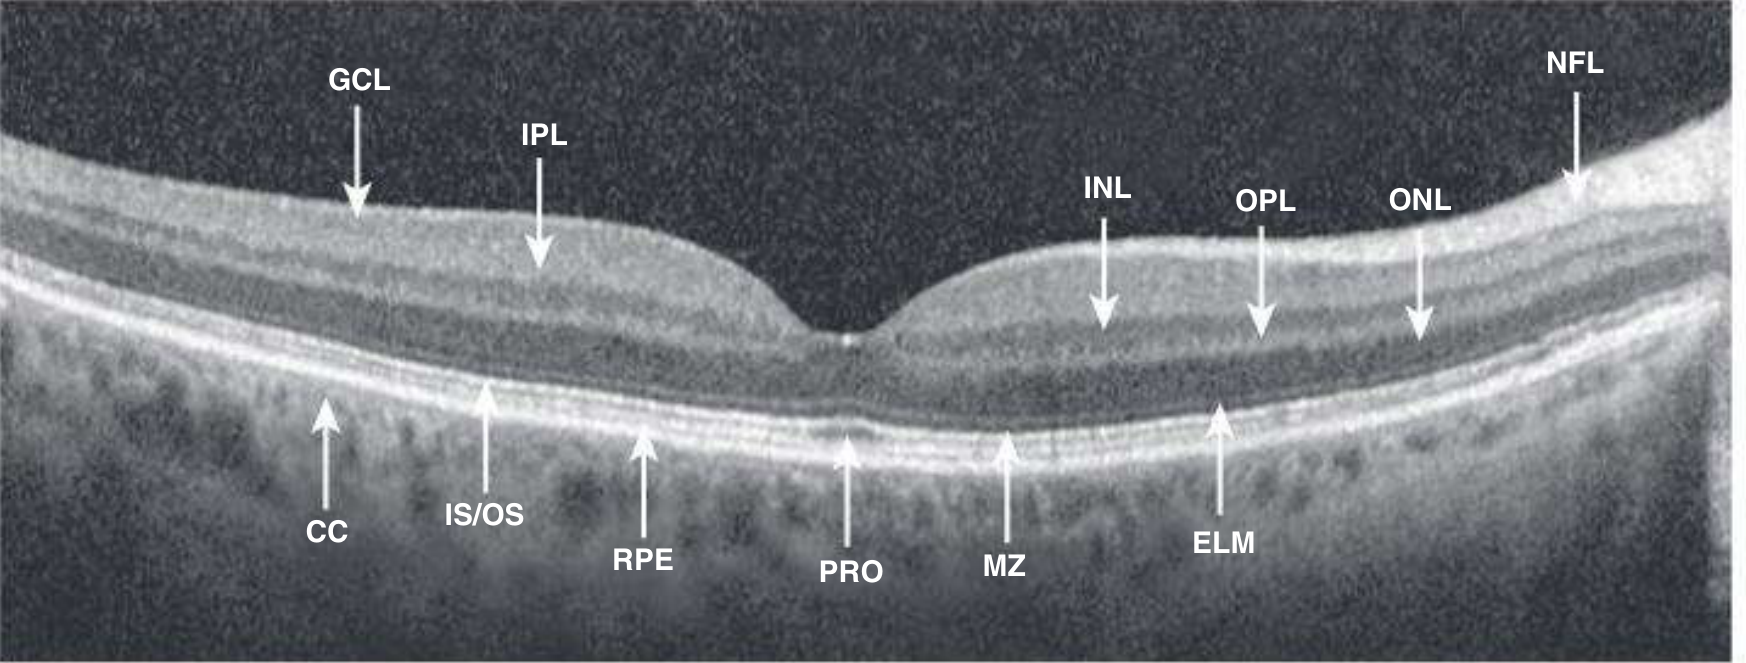
| Layer | OCT Appearance | Notes |
|---|---|---|
| Vitreous | Hyporeflective (black) | Optically transparent |
| Internal Limiting Membrane (ILM) | Thin hyperreflective line | Inner retinal boundary |
| Nerve Fiber Layer (NFL) | Hyperreflective band | Axons of ganglion cells; thickest near disc |
| Ganglion Cell Layer (GCL) | Thin hyporeflective band | Thickest at parafovea |
| Inner Plexiform Layer (IPL) | Hyperreflective | Synapse zone |
| Inner Nuclear Layer (INL) | Hyporeflective | Bipolar, amacrine, horizontal cells |
| Outer Plexiform Layer (OPL) | Hyperreflective | Synapse zone (photoreceptors + bipolars) |
| Outer Nuclear Layer (ONL) | Hyporeflective | Photoreceptor cell bodies; thickest at fovea |
| External Limiting Membrane (ELM) | Thin hyperreflective line | Junction of inner segments and ONL |
| Ellipsoid Zone / IS/OS junction | Bright hyperreflective band | Inner/outer segment junction of photoreceptors; integrity = photoreceptor health |
| Photoreceptor Outer Segments (PRO) | Hyporeflective | Rod and cone outer segments |
| Retinal Pigment Epithelium (RPE) | Bright hyperreflective band | Dense melanin and tight junctions |
| Bruch's Membrane | Thin line fused with RPE | Separates RPE from choroid |
| Choriocapillaris (CC) | Thin reflective layer | Inner choroidal capillary layer |
| Choroid (stroma) | Heterogeneous, deeper signal loss | Large choroidal vessels visible on SS-OCT |
Key Normal Landmarks
- Foveal depression: The inner layers (GCL, IPL, INL) thin out and disappear at the foveal center, leaving only outer layers. This creates the characteristic central dip.
- Ellipsoid zone (EZ): The bright band at the IS/OS junction is a key marker of photoreceptor viability. Loss = photoreceptor death.
- RPE + Bruch's membrane: The bright double band at the base. Elevation of RPE = PED (pigment epithelial detachment).
OCT Terminology You Must Know
| Term | Meaning |
|---|---|
| Hyperreflective | Bright white signal - dense tissue (RPE, NFL, ELM, EZ) |
| Hyporeflective | Dark signal - fluid, cysts, optically clear spaces |
| Shadowing | Dark cone below a hyperreflective lesion (e.g., hemorrhage blocks signal) |
| Enhancement | Increased signal beneath a low-scatter lesion |
| Intraretinal fluid (IRF) | Hyporeflective cystoid spaces within retinal layers |
| Subretinal fluid (SRF) | Hyporeflective space between neurosensory retina and RPE |
| Sub-RPE fluid | Fluid under the RPE (pigment epithelial detachment) |
| SHRM | Subretinal hyperreflective material (fibrin, blood, fibrosis) |
OCT Angiography (OCTA)
Pathological OCT Findings - Disease by Disease
1. Age-Related Macular Degeneration (AMD)
- Drusen = dome-shaped elevations of the RPE above Bruch's membrane, hyperreflective or variably reflective
- Soft drusen: smooth, rounded, confluent RPE elevations
- Subretinal drusenoid deposits (SDDs): peaked hyperreflective lesions above the RPE (in the subretinal space), disrupting the ellipsoid zone
-
Type 1 MNV (sub-RPE): neovascularization is above Bruch's membrane but below the RPE. OCT shows a multilobulated PED with heterogeneous reflectivity and visible vascular elements.
-
Type 2 MNV (subretinal): neovascularization is above the RPE and below the neurosensory retina. Associated with subretinal hyperreflective material (SHRM) and separation of neurosensory retina from RPE.
-
Type 3 MNV / Retinal angiomatous proliferation (RAP): intraretinal origin; OCT shows irregular PEDs, subretinal fluid, intraretinal cysts, and sometimes dilated vascular elements at the outer retinal border.
-
Kanski's Clinical Ophthalmology, 10th Ed.
2. Diabetic Macular Edema (DME)
- Retinal thickening (increase above normal 250 µm foveal thickness)
- Hyporeflective intraretinal cystoid spaces (fluid-filled cysts) in the INL, OPL, or ONL
- Hard exudates appear as hyperreflective foci with posterior shadowing
- Epiretinal membrane may coexist and contribute to tractional edema
- OCTA can detect microvascular changes (capillary non-perfusion, microaneurysms) even before clinical retinopathy appears
- Diffuse retinal thickening (DRT)
- Cystoid macular edema (CME)
- Subretinal fluid (SRF) variant
- Vitreomacular traction contributing variant
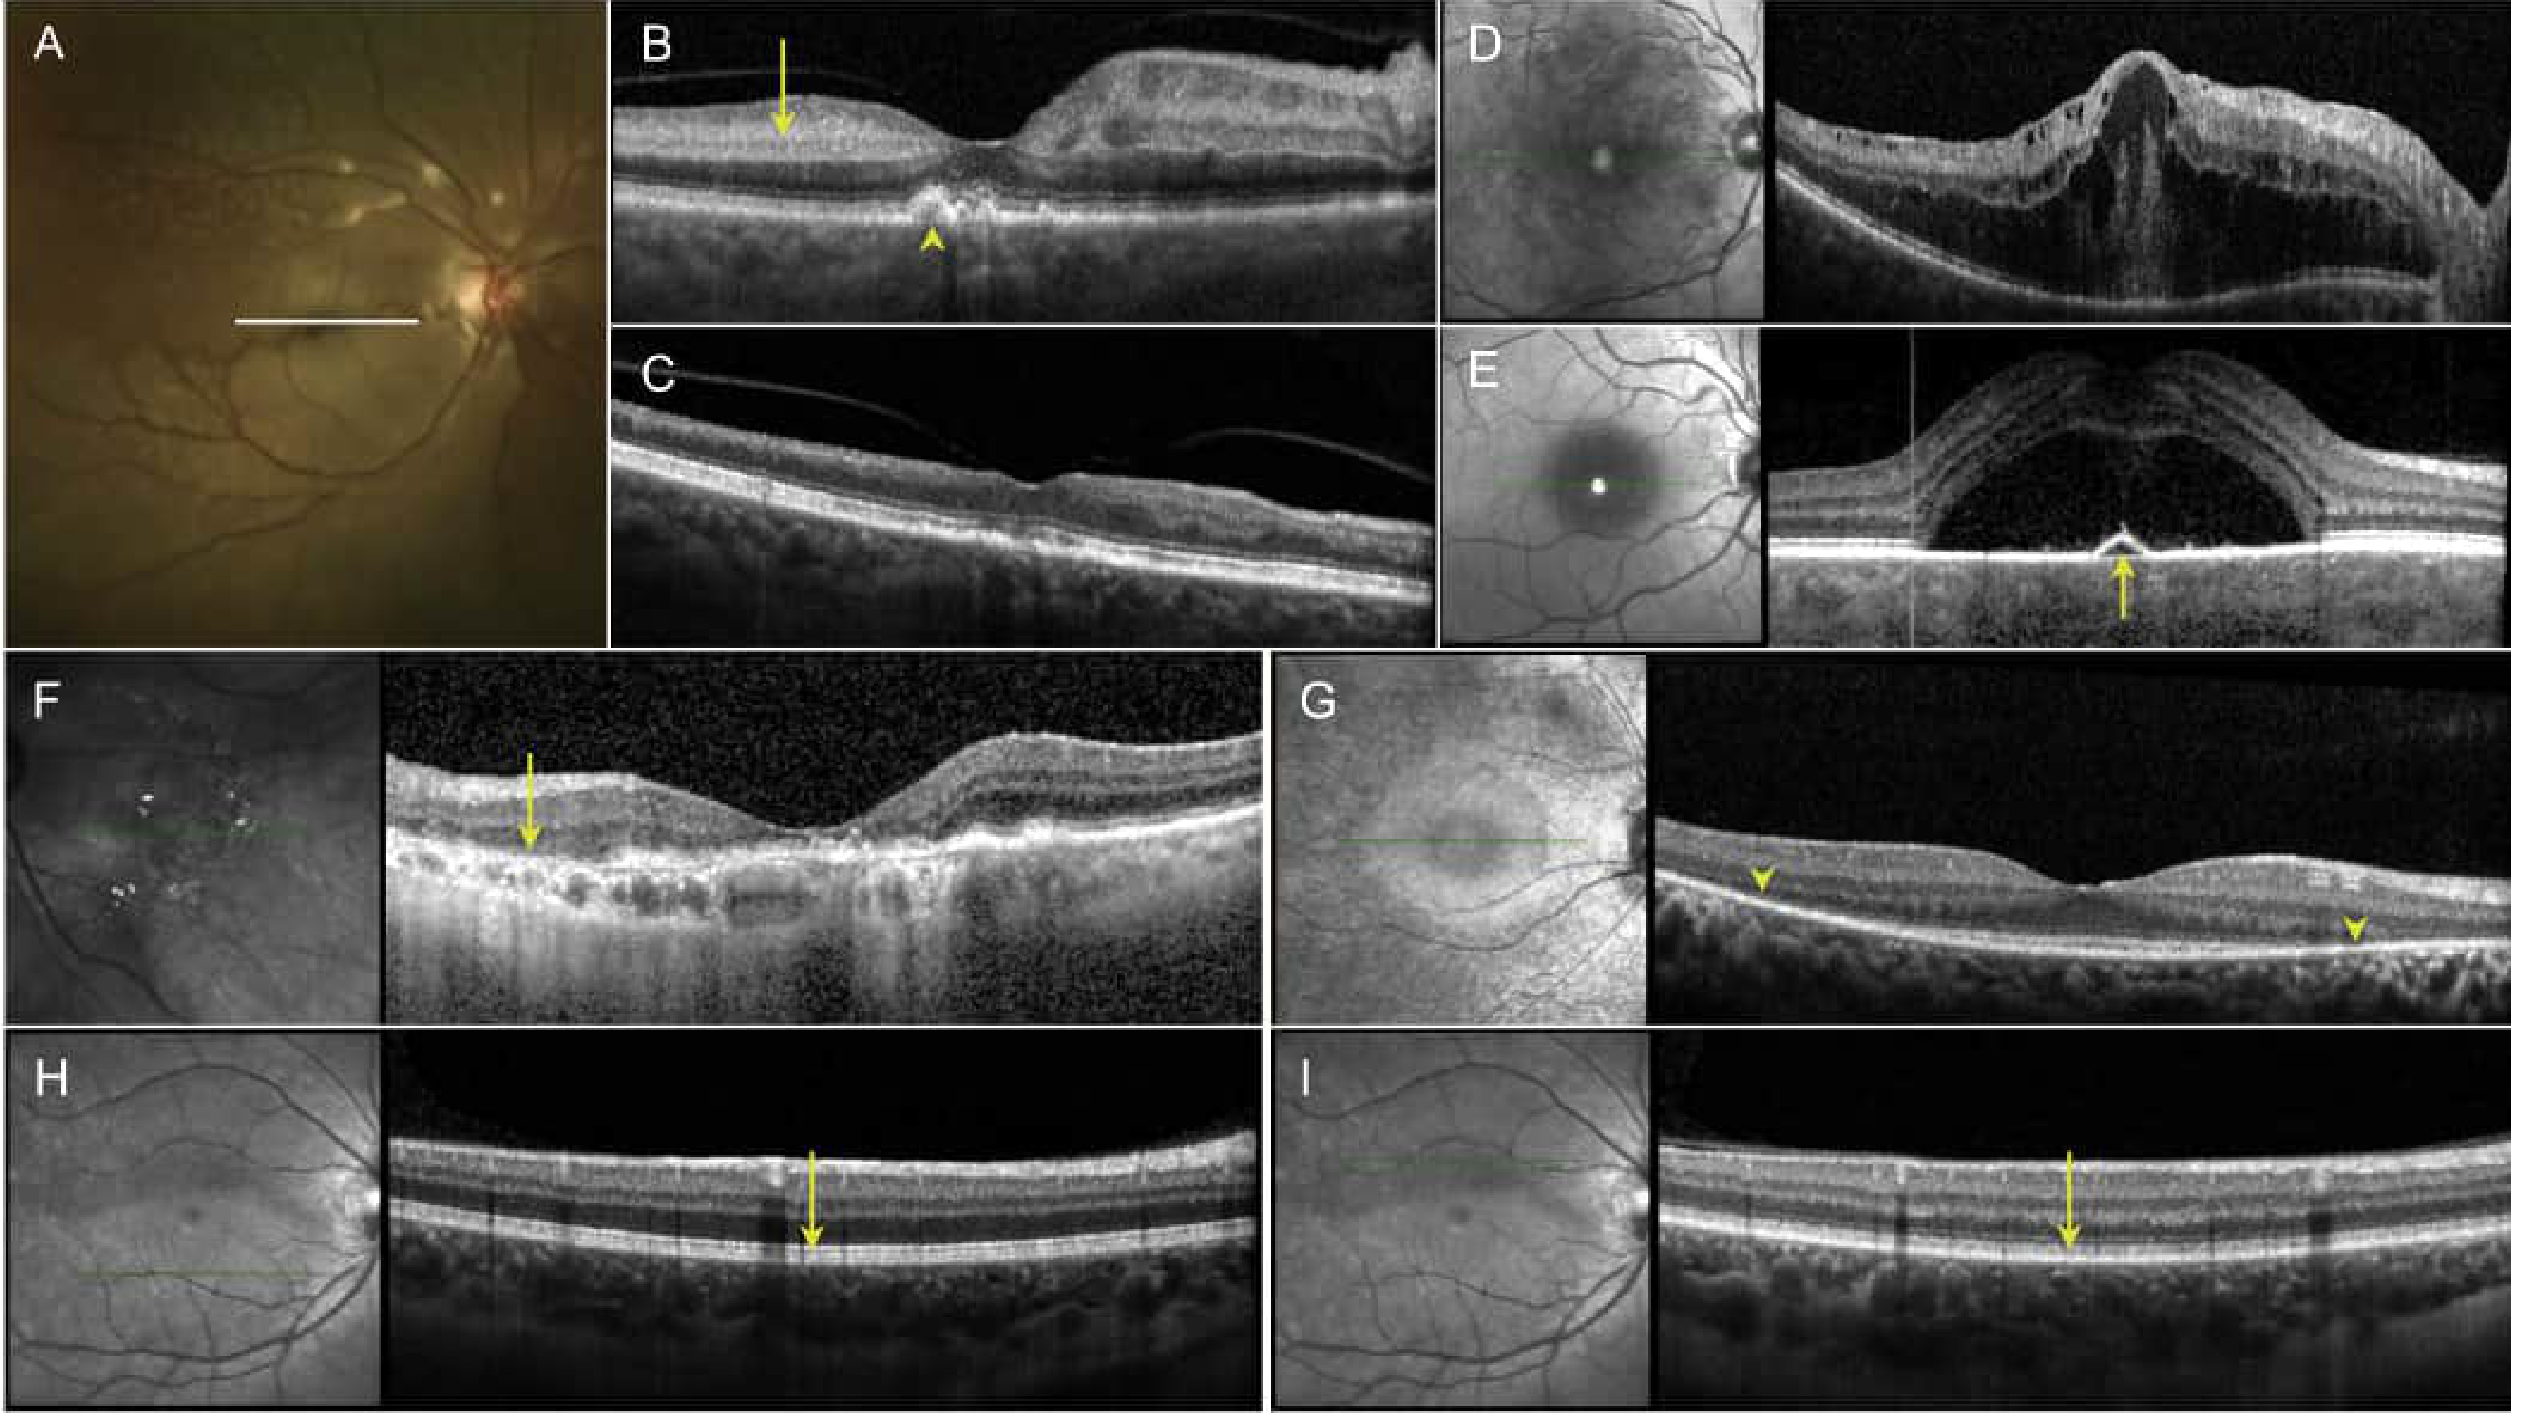
3. Central Serous Chorioretinopathy (CSCR)
-
Neurosensory retinal detachment: clear hyporeflective space below the neurosensory retina and above the RPE (subretinal fluid)
-
RPE may show focal detachment (PED) at the point of fluid leakage
-
Outer retina and ellipsoid zone are initially preserved
-
Chronic CSCR: outer retinal atrophy, EZ disruption, RPE atrophy
-
Choroid on SS-OCT: pachychoroid (abnormally thick choroid with dilated Haller layer vessels called pachyvessels)
-
Bradley and Daroff's Neurology in Clinical Practice
4. Macular Hole
| Stage | OCT Finding |
|---|---|
| 1a (foveal detachment) | Small foveal cyst/hyporeflective space at foveal center, foveal contour flattened |
| 1b (occult hole) | Pseudocyst with roof still intact; inner/outer layer split |
| 2 (small FTMH) | Full-thickness break < 400 µm, vitreous still attached |
| 3 (FTMH) | Full-thickness break ≥ 400 µm, operculum may be visible anteriorly |
| 4 (FTMH + PVD) | Full-thickness hole with complete posterior vitreous detachment |
- Full-thickness void (black gap) through all retinal layers at fovea
- Fluid cuff (hyporeflective intraretinal cysts) at hole edges
- Disruption of ELM and ellipsoid zone at hole margins
- Minimum hole diameter (MHD) measured on OCT predicts surgical outcome
5. Epiretinal Membrane (ERM)
- Thin hyperreflective band on the inner retinal surface (ILM surface), distinct from the underlying NFL
- Causes distortion/wrinkling of inner retinal layers (pseudopucker)
- Tractional retinal thickening, especially in inner nuclear and plexiform layers
- In advanced cases: inner retinal architectural distortion, loss of foveal depression (loss of foveal contour)
- May coexist with lamellar macular hole (partial thickness foveal defect with intact roof)
6. Vitreomacular Traction (VMT)
- Incomplete posterior vitreous detachment - posterior hyaloid remains attached at the fovea
- Vitreous strand (hyperreflective) pulling/tenting the foveal surface upward
- Inner retinal disruption, cystoid spaces
- Foveal elevation with schitic changes
- May progress to full-thickness macular hole
7. Retinal Vein Occlusion (RVO)
- Cystoid macular edema (hyporeflective intraretinal cystoid spaces) in the inner layers
- Subretinal fluid in severe cases
- Hyperreflective foci (lipid exudates, intraretinal hemorrhage)
- Disorganization of retinal inner layers (DRIL) - loss of distinction between GCL, IPL, INL - is an OCT marker of poor visual prognosis
- OCT thickness monitoring guides anti-VEGF therapy
8. Retinal Artery Occlusion (RAO)
- Hyperreflective thickening of inner retinal layers (NFL, GCL, IPL, inner INL) - cytotoxic edema
- Outer retina (photoreceptors, RPE) is preserved (receives blood from choroid)
- Thinning and atrophy of inner retinal layers
- GCL thinning on macular OCT is a sensitive marker
- The outer layers remain relatively preserved - Bradley and Daroff's Neurology in Clinical Practice
9. Glaucoma - RNFL and GCL Analysis
- Measures RNFL thickness by quadrant (superior, inferior, temporal, nasal) and by clock-hour sector
- RNFL thinning = ganglion cell axon loss
- Inferior and superior quadrants are most sensitive (ISNT rule: normally Inferior > Superior > Nasal > Temporal)
- Results compared to age-matched normative database; color-coded: green (normal), yellow (borderline), red (outside normal limits)
- Inner plexiform layer + GCL complex (GCL+IPL) thickness map
- Detects early glaucomatous loss even before RNFL thinning is visible
- Superior hemifield loss corresponds to inferior visual field defect
10. Retinal Detachment vs. Retinoschisis
| Feature | Rhegmatogenous Retinal Detachment (RRD) | Retinoschisis |
|---|---|---|
| Space | Hyporeflective subretinal fluid between neurosensory retina and RPE | Splitting within the retinal layers (usually INL level) |
| Layers | All retinal layers elevated as a unit | Outer and inner retinal layers separated but both present |
| Foveal involvement | When detached, fovea elevated | Outer layer remains down |
| Movement | Changes with position | Stable |
11. Optic Neuritis / Optic Neuropathies (Neurological OCT)
- Multiple sclerosis: RNFL loss and GCL thinning correlate with disability and predict relapses
- Neuromyelitis optica spectrum disorder (NMOSD): more severe RNFL thinning than MS
- Optic neuritis: acute phase may show RNFL edema (thickening), followed by chronic thinning within 3-6 months
- Selective GCL thinning WITHOUT inner retinal involvement = primary optic neuropathy (no bipolar/INL involvement)
- GCL thinning WITH inner retinal layer loss = retinal artery occlusion or retinal ganglion cell disease
Summary: What OCT Measures
| What you look for | Clinical translation |
|---|---|
| Retinal thickness map (ETDRS grid 9 zones) | Monitor DME, RVO response to treatment |
| EZ (ellipsoid zone) integrity | Photoreceptor viability |
| RPE elevation/contour | Drusen, PED, sub-RPE fluid |
| Subretinal/intraretinal fluid | Neovascular AMD, DME, CSCR, RVO |
| RNFL thickness | Glaucoma, optic neuropathy monitoring |
| GCL+IPL thickness | Early glaucoma, neurodegeneration |
| Full-thickness foveal void | Macular hole |
| Epiretinal hyperreflective membrane | ERM/cellophane maculopathy |
| Vitreous attachment at fovea | VMT |
| Inner layer thickening + signal change | Acute ischemia (RAO) |
| Choroidal thickness (SS-OCT) | Pachychoroid spectrum, CSCR |
Key Clinical Points
- OCT is mandatory for diagnosis, staging, and treatment monitoring of all macular diseases - AMD, DME, macular hole, ERM, CSCR, RVO.
- The ellipsoid zone (IS/OS junction) is the single most important indicator of photoreceptor health. Its disruption or absence predicts poor visual recovery.
- DRIL (disorganization of retinal inner layers) in macular edema predicts poor visual prognosis after treatment.
- OCTA adds vascular flow information (neovascularization, FAZ changes, capillary dropout) without contrast injection.
- Swept-source OCT allows better visualization of the choroid and vitreoretinal interface due to its longer wavelength and deeper penetration.
- Serial OCT with registered scans (follow-up mode) allows precise monitoring of even subtle changes over time.
- Kanski's Clinical Ophthalmology: A Systematic Approach, 10th Ed.
- Bradley and Daroff's Neurology in Clinical Practice
- Histology: A Text and Atlas with Correlated Cell and Molecular Biology
Recent oct guide for macular disease
optical coherence tomography macular disease guidelines
OCT macular disease guide 2024 2025 retina imaging recommendations
PMID: 36526863
PMID: 40803536
PMID: 40374931
https://pmc.ncbi.nlm.nih.gov/articles/PMC13091865
PMID: 41034347
PMID: 39824255
PMID: 38775987
OCT biomarkers macular disease intraretinal fluid subretinal fluid SHRM DRIL
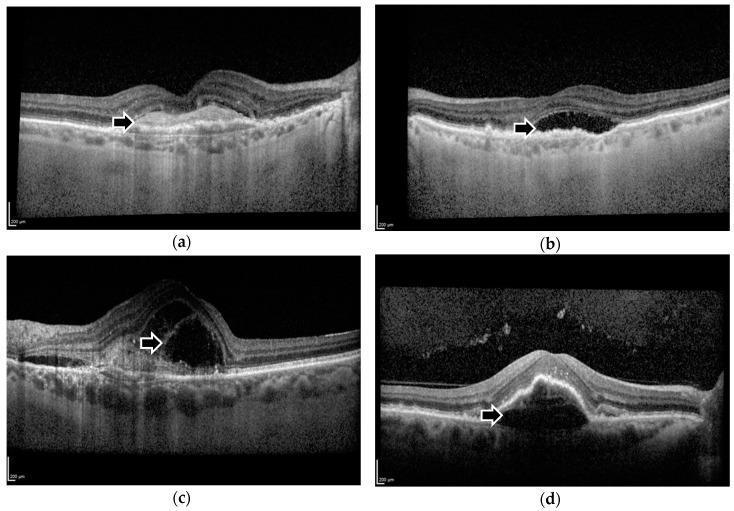
This set of four cross-sectional Spectral-Domain Optical Coherence Tomography (SD-OCT) images of the macula illustrates key biomarkers associated with neovascular age-related macular degeneration (nAMD). Image (a) demonstrates subretinal hyper-reflective material (SHRM), appearing as an irregular, dense, bright mass situated between the neurosensory retina and the retinal pigment epithelium (RPE). Image (b) shows subretinal fluid (SRF), characterized by a distinct hyporeflective (dark) pocket of fluid separating the photoreceptor layer from the RPE. Image (c) displays intraretinal fluid (IRF), visualized as multiple dark cystoid spaces within the inner and outer retinal layers, indicating retinal edema. Image (d) depicts a pigment epithelial detachment (PED), where the RPE is elevated from Bruch’s membrane, forming a dome-shaped space containing fluid or fibrovascular tissue. These biomarkers are critical for diagnostic classification, monitoring disease activity, and evaluating treatment response to anti-VEGF therapies in ophthalmology. The images highlight the differences in reflectivity and anatomical localization essential for identifying exudative retinal disease.
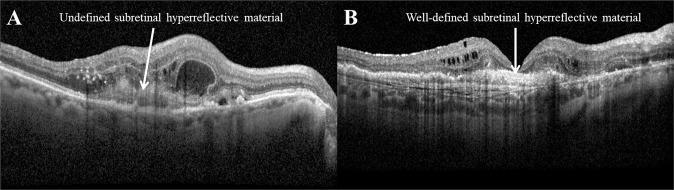
This diagnostic comparison chart utilizes cross-sectional optical coherence tomography (OCT) imaging to demonstrate two distinct morphological presentations of subretinal hyperreflective material (SHRM) in the context of neovascular age-related macular degeneration (nAMD). Image A illustrates 'Undefined SHRM,' characterized by a lesion with relatively low reflectivity and hazy, indistinct borders that blend into the surrounding retinal neural layers. Adjacent intraretinal fluid (hyporeflective spaces) is also visible. Image B illustrates 'Well-defined SHRM,' presenting as a high-reflectivity mass with sharp, clearly delineated boundaries that separate it from the overlying neurosensory retina. The presence and characterization of SHRM serve as critical biomarkers for visual prognosis, as the material often represents a precursor to subretinal fibrosis or the presence of choroidal neovascularization (CNV). The educational focus highlights the importance of distinguishing border definition and internal reflectivity for clinical staging and monitoring treatment response to anti-VEGF therapy.
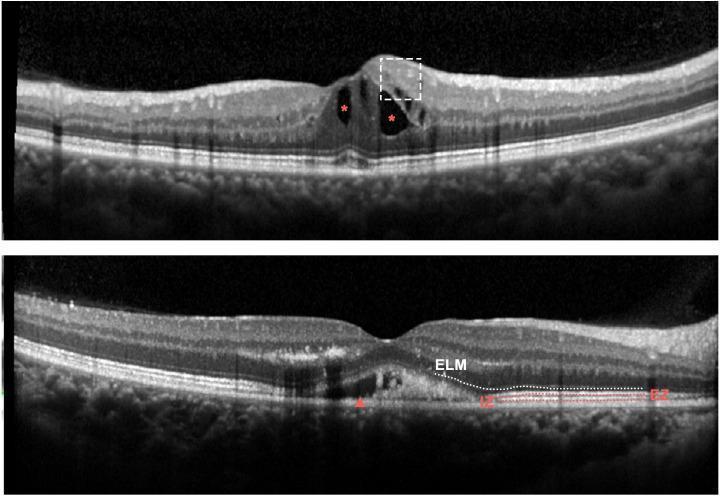
Two cross-sectional spectral-domain optical coherence tomography (SD-OCT) images of the human retina, illustrating characteristic findings in eyes with retinal vein occlusion (RVO) and macular edema. The upper panel demonstrates Disorganization of the Retinal Inner Layers (DRIL), indicated by a white dashed box, where the boundaries between the ganglion cell layer, inner plexiform layer, and inner nuclear layer are indistinguishable. Intraretinal fluid (IRF) is visible as hyporeflective cystoid spaces marked with red asterisks. The bottom panel highlights outer retinal damage, including subretinal fluid (SRF) appearing as a hyporeflective space beneath the neurosensory retina (red arrowhead) and disruption of the External Limiting Membrane (ELM), marked with a white dotted line. Additional labels indicate the Ellipsoid Zone (EZ) and Interdigitation Zone (IZ), highlighting areas of structural discontinuity in the photoreceptor layers. These biomarkers are critical in ophthalmology for assessing disease severity and predicting visual prognosis following anti-VEGF therapy.
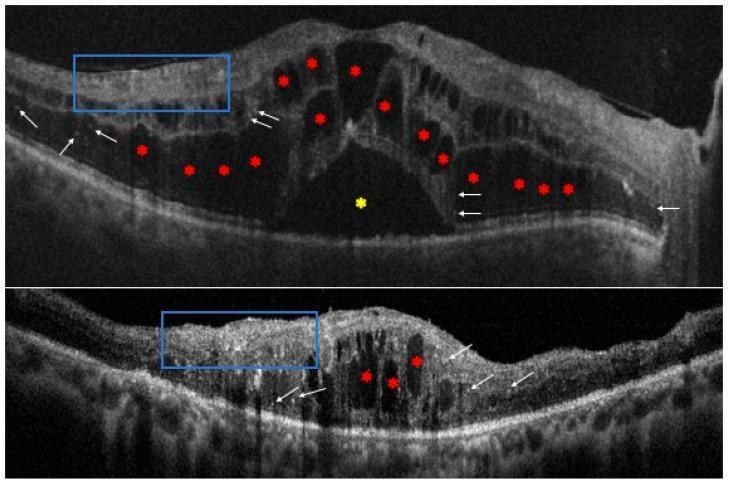
Two diagnostic images consisting of cross-sectional spectral-domain optical coherence tomography (SD-OCT) scans of the retina in patients with diabetic macular edema (DME). The top scan displays significant intraretinal cystic spaces (marked with red asterisks) disrupting the normal foveal contour, alongside a prominent area of subretinal fluid (yellow asterisk). The bottom scan shows further intraretinal cysts and generalized retinal thickening. Both scans highlight key morphological biomarkers: hyperreflective foci (white arrows), which are small, punctate, high-intensity spots scattered across various retinal layers, and Disorganization of the Retinal Inner Layers (DRIL, blue boxes), where the borders between the ganglion cell-inner plexiform layer complex and the inner nuclear layer are no longer identifiable. These features are clinically significant in ophthalmology for assessing disease severity, monitoring response to anti-VEGF or corticosteroid therapy, and predicting visual prognosis in diabetic retinopathy.
Recent OCT Guide for Macular Disease (2023-2026)
Part 1: Guiding Principles - What Every Recent Guideline Agrees On
- All 9 nAMD guidelines reviewed (global): OCT recommended for initial diagnosis - Lim et al., Eye 2025 [PMID: 40374931]
- All 14 DMO guidelines reviewed (global): OCT recommended for initial diagnosis - McAllister et al., Eye 2025 [PMID: 41034347]
- OCT is the primary anatomic endpoint for monitoring anti-VEGF treatment response and adjusting injection intervals in both nAMD and DME
Part 2: The Modern OCT Biomarker Framework
Fluid Biomarkers (most clinically actionable)
| Biomarker | OCT Appearance | Clinical Significance |
|---|---|---|
| Intraretinal Fluid (IRF) | Hyporeflective cystoid spaces within retinal layers | Most important negative prognostic marker in nAMD. Associated with worse visual outcomes. Drives anti-VEGF treatment decisions. |
| Subretinal Fluid (SRF) | Hyporeflective space between neurosensory retina and RPE | More tolerated than IRF in some treat-and-extend protocols; small amounts of SRF may be acceptable between injections |
| Pigment Epithelial Detachment (PED) | Dome-shaped RPE elevation above Bruch's membrane | Indicates sub-RPE fluid or fibrovascular tissue; multilobulated PED suggests Type 1 MNV |
Structural/Prognostic Biomarkers
| Biomarker | OCT Appearance | Clinical Significance |
|---|---|---|
| SHRM (Subretinal Hyperreflective Material) | Dense bright mass between neurosensory retina and RPE | Represents fibrin, blood, neovascular tissue, or fibrosis. Well-defined SHRM = worse prognosis. Key marker of Type 2 MNV |
| HRF (Hyperreflective Foci) | Small punctate bright spots in retinal layers | Represent activated microglia/macrophages or lipid exudates. Moderate certainty evidence: associated with -6.5 to -7.3 ETDRS letters worse VA at 6-12 months in DME |
| DRIL (Disorganization of Retinal Inner Layers) | Loss of distinct boundaries between GCL/IPL/INL | Moderate certainty evidence: associated with -6.0 to -7.3 letters worse VA. Strong negative prognostic marker in DME and RVO |
| EZ Disruption (Ellipsoid Zone) | Break or absence of the bright IS/OS band | Moderate certainty evidence: associated with -5.4 to -9.7 letters worse VA in DME. Indicates photoreceptor death |
| ELM Disruption (External Limiting Membrane) | Break in the thin hyperreflective line above EZ | Co-occurs with EZ disruption; confirms outer retinal damage |
| COST line disruption (Cone Outer Segment Tip) | Loss of the band between EZ and RPE | Associated with -8.5 to -8.8 letters worse VA at 12-24 months |
- Source: Nanji et al., Ophthalmology 2026 - Systematic Review & Meta-analysis [PMID: 40803536]
Part 3: Disease-Specific OCT Protocols (Current Guidelines)
A. Neovascular AMD (nAMD) - 2025 Global Guideline Consensus
- OCT mandatory: identifies fluid type, PED morphology, RPE status
- All 9 reviewed global CPGs recommend OCT for diagnosis
- Type 1 (sub-RPE): multilobulated PED with heterogeneous reflectivity
- Type 2 (subretinal): SHRM + neurosensory retinal elevation above RPE
- Type 3 (intraretinal/RAP): intraretinal cysts + irregular PED + dilated outer retinal vessels
- IRF - most important; worst impact on visual outcomes
- SHRM - indicates active neovascularization or fibrosis
- Drusen - risk stratification for conversion
- ORT (Outer Retinal Tubulations) - marker of chronic/end-stage disease, often branching pseudodendritic pattern
- HF (Hyperreflective Foci) - inflammation/lipid activity marker
- Source: Hanson et al., Eye 2023 - Systematic Review [PMID: 36526863]
- 7/9 global CPGs recommend using OCT to guide anti-VEGF interval adjustment
- Resolution of IRF and SRF = treatment success endpoint
- Persistent IRF despite treatment = indicator for switching anti-VEGF agent
B. Diabetic Macular Edema (DME) - 2025 Global Guideline Consensus
| Pattern | Description | Implication |
|---|---|---|
| Diffuse Retinal Thickening (DRT) | Generalized sponge-like thickening | Anti-VEGF first line |
| Cystoid Macular Edema (CME) | Multiple hyporeflective cystoid spaces | Anti-VEGF ± steroid |
| SRF variant | Subretinal fluid component | May respond to anti-VEGF |
| VMT-associated | Vitreous attachment causing traction | PPV may be needed |
- Worst prognosis: disrupted EZ + ELM + COST line (up to -9.7 letters)
- DRIL: strongly predicts poor response to any treatment
- HRF: predicts worse VA at 6, 12, 24 months
- HCF (Hyperreflective Choroidal Foci): also associated with worse outcomes
C. Polypoidal Choroidal Vasculopathy (PCV) - APVRS 2025 Consensus
- Large, steep PED ("thumb-like" or "notched" PED) - highly characteristic
- Double-layer sign (fluid between RPE and Bruch's membrane)
- Notch sign at PED margin
- Hyperreflective ring at polypoidal lesion base on cross-sectional OCT
- OCTA non-ICGA features are now validated for diagnosis and treatment monitoring
- Can detect branching vascular network (BVN) on en face slabs
- Recommended as a complement or alternative to ICGA in follow-up (not for initial diagnosis where ICGA still preferred)
Part 4: OCTA Protocol in AMD - 2026 Expert Consensus
| Clinical scenario | Recommended scan size | Key slab | Purpose |
|---|---|---|---|
| Type 1 MNV | 6×6 mm | Sub-RPE slab (Bruch's to choroid) | Detect sub-RPE flow/vessel network |
| Type 2 MNV | 3×3 or 6×6 mm | ORCC slab (outer retina to choriocapillaris) | Visualize neovascular network above RPE |
| Type 3 MNV | 6×6 mm | Outer retina slab | Detect intraretinal flow signals |
| Geographic atrophy | 6×6 mm | Choriocapillaris slab | Detect complicating MNV; assess CC perfusion |
| Early/intermediate AMD | 6×6 mm | Outer retina + ORCC | Screen for subclinical non-exudative MNV |
| Ambiguous SHRM | 3×3 mm first | ORCC slab + cross-sectional | Confirm/exclude neovascular component |
Part 5: Macular Hole - 2024 German S1 Guideline
| OCT finding | Stage | Action |
|---|---|---|
| Foveal cyst only, no full-thickness break | Stage 1 | Observe or ocriplasmin if VMT |
| Full-thickness break <400 µm | Stage 2 | PPV + ILM peel + gas tamponade |
| Full-thickness break ≥400 µm | Stage 3 | PPV + ILM peel; inverted ILM flap for large holes |
| Full-thickness break + complete PVD | Stage 4 | PPV + ILM peel |
| Lamellar hole + ERP (epiretinal proliferation) | Lamellar | Observe vs PPV (controversial) |
| Pseudohole (ERM with normal fovea) | - | ERM peel if symptomatic |
- Full-thickness macular hole (FTMH): complete void through ALL layers
- Lamellar macular hole: inner foveal defect, outer retina intact
- Pseudohole: normal foveal contour seen through an ERM window
- Foveoschisis: splitting of layers without true hole (common in myopia)
Part 6: The Emerging Role of AI in OCT Interpretation
- AI models can now identify and quantify most of the 9 key OCT biomarkers in nAMD (IRF, SRF, PED, SHRM, drusen)
- The 2024 OCTDL dataset (2,000+ labeled OCT images) demonstrates AI diagnostic accuracy comparable to experienced ophthalmologists
- Future guidelines will likely incorporate AI-assisted biomarker grading for treatment decisions
Quick Reference: OCT Biomarker Impact on Visual Prognosis
| Biomarker | Disease | Impact on VA (letters lost vs no biomarker) | Evidence level |
|---|---|---|---|
| Disrupted EZ or ELM | DME | -7.5 to -9.7 at 6-12 months | Moderate certainty |
| Disrupted COST line | DME | -8.5 to -8.8 at 12-24 months | Moderate certainty |
| DRIL | DME/RVO | -6.0 to -7.3 at 6-12 months | Moderate certainty |
| HRF | DME | -6.5 to -7.3 at 6-12 months | Moderate certainty |
| HCF | DME | -7.3 to -7.5 at 6-12 months | Moderate certainty |
| IRF | nAMD | Most significant negative predictor | High |
| SHRM (well-defined) | nAMD | Worse than undefined SHRM | Moderate |
Summary: What Has Changed in Recent OCT Guidelines
| Old approach | Current (2023-2026) approach |
|---|---|
| Report "fluid present/absent" | Specify IRF vs SRF vs sub-RPE fluid and quantify |
| MNV = one entity | Type 1/2/3 MNV classification mandatory |
| OCT alone for drusen | Multimodal: OCT + FAF + OCTA for AMD staging |
| Minimum number of injections then observe | OCT-guided treat-and-extend, using biomarkers to adjust intervals |
| Subjective fluid assessment | AI-assisted volumetric quantification emerging |
| OCTA as experimental | OCTA now recommended in specific clinical scenarios (PCV, nAMD follow-up) |
| Macular hole: "big or small" | OCT minimum diameter + morphology guides surgical technique choice |