
Arterial blood gas
Reading File
Arterial blood gas (ABG) interpretation involves analyzing pH, PaCO2, PaO2, HCO3-, and SaO2 to assess ventilation, oxygenation, and acid-base status. Normal values: pH 7.35-7.45, PaCO2 35-45 mmHg, PaO2 80-100 mmHg, HCO3- 22-26 mEq/L.
Searching sources...
Finding Sources
Finding Sources
Reading File
Reading File
Reading File
Reading File
Reading File
Finding Sources
Loading Image
Reading File
Finding Sources
Reading File
Finding Sources
Reading File
Here is a thorough reference guide on Arterial Blood Gas (ABG) analysis, synthesized from multiple authoritative textbooks.
Arterial Blood Gas (ABG) Analysis
What Is an ABG?
An ABG directly measures pH, PaCO2, and PaO2 from an arterial blood sample and is the gold standard for assessing oxygenation, ventilation, and acid-base status. HCO3- is calculated using the Henderson-Hasselbalch equation. Blood gas analyzers may also report lactate, total hemoglobin, and serum electrolytes. - Tintinalli's Emergency Medicine, p. 121
Normal Values
| Parameter | Normal Range |
|---|---|
| pH | 7.35 - 7.45 |
| PaCO2 | 35 - 45 mmHg (4.5 - 6 kPa) |
| PaO2 | 80 - 100 mmHg (11 - 14 kPa) |
| HCO3- | 22 - 28 mEq/L |
| Anion Gap | 10 - 16 mEq/L |
| SaO2 | 95 - 100% |
Bailey and Love's Short Practice of Surgery, 28th Edition, p. 5115
Step-by-Step Interpretation
Step 1: Determine pH Status
- Acidosis = pH < 7.35
- Alkalosis = pH > 7.45
- Normal = pH 7.35-7.45 (but a disorder + compensation may still exist)
Step 2: Identify the Primary Disorder
| pH | PaCO2 | HCO3- | Primary Disorder |
|---|---|---|---|
| Low (< 7.35) | High (> 45) | Normal/High | Respiratory Acidosis |
| High (> 7.45) | Low (< 35) | Normal/Low | Respiratory Alkalosis |
| Low (< 7.35) | Normal/Low | Low (< 22) | Metabolic Acidosis |
| High (> 7.45) | Normal/High | High (> 26) | Metabolic Alkalosis |
Step 3: Assess for Expected Compensation
Compensation is never complete - it only moves pH toward normal, not to normal.
| Primary Disorder | Compensation | Expected Change |
|---|---|---|
| Metabolic acidosis | Hyperventilation (↓ PCO2) | ΔPCo2 = 1.3 × ΔHCO3- (Winter's formula: PCO2 = 1.5×HCO3- + 8 ± 2) |
| Metabolic alkalosis | Hypoventilation (↑ PCO2) | ΔPCO2 = 0.6 × ΔHCO3- |
| Acute respiratory acidosis | Renal HCO3- retention | HCO3- ↑ by 1 mEq/L per 10 mmHg ↑ PCO2 |
| Chronic respiratory acidosis | Full renal compensation | HCO3- ↑ by 3.5-5 mEq/L per 10 mmHg ↑ PCO2 |
| Acute respiratory alkalosis | Renal HCO3- excretion | HCO3- ↓ by 2 mEq/L per 10 mmHg ↓ PCO2 |
| Chronic respiratory alkalosis | Full renal compensation | HCO3- ↓ by 5 mEq/L per 10 mmHg ↓ PCO2 |
Roberts and Hedges' Clinical Procedures in Emergency Medicine, p. 4814
If compensation is outside the expected range, a mixed disorder is present.
Step 4: Calculate the Anion Gap (if metabolic acidosis)
Anion Gap (AG) = Na+ - (Cl- + HCO3-)
- Normal = 8-12 mEq/L (or up to 16 if albumin-uncorrected)
Acid-Base Map
The diagram below plots pH vs. PCO2 and maps each acid-base zone, including mixed disorders:
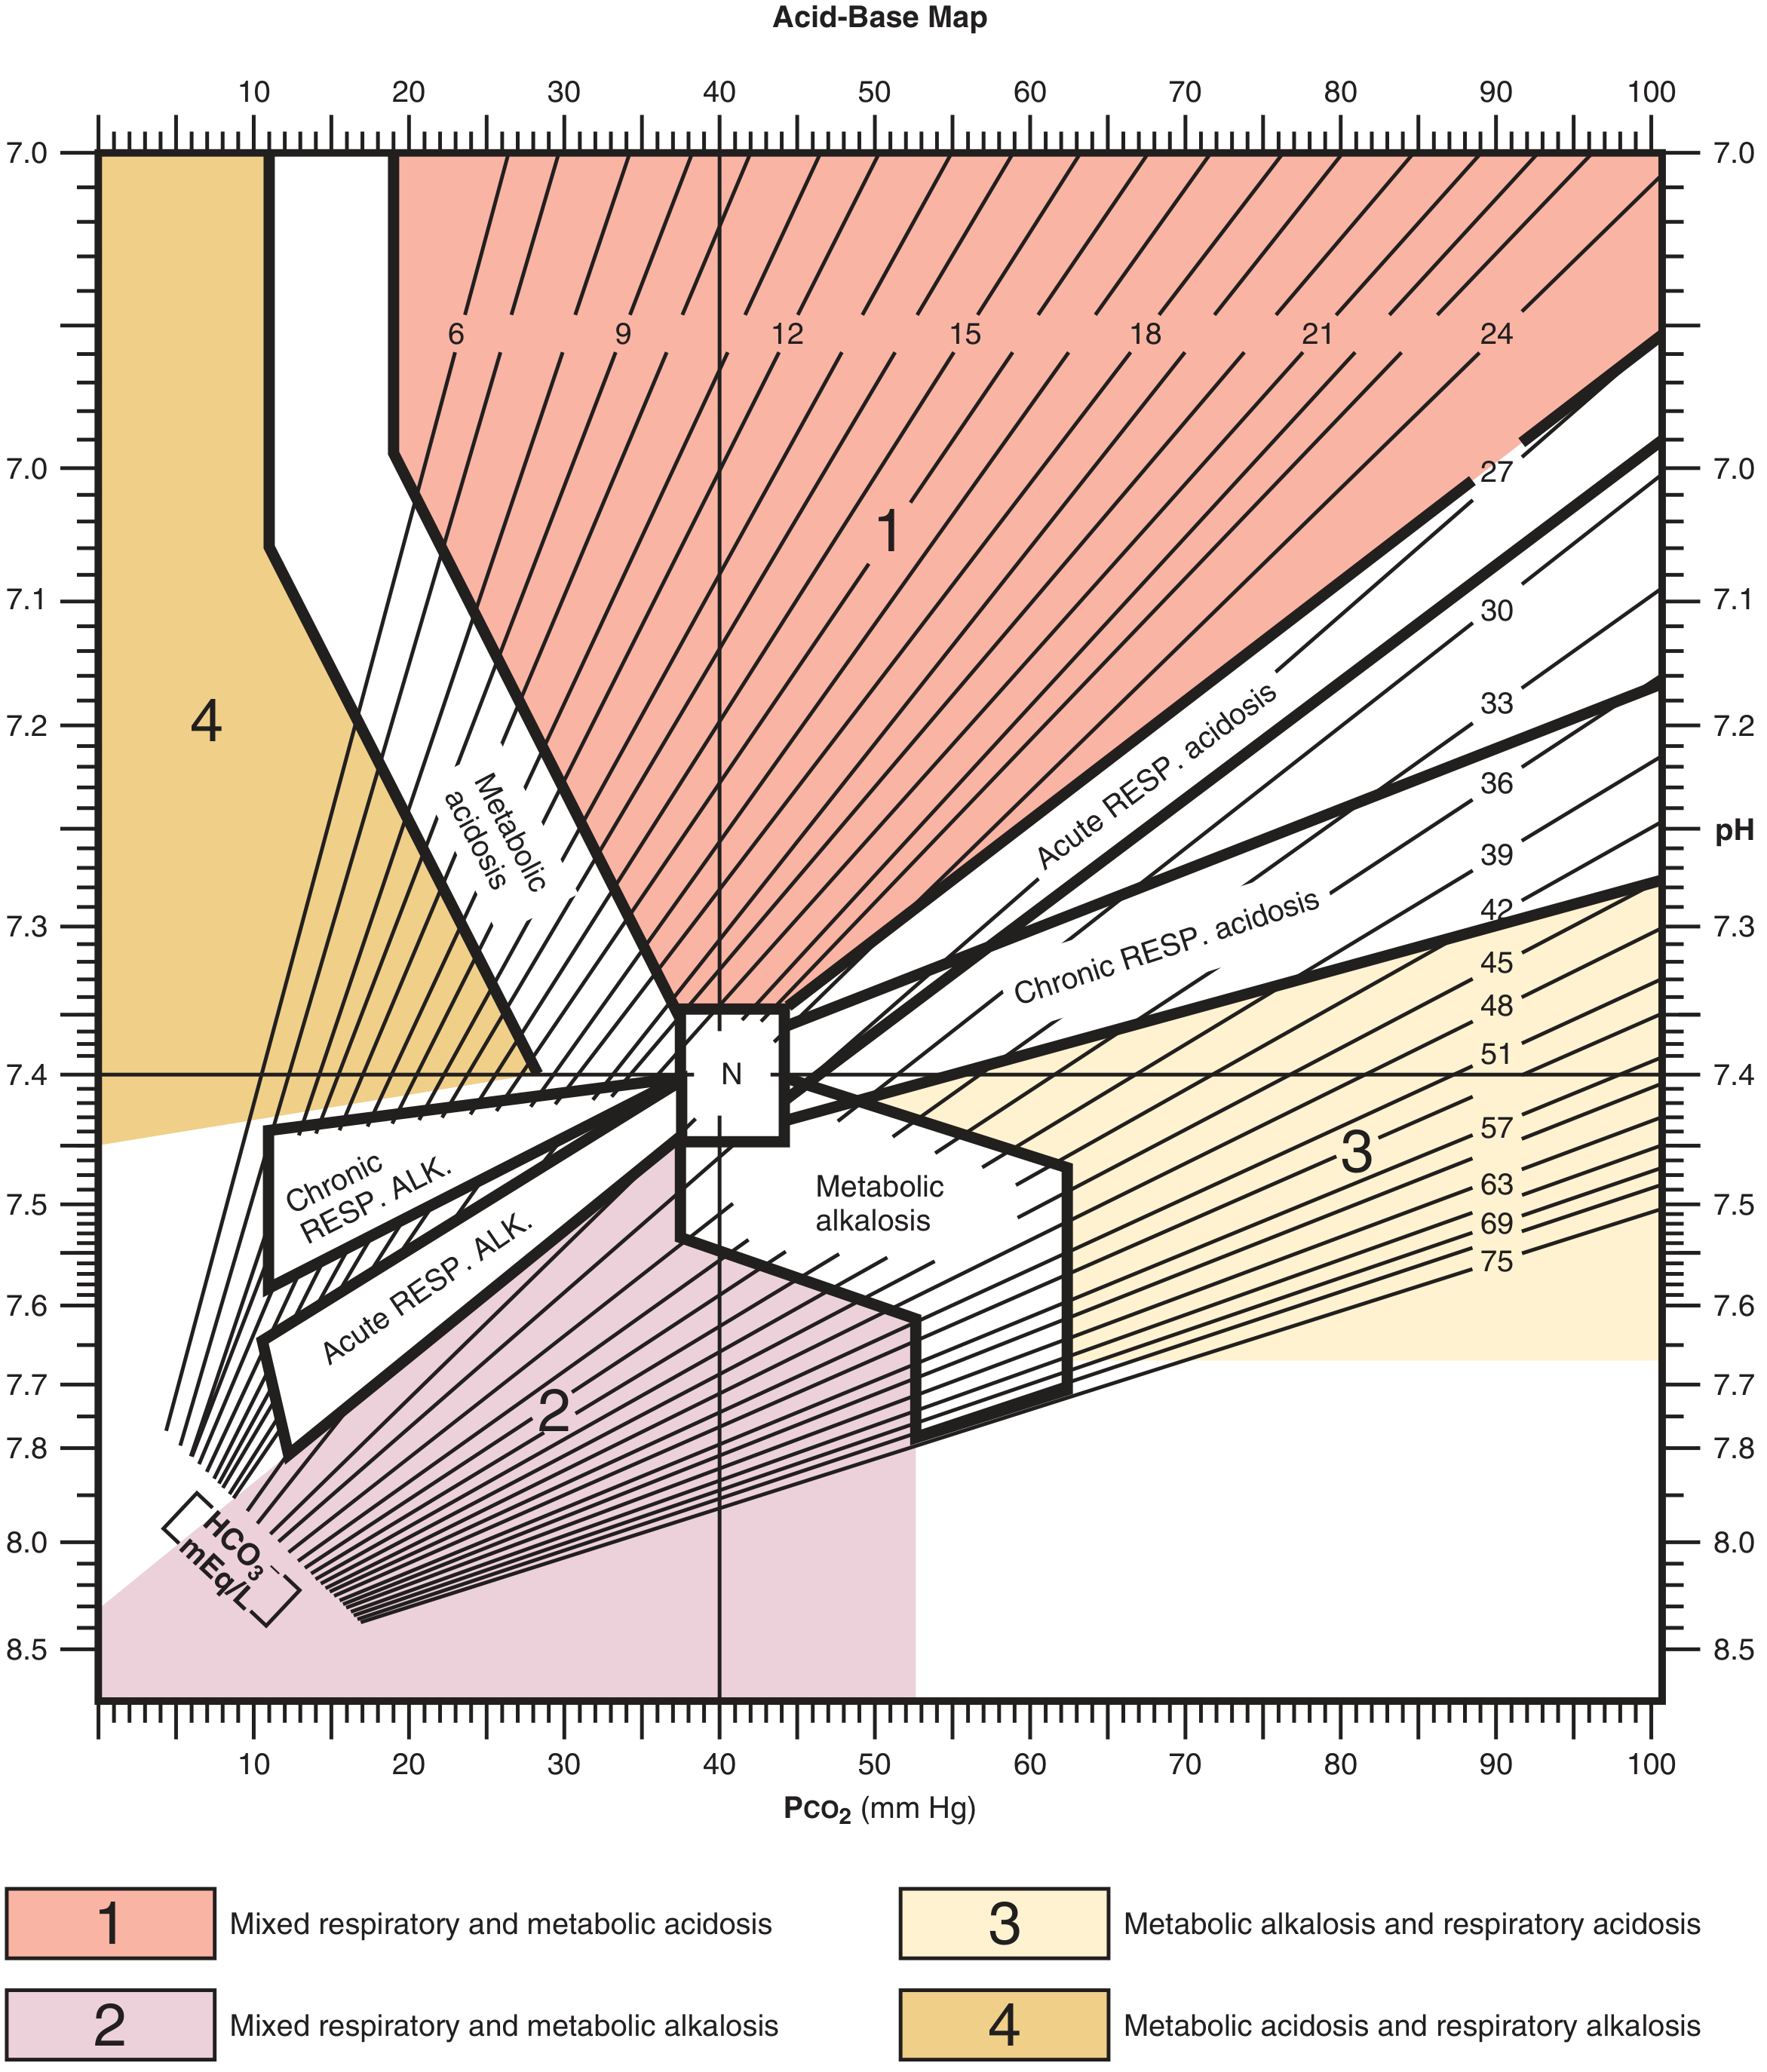
Roberts and Hedges' Clinical Procedures in Emergency Medicine, Figure A.1
The Four Primary Disorders
1. Respiratory Acidosis
- Cause: hypoventilation, COPD exacerbation, neuromuscular failure, opioid overdose
- ABG: pH ↓, PaCO2 ↑, HCO3- normal (acute) or ↑ (chronic)
- Acute: pH falls 0.08 per 10 mmHg rise in PCO2
- Chronic: kidneys compensate over 3-5 days by retaining HCO3-
2. Respiratory Alkalosis
- Cause: anxiety/hyperventilation, sepsis, PE, pregnancy, high altitude, pain
- ABG: pH ↑, PaCO2 ↓, HCO3- normal (acute) or ↓ (chronic)
- Example: The sepsis case above showed acute respiratory alkalosis with appropriate compensation (HCO3- drop of 3 from expected 3) - Roberts and Hedges', p. 4871
3. Metabolic Acidosis
- ABG: pH ↓, HCO3- ↓, PCO2 ↓ (compensation)
- Classified by anion gap:
Wide Anion Gap (MUDPILES):
- M - Methanol
- U - Uremia
- D - Diabetic/alcoholic ketoacidosis
- P - Paraldehyde/Polyethylene glycol/Paracetamol
- I - Iron
- L - Lactic acidosis (most common, ~50% of high-AG metabolic acidosis)
- E - Ethylene glycol
- S - Salicylates
Normal Anion Gap / Hyperchloremic (HARDUP):
- H - Hyperalimentation / Hospital saline administration
- A - Acid infusion / Addison's / Carbonic anhydrase inhibitors
- R - Renal tubular acidosis
- D - Diarrhea (GI bicarbonate loss)
- U - Ureteral diversion
- P - Pancreatic fistula
ROSEN's Emergency Medicine, p. 1647-1651
4. Metabolic Alkalosis
- Cause: vomiting, NG suctioning, diuretics, hyperaldosteronism
- ABG: pH ↑, HCO3- ↑, PCO2 ↑ (compensation)
- Divided into chloride-responsive (urine Cl- < 20) and chloride-unresponsive (urine Cl- > 20)
Winter's Formula (Quick Check for Metabolic Acidosis Compensation)
Expected PCO2 = (1.5 × HCO3-) + 8 ± 2
- If measured PCO2 > expected → additional respiratory acidosis (possible impending respiratory failure)
- If measured PCO2 < expected → additional respiratory alkalosis (e.g., salicylate toxicity)
- Useful mnemonic: expected pH last two digits ≈ PCO2 (e.g., PCO2 23 → pH ~7.23)
Roberts and Hedges' Clinical Procedures in Emergency Medicine, p. 4876-4891
ABG vs. Pulse Oximetry
| Feature | ABG | Pulse Oximetry |
|---|---|---|
| pH | Yes | No |
| PaCO2 | Yes | No |
| PaO2 | Yes | Indirect (via saturation curve) |
| SaO2 | Yes (directly) | Yes (SpO2) |
| Detects hypercarbia | Yes | No (especially on O2 therapy) |
| Detects CO/MetHb | Yes | No (falsely elevated SpO2) |
A critical point: pulse oximetry cannot detect hypoventilation in patients on supplemental oxygen, because the added O2 keeps SpO2 on the flat portion of the oxyhemoglobin dissociation curve even as PCO2 rises significantly. Capnography or ABG is required for these patients. - Murray & Nadel's Textbook of Respiratory Medicine, p. 956-957
Alveolar-Arterial (A-a) Gradient
A-a PO2 = PAO2 - PaO2
Where: PAO2 = FiO2 × (PB - 47) - (PaCO2 / 0.8)
- Normal A-a gradient on room air: ~10 mmHg (increases with age)
- A-a > 20 mmHg with hypercapnia → underlying lung disease contributing (e.g., COPD, PE, pneumonia)
- Normal A-a with hypercapnia → pure hypoventilation (e.g., CNS depression, neuromuscular disease)
Murray & Nadel's Textbook of Respiratory Medicine, p. 974
Worked Examples
Example 1 - Metabolic Acidosis with Compensation:
58-year-old with diarrhea: Na 133, K 2.8, Cl 118, pH 7.26, PCO2 13, HCO3- 5
- Acidosis present (pH 7.26)
- Primary: metabolic (HCO3- 5, low)
- Check compensation: ΔPCO2 = 1.3 × (25-5) = 26 → predicted PCO2 = 40-26 = 14 (actual = 13) → appropriate compensation only, no mixed disorder
Example 2 - Respiratory Alkalosis (Sepsis):
74-year-old, septic: pH 7.49, PCO2 25, HCO3- 22
- Alkalosis (pH 7.49)
- Primary: respiratory (PCO2 25, low)
- Expected ΔHCO3- for 15 mmHg drop in PCO2 = 3 mmol/L → predicted HCO3- = 25-3 = 22 (actual = 22) → pure acute respiratory alkalosis
Roberts and Hedges' Clinical Procedures in Emergency Medicine, p. 4824-4871
Difference between spo2 vs sao2
SpO2 is the peripheral oxygen saturation measured non-invasively by pulse oximetry, while SaO2 is the arterial oxygen saturation measured directly from an arterial blood gas sample. They measure the same thing (% of hemoglobin bound to oxygen) but by different methods, and they can diverge significantly in certain clinical situations.
Searching sources...
Finding Sources
Finding Sources
Reading File
Reading File
Reading File
Reading File
Reading File
Loading Image
Here is a detailed comparison drawn from multiple authoritative textbooks.
SpO2 vs SaO2
Quick Definitions
| SpO2 | SaO2 | |
|---|---|---|
| Full name | Peripheral oxygen saturation | Arterial oxygen saturation |
| Method | Pulse oximetry (non-invasive) | Co-oximetry on ABG (invasive) |
| What it measures | Functional saturation | Fractional saturation |
| Continuous? | Yes | No (point-in-time) |
| Requires blood draw? | No | Yes (arterial sample) |
The Key Mathematical Difference
This is the most important distinction - they use different formulas:
SpO2 (functional saturation) - what pulse oximetry measures:
SpO2 = HbO2 / (HbO2 + Hb) × 100%
It only considers oxyhemoglobin vs. deoxyhemoglobin - it ignores dyshemoglobins entirely.
SaO2 (fractional saturation) - what ABG co-oximetry measures:
SaO2 = HbO2 / (HbO2 + Hb + COHb + MetHb) × 100%
It accounts for ALL hemoglobin species, including dysfunctional forms. - Barash Clinical Anesthesia, 9e, p. 2100
How Pulse Oximetry Works (and Why It Can Be Wrong)
Pulse oximetry uses two wavelengths of light:
- 660 nm (red) - absorbed more by deoxyhemoglobin
- 940 nm (near-infrared) - absorbed more by oxyhemoglobin
It performs a plethysmographic analysis to isolate the pulsatile (arterial) signal from venous blood and tissue background. The ratio of absorbance at these two wavelengths determines SpO2. - Barash Clinical Anesthesia, 9e, p. 2099-2100
The problem: this 2-wavelength system cannot distinguish other hemoglobin species that absorb light at the same wavelengths.
The Oxyhemoglobin Dissociation Curve - Why Both Matter
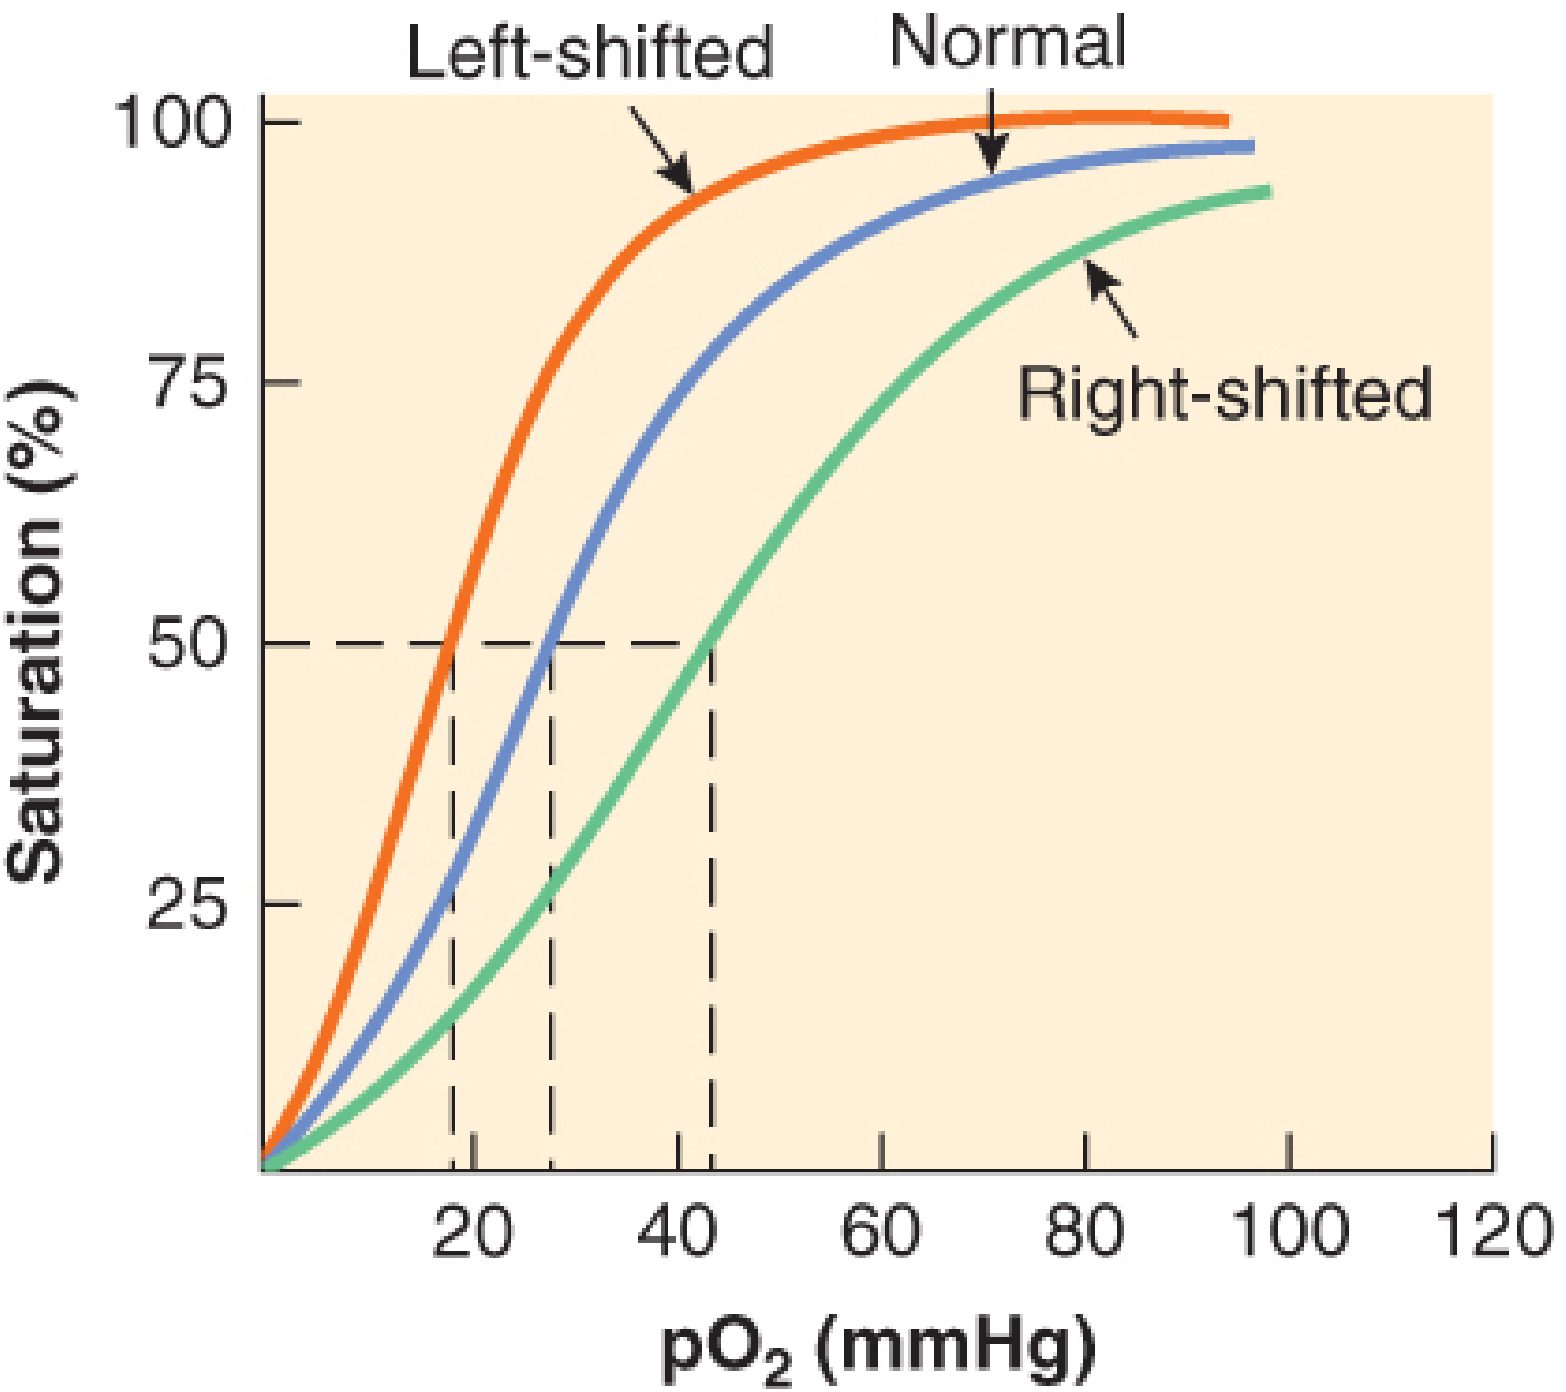
Barash Clinical Anesthesia, 9e - Oxyhemoglobin dissociation curve
SpO2 and SaO2 relate to PaO2 via this sigmoid curve. At PaO2 > 75 mmHg, both measurements plateau on the flat upper portion - meaning large drops in PaO2 can occur with minimal change in either saturation. This is why a normal SpO2 does not rule out significant hypoxemia. - Barash Clinical Anesthesia, 9e, p. 2099
When SpO2 and SaO2 Diverge
1. Dyshemoglobins (most clinically important)
| Condition | SpO2 reads | Actual SaO2 | Reason |
|---|---|---|---|
| Carbon monoxide poisoning (COHb) | Falsely HIGH (SpO2 ~90%+ even at 70% COHb) | Low | COHb absorbs at 660 nm like O2Hb - pulse ox mistakes it for oxyHb |
| Methemoglobinemia (MetHb) | Approaches 85% regardless of true SaO2 | Variable | MetHb absorbs 660/940 nm equally (R-ratio = 1 = 85%) |
| Sulfhemoglobin | SpO2 ~85% | Variable | Hb absorbs red light heavily |
- Miller's Anesthesia, 10e, p. 5464 and Barash, 9e, p. 2100
2. Accuracy at Low Saturations
When SaO2 > 90%: average SpO2 vs SaO2 difference is < 2% - clinically acceptable.
When SaO2 drops below 90%: the discrepancy increases, making SpO2 unreliable in severe hypoxemia. - Fishman's Pulmonary Diseases, p. 2596
3. Racial Disparity
SpO2 overestimates SaO2 in Black patients. In one study, occult hypoxemia (true SaO2 <88%) was three times more frequent in Black patients with an SpO2 reading of 92-96% compared with white patients. Skin pigmentation alters light absorption at the probe site. - Fishman's Pulmonary Diseases, p. 2596
4. Technical / Physiologic Errors in SpO2
| Source of Error | Effect on SpO2 vs SaO2 |
|---|---|
| Hypotension / poor perfusion | SpO2 ↓ (falsely low) |
| Motion artifact | SpO2 ↓ |
| Dark nail polish | SpO2 ↓ |
| Methemoglobin | SpO2 → 85% (either ↑ or ↓) |
| Carboxyhemoglobin | SpO2 falsely ↑ |
| Anemia | SpO2 ↓ |
| Polycythemia | No significant effect |
| Venous pulsations (e.g., TR, Trendelenburg) | SpO2 ↓ (venous O2 detected) |
| Excessive ambient light | Variable |
Miller's Anesthesia, 10e - Table 37.1, p. 5465
When to Use ABG (SaO2) Instead of Pulse Oximetry (SpO2)
Use ABG/co-oximetry for SaO2 when:
- Suspected CO poisoning (SpO2 will be falsely normal)
- Suspected methemoglobinemia (SpO2 locks near 85%)
- Critically ill patients where ±2% error is not acceptable
- Patient on supplemental oxygen with suspected hypoventilation (SpO2 cannot detect rising PaCO2)
- Suspected dyshemoglobinemia (e.g., sulfhemoglobin from dapsone/nitrates)
- Any situation where SpO2 and clinical picture do not match
Fishman's Pulmonary Diseases, p. 2597
Summary in One Line
SpO2 is a convenient continuous estimate; SaO2 from co-oximetry is the ground truth - they agree well in normal physiology, but diverge critically when dyshemoglobins are present, in severe hypoxemia, or in low-perfusion states. In CO poisoning especially, SpO2 can be dangerously misleading.
This is a shared conversation. Sign in to Orris to start your own chat.