
ECG A to Z Roadmap( note easy to understand basic to advanced clean and clear and each topic ecg pictures and vedio clarification) Phase 1 – Basic (Foundation) Anatomy & Conduction System SA Node AV Node Bundle of His Right & Left Bundle Branch Purkinje Fibers ECG Machine Basics Paper speed (25 mm/s) Calibration (10 mm = 1 mV) Small box, Large box Lead System Limb Leads (I, II, III) Augmented Leads (aVR, aVL, aVF) Chest Leads (V1–V6) Cardiac Axis Normal Left Axis Right Axis Extreme Axis Phase 2 – ECG Waves P Wave Normal Abnormal P pulmonale P mitrale PR Interval QRS Complex ST Segment T Wave QT Interval Phase 3 – Rhythm Analysis Heart Rate Calculation Rhythm Analysis Regular vs Irregular Rhythm Sinus Rhythm Sinus Arrhythmia Phase 4 – Arrhythmias Sinus Bradycardia Sinus Tachycardia PAC PVC SVT Atrial Flutter Atrial Fibrillation Junctional Rhythm VT VF Torsades de Pointes Asystole PEA Phase 5 – Blocks 1st Degree AV Block 2nd Degree Mobitz I 2nd Degree Mobitz II Complete Heart Block RBBB LBBB Phase 6 – Ischemia & MI STEMI NSTEMI Inferior MI Anterior MI Lateral MI Posterior MI Right Ventricular MI Phase 7 – Electrolyte Changes Hyperkalemia Hypokalemia Hypercalcemia Hypocalcemia Phase 8 – Advanced ECG Pacemaker ECG WPW Syndrome Brugada Syndrome Long QT Syndrome Pericarditis Pulmonary Embolism ECG COPD ECG LVH / RVH ECG Interpretation – 10-Step Method Patient details Calibration Heart rate Rhythm Axis P wave PR interval QRS complex ST segment T wave & QT interval
🫀 ECG A to Z ROADMAP
Complete Guide: Basic → Advanced
PHASE 1 – BASIC FOUNDATION
🔬 Anatomy & Conduction System
SA Node → AV Node → Bundle of His → Right & Left Bundle Branches → Purkinje Fibers
| Structure | Location | Function |
|---|---|---|
| SA Node | Right atrium, near SVC | Primary pacemaker, fires 60-100 bpm |
| AV Node | Junction of atria/ventricles | Delays signal 0.12-0.20s, gatekeeper |
| Bundle of His | Interventricular septum | Carries impulse to ventricles |
| Right Bundle Branch | Right ventricle | Depolarizes RV |
| Left Bundle Branch | Splits into anterior/posterior fascicles | Depolarizes LV |
| Purkinje Fibers | Ventricular walls | Rapid final conduction, 30-40 bpm backup |
cardiac conduction system SA node AV node bundle of His Purkinje fibers diagram
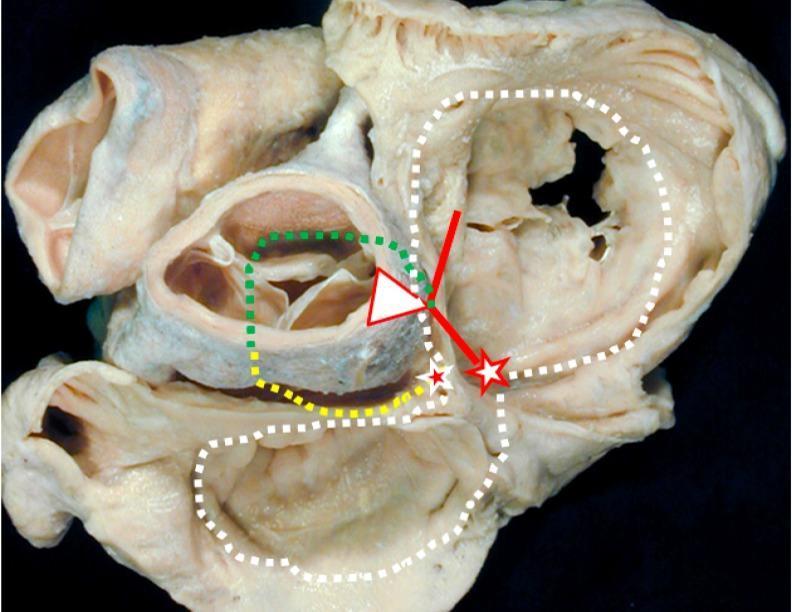
Anatomical Diagram over a clinical photograph of a gross cardiac specimen, viewed from the atrial aspect (superior view) of the cardiac base. The image illustrates the complex anatomy of the cardiac conduction system and vestigial embryonic structures. Key landmarks include the atrioventricular (AV) node (white star with red borders) and the retroaortic node (red star with white borders). The conduction pathway is delineated by a solid red line representing the bundle of His. Supplemental embryonic and auxiliary tracts are marked with dotted lines: a green dotted line shows the 'dead-end tract' continuing from the AV conduction axis toward the outflow tract; a yellow dotted line marks the retro-aortic ring branch; and a white dotted line traces the path of the embryonic atrioventricular ring. This visual is designed for advanced medical education in cardiac electrophysiology and embryology, highlighting the anatomical basis for idiopathic ventricular arrhythmias and the clinical significance of persistent embryonic tissues within the heart's conduction framework.
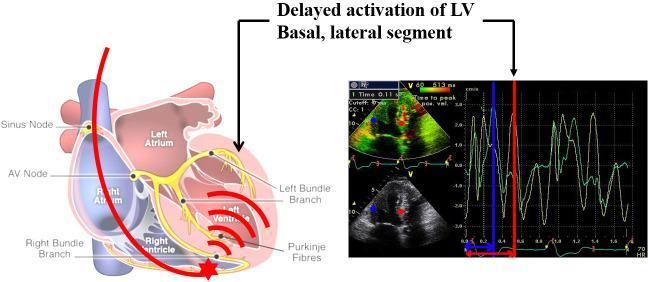
This composite medical illustration demonstrates the pathophysiology of right ventricular (RV) pacing-induced left ventricular (LV) dyssynchrony. The left side features a schematic anatomical diagram of the heart showing the cardiac conduction system (Sinus node, AV node, Bundle branches, and Purkinje fibers). A red line represents a pacing lead traversing the right atrium to the RV apex (marked by a red star). Red wavefront arcs illustrate electrical activation spreading from the RV pacing site to the LV, highlighting the late activation of the LV lateral wall. The right side contains diagnostic images, including a color tissue Doppler echocardiogram and a corresponding velocity-time tracing. The Doppler tracing shows two distinct myocardial velocity curves (green) with vertical blue and red marker lines indicating the significant temporal delay between segmental contractions. A label and arrows point to both the LV basal lateral segment on the diagram and the delayed peak on the Doppler tracing, identifying the mechanical dyssynchrony resulting from the non-physiological electrical sequence of RV apical pacing.
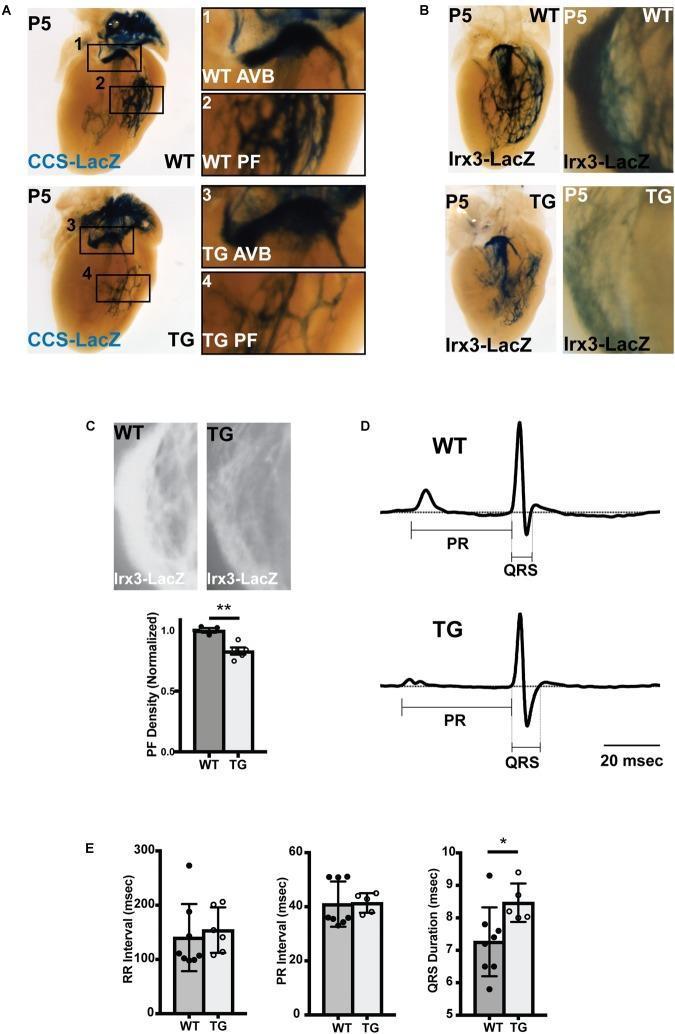
Educational medical graphic illustrating abnormal ventricular conduction system (VCS) structure and electrophysiology in a mouse model of miR-1 overexpression. Panel A shows whole-mount P5 neonatal hearts with CCS-LacZ reporter activity; magnified views compare wild-type (WT) and transgenic (TG) atrioventricular bundles (AVB) and Purkinje fibers (PF), revealing significantly reduced PF branching in TG hearts. Panel B utilizes Irx3-LacZ staining to further demonstrate diminished PF density in the left bundle branch and right ventricle of TG mice. Panel C provides quantification, with a bar graph showing a statistically significant decrease in normalized PF density (p < 0.01). Panel D displays averaged lead aVF ECG tracings, highlighting a prolonged QRS duration in TG mice compared to WT. Panel E includes bar graphs of cardiac intervals (RR, PR, and QRS), confirming that while heart rate and AV node conduction are unchanged, VCS conduction is significantly slowed, as evidenced by increased QRS duration (p < 0.05). This composite figure demonstrates that premature miR-1 upregulation leads to Purkinje fiber hypoplasia and conduction dysfunction.
ECG paper speed calibration small large box measurement
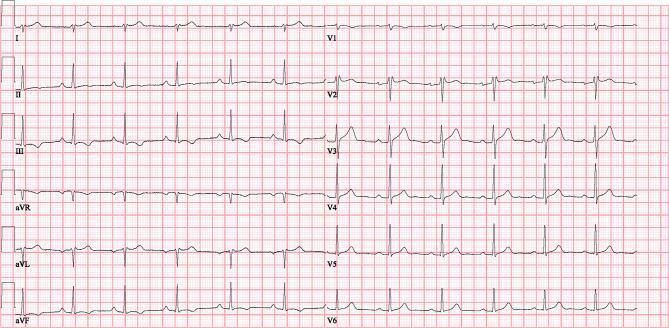
A standard 12-lead electrocardiogram (ECG) recorded at a paper speed of 25 mm/s and voltage calibration of 10 mm/mV. The tracing is displayed on a standard red grid comprising small (1 mm) and large (5 mm) squares. The ECG shows the limb leads (I, II, III) and augmented limb leads (aVR, aVL, aVF) on the left, and precordial chest leads (V1 through V6) on the right. The rhythm appears to be a normal sinus rhythm with regular P-waves preceding each QRS complex. The QRS complexes exhibit normal morphology and duration across all leads, with appropriate R-wave progression from V1 to V6. T-waves are concordant with the QRS complexes and appear stable. This diagnostic image represents a follow-up recording demonstrating the resolution of previous conduction disturbances, used in a clinical context for monitoring cardiac recovery and post-treatment stabilization.
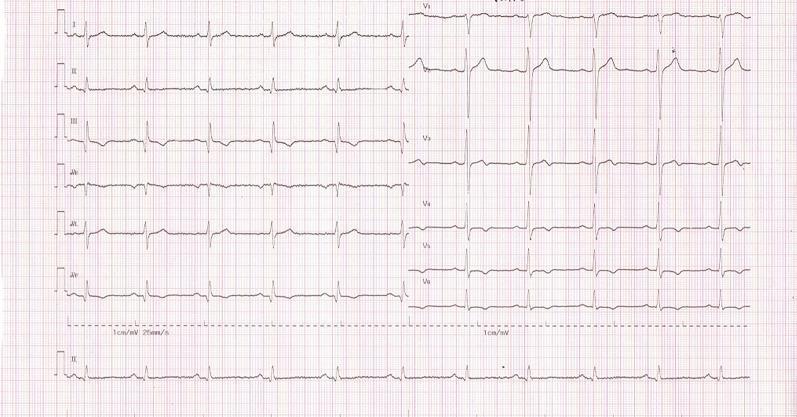
A standard 12-lead electrocardiogram (ECG) recording displayed on pink-grid thermal paper. The layout is organized into two main columns: the left column contains limb leads I, II, III, aVR, aVL, and aVF, while the right column contains precordial leads V1 through V6. A rhythm strip (lead II) is positioned along the bottom. The grid features standard 1 mm small squares and 5 mm large squares for amplitude and time measurement. Calibration markers are visible at the start of each row, with scaling indicated at 1 cm/mV and 25 mm/s. The recording illustrates a normal sinus rhythm with clearly visible P waves, QRS complexes, and T waves. Typical R-wave progression is observed across the precordial leads (V1-V6). Minor baseline fluctuations and electrical artifacts are present, particularly in leads II and III. This diagnostic image serves as a fundamental clinical tool for assessing cardiac rhythm, rate, and conduction abnormalities in cardiology education.
ECG interpretation complete guide YouTube playlist basic to advanced 2024
12 lead ECG placement limb leads chest leads V1-V6 diagram
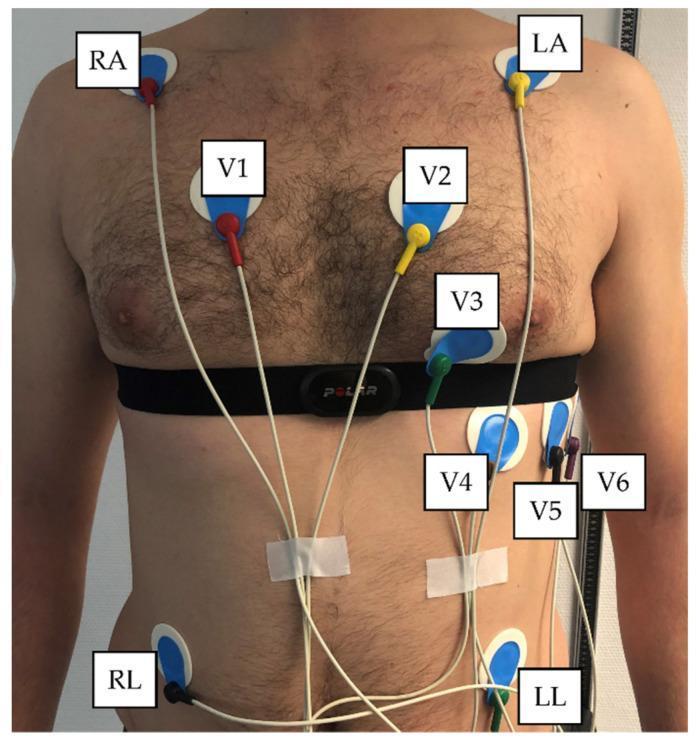
This procedural clinical photograph demonstrates the concurrent placement of a standard 12-lead electrocardiogram (ECG) and a Polar H10 heart rate sensor chest strap on a male subject. The image illustrates proper anatomical positioning for clinical and exercise physiology monitoring. The six precordial leads (V1-V6) are visible across the chest: V1 (4th intercostal space, right sternal border), V2 (4th intercostal space, left sternal border), V3 (midway between V2 and V4), V4 (5th intercostal space, mid-clavicular line), V5 (anterior axillary line), and V6 (mid-axillary line). The leads utilize standard color-coding (Red, Yellow, Green, Brown, Black, Violet). Limb leads are positioned at the shoulders (RA/LA) and the lower ribcage/abdominal area (RL/LL) to facilitate movement during testing. The Polar H10 chest strap is situated inferior to the pectoral muscles, intersecting the mid-precordial electrode line. This visual serves as an educational reference for electrode application in comparative heart rate variability (HRV) studies, highlighting the spatial relationship between traditional medical grade ECG sensors and wearable consumer fitness technology.
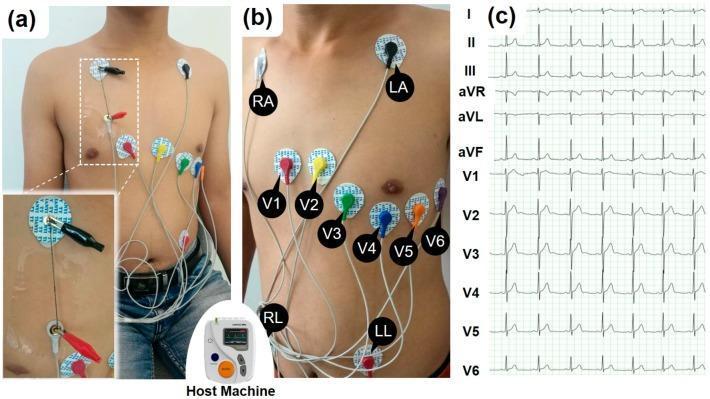
This composite educational graphic illustrates the procedural setup and resulting data for a standard 12-lead electrocardiogram (ECG/EKG). Panels (a) and (b) are clinical photographs demonstrating correct electrode placement on a male torso. The limb leads are positioned as RA (right arm/shoulder) and LA (left arm/shoulder) on the upper chest, with RL (right leg) and LL (left leg) on the lower abdomen. The precordial leads (V1-V6) follow the standard anatomical arc across the chest: V1 and V2 at the fourth intercostal space (right and left of the sternum), V4 at the fifth intercostal space (mid-clavicular line), and V3, V5, and V6 completing the transverse sequence toward the left axilla. Panel (a) includes an inset showing the experimental use of conductive carbon nanotube yarns (SWNT-CYs) connected via alligator clips to the electrodes. Panel (c) displays the resulting 12-lead ECG waveforms on a standard grid, labeled I, II, III, aVR, aVL, aVF, and V1-V6. Each lead shows distinct P-waves, QRS complexes, and T-waves, representing different electrical vectors of cardiac depolarization and repolarization.
ECG cardiac axis normal left right extreme deviation hexaxial
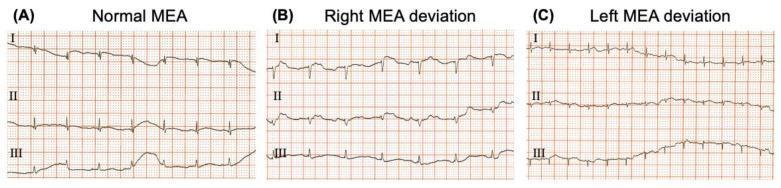
This diagnostic image displays a three-panel comparison of electrocardiogram (ECG) tracings illustrating Mean Electrical Axis (MEA) deviations in a small mammal model (O. degus). Each panel (A, B, C) presents standard bipolar leads I, II, and III on a red-grid background with a calibration of 50 mm/s and 20 mm/mV. (A) Normal MEA: Shows predominantly positive QRS complexes across leads I, II, and III, indicating a balanced electrical vector. (B) Right MEA Deviation: Characterized by a predominantly negative or smaller amplitude QRS deflection in lead I and a prominent positive deflection in lead III, signifying a rightward shift. (C) Left MEA Deviation: Demonstrates a strongly positive QRS deflection in lead I paired with a negative or small amplitude deflection in lead III, indicating a leftward shift. The tracings provide a visual reference for vector analysis and the diagnosis of cardiac axis shifts, highlighting morphology changes in the QRS complex, P waves, and T waves relevant to veterinary and comparative cardiology.
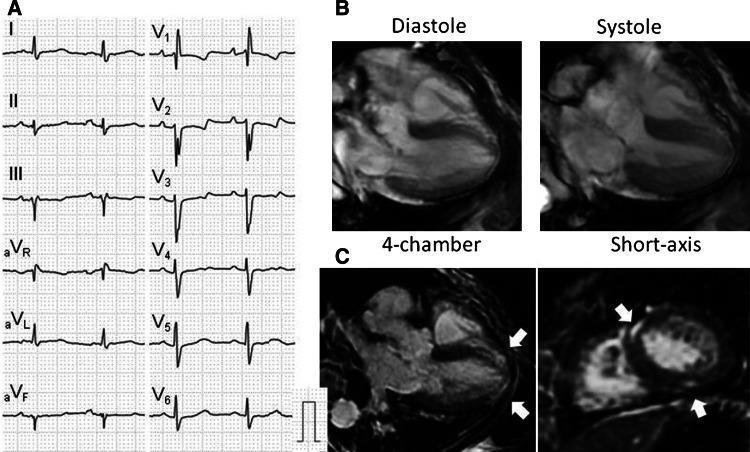
This composite educational image illustrates cardiac diagnostic findings in a 67-year-old female with systemic sclerosis (SSc). Panel (a) presents a 12-lead electrocardiogram (ECG) demonstrating a complete right bundle branch block (RBBB) and left axis deviation. Panel (b) shows Cine-Cardiac Magnetic Resonance (Cine-CMR) frames in the 4-chamber view during diastole and systole, exhibiting normal left ventricular (LV) volume and preserved global systolic function. Panel (c) features Late Gadolinium Enhancement CMR (LGE-CMR) in 4-chamber and short-axis views. White arrows highlight areas of pathological hyperenhancement, indicating myocardial fibrosis. The enhancement displays both striated and patchy patterns localized within the mid-myocardium, specifically at the anterior right ventricular (RV) insertion point and the inferior LV wall. This case highlights the role of multi-modal cardiac imaging in detecting subclinical myocardial involvement and replacement fibrosis in connective tissue diseases like SSc, even when ventricular function appears normal on cine imaging.
P wave QRS complex ST segment T wave QT interval normal ECG labeled diagram
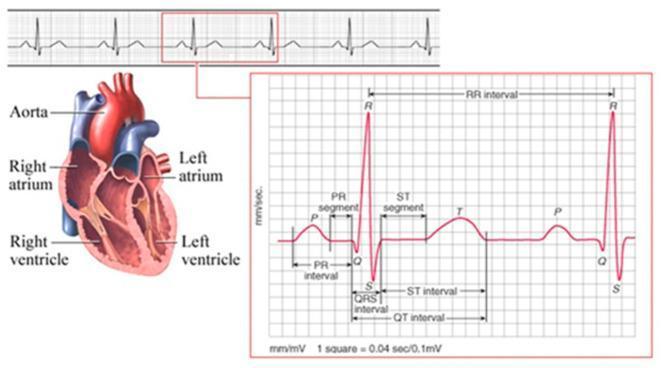
This composite educational illustration combines an anatomical diagram of the human heart with a diagnostic Electrocardiogram (ECG) tracing to demonstrate cardiac physiology. On the left, a coronal cross-section of the heart identifies the Aorta, Right Atrium, Left Atrium, Right Ventricle, and Left Ventricle. The right side features a detailed ECG waveform analysis set against a standard measurement grid (1 square = 0.04 sec / 0.1 mV). The tracing identifies key electrophysiological components: the P wave (atrial depolarization), QRS complex (ventricular depolarization), and T wave (ventricular repolarization). Critical diagnostic intervals and segments are explicitly labeled, including the PR interval, PR segment, QRS interval, ST segment, ST interval, QT interval, and the RR interval (representing the heart rate). This comparison chart and pathophysiology diagram serve as an introductory resource for understanding the correlation between cardiac anatomy and the electrical signals recorded during a cardiac cycle, suitable for basic to intermediate medical education.
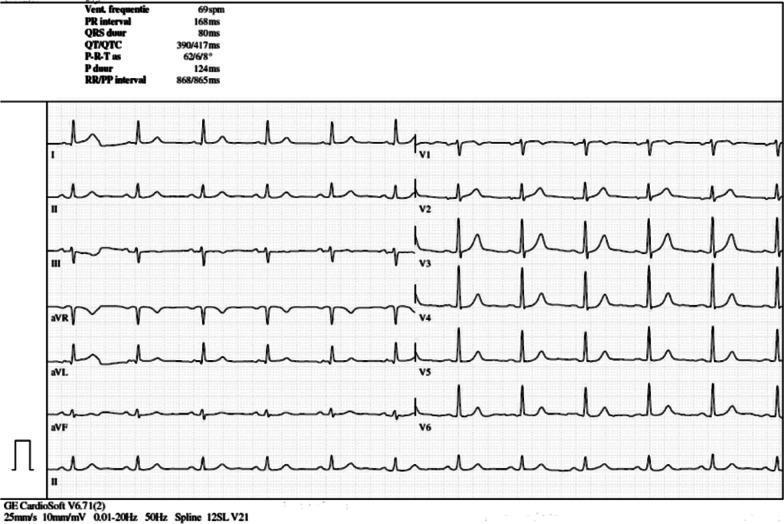
A 12-lead electrocardiogram (ECG) printed on standard grid paper (25 mm/s, 10 mm/mV). The tracing demonstrates a normal sinus rhythm at a ventricular rate of 69 bpm. P waves are present before every QRS complex with a PR interval of 168 ms. The QRS complexes are narrow (80 ms) with a normal axis. In the limb leads (I, II, III, aVR, aVL, aVF), the waveforms show consistent morphology and appropriate polarity. The precordial leads (V1-V6) show expected R-wave progression, with V4-V6 demonstrating prominent R-wave amplitudes. T waves are concordant with the QRS complexes in most leads, though minor T-wave inversion is visible in V1 and V2. Automated measurements provided at the top of the tracing include: Heart rate 69 bpm, PR interval 168 ms, QRS duration 80 ms, QT/QTc 390/417 ms, and P duration 124 ms. This ECG serves as a baseline 'reassuring' study for a patient undergoing immunotherapy, showing no acute ST-segment changes or arrhythmias.
atrial fibrillation flutter ECG VT ventricular tachycardia arrhythmia
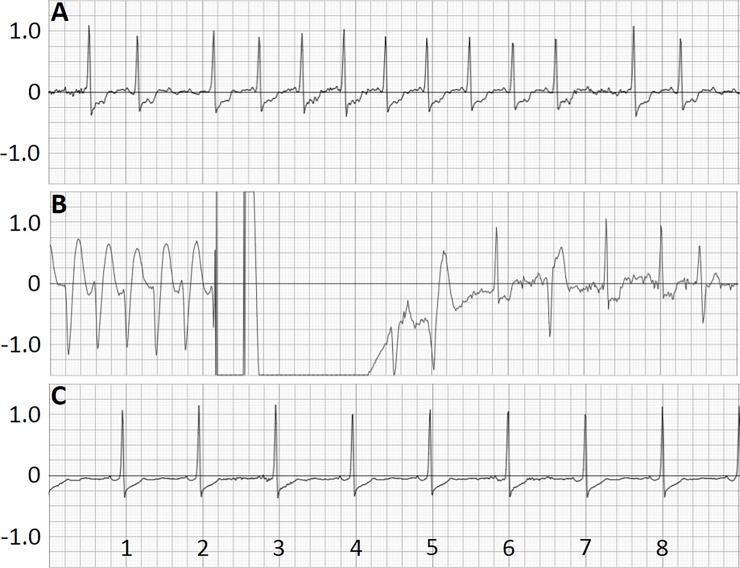
This diagnostic image displays a three-panel electrocardiogram (ECG) recording from a wearable cardioverter-defibrillator (WCD), capturing a critical cardiac event and its resolution. Panel A illustrates atrial fibrillation characterized by an irregularly irregular rhythm, absent P-waves, and significant ST-segment depression recorded four days prior to the event. Panel B shows a sequence of sustained ventricular tachycardia (VT) featuring wide, rapid QRS complexes, followed by a high-amplitude 150J shock artifact. Post-shock, there is a transient period of electrical inactivity (asystole/suppression) leading into the restoration of a more organized rhythm with visible ventricular ectopic beats. Panel C demonstrates the long-term follow-up seven days post-shock, showing a return to a stable sinus rhythm, though persistent ST-segment depression remains visible. The grids are scaled at 25 mm/s (x-axis) and 1 mV/20 mm (y-axis), providing a temporal and voltage-based progression of life-threatening arrhythmia management and successful defibrillation.
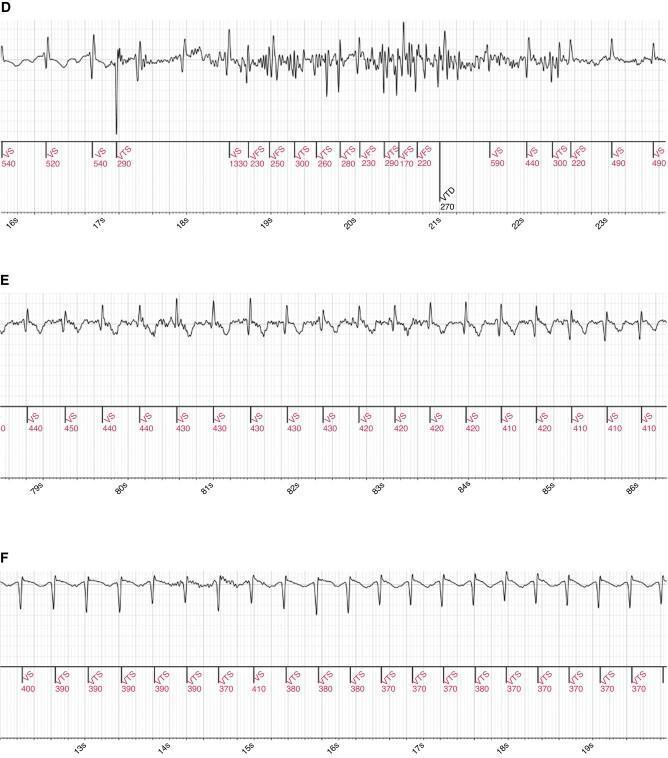
This diagnostic image displays three electrocardiogram (ECG) strips, labeled D, E, and F, recorded from an Insertable Cardiac Monitor (ICM). The visuals represent real-world clinical data used to evaluate arrhythmia detection algorithms. Panel D illustrates a transition from a baseline rhythm with identifiable QRS complexes and T waves into a high-frequency, high-amplitude chaotic segment that mimics ventricular tachycardia (VT) but is adjudicated as normal rhythm with baseline noise/artifact. Panel E shows a regular rhythm with consistent intervals and visible P waves, representing an episode misclassified by automated systems as VT but adjudicated as Atrial Tachycardia/Atrial Fibrillation (AT/AF). Panel F presents a uniform, lower-amplitude waveform with regular intervals, demonstrating how subtle rhythm variations are categorized by different diagnostic criteria. Each strip includes technical annotations below the waveform indicating interval measurements in milliseconds and event markers (e.g., VS, FS, TS, VTD) used by the monitor's classification logic. The primary educational focus is the differentiation between true cardiac arrhythmias and signal noise or baseline artifact in ambulatory monitoring devices.
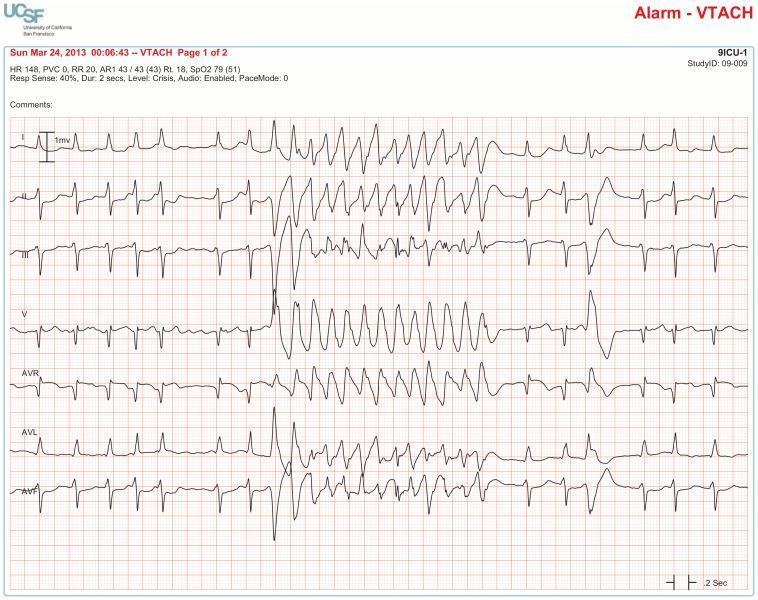
This diagnostic image displays a 10-second multi-lead electrocardiogram (ECG) rhythm strip illustrating a true positive ventricular tachycardia (VT) alarm. Seven leads are shown in sequence: I, II, III, V, aVR, aVL, and aVF. The initial segment of the tracing demonstrates an underlying rhythm of atrial fibrillation characterized by irregularly irregular R-R intervals and a rapid ventricular rate (approximately 140 bpm). An isolated ventricular premature contraction (VPC) is visible midway through the strip. This VPC exhibits a morphology identical to the subsequent run of wide-complex tachycardia, which confirms the diagnosis of ventricular tachycardia. During the VT episode, the QRS complexes become significantly widened and aberrant, occurring at a rapid, regular rate before spontaneously terminating and returning to the underlying atrial fibrillation. This tracing is a critical educational example used to distinguish true ventricular arrhythmias from artifact by correlating ectopic beat morphology with the onset of the tachycardia across multiple simultaneous leads.
STEMI inferior anterior lateral MI ST elevation ECG
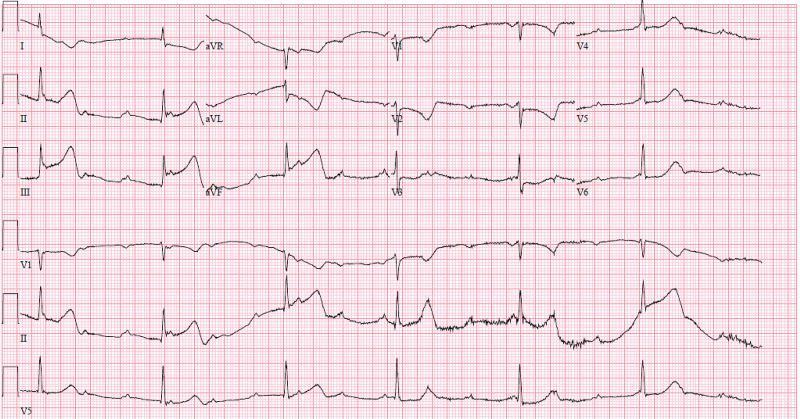
A standard 12-lead electrocardiogram (ECG) with rhythm strips (V1, II, V5) showing an acute inferior ST-elevation myocardial infarction (STEMI) complicated by high-grade atrioventricular (AV) block. Significant ST-segment elevation is present in the inferior leads (II, III, and aVF), with the magnitude of elevation in lead III exceeding that in lead II, suggesting a right coronary artery (RCA) occlusion. Reciprocal ST-segment depression and T-wave inversion are visible in the high lateral leads (I, aVL) and anterior lead V2. The rhythm analysis reveals complete heart block (third-degree AV block) characterized by atrioventricular dissociation, with an atrial rate significantly faster than the ventricular escape rate (approximately 37 bpm). The QRS complexes are wide, and P waves do not maintain a fixed relationship with the ventricular activity. This visual findings are pathognomonic for an inferior wall MI with ischemia to the AV node, commonly associated with a proximal RCA lesion.
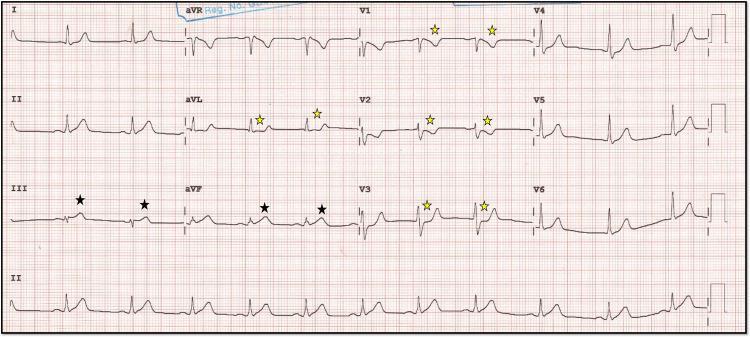
A 12-lead electrocardiogram (ECG) demonstrating signs of an acute inferior wall myocardial infarction (MI). The tracing reveals subtle ST-segment elevation and hyperacute T waves in the inferior leads (III and aVF), marked with black stars. Notably, the T-wave amplitude in lead III is disproportionately large compared to the preceding R-wave. Reciprocal changes are evident as ST-segment depression in the high lateral lead (aVL) and anterior precordial leads (V1, V2, and V3), indicated by yellow stars. Lead V2 also shows T-wave inversion. These findings are clinically significant for identifying early ischemic changes or transmural myocardial injury in the territory typically supplied by the right coronary artery (RCA). The ECG features a standard layout on grid paper with a rhythm strip at the bottom, suitable for medical education on ECG interpretation and ST-elevation myocardial infarction (STEMI) patterns.
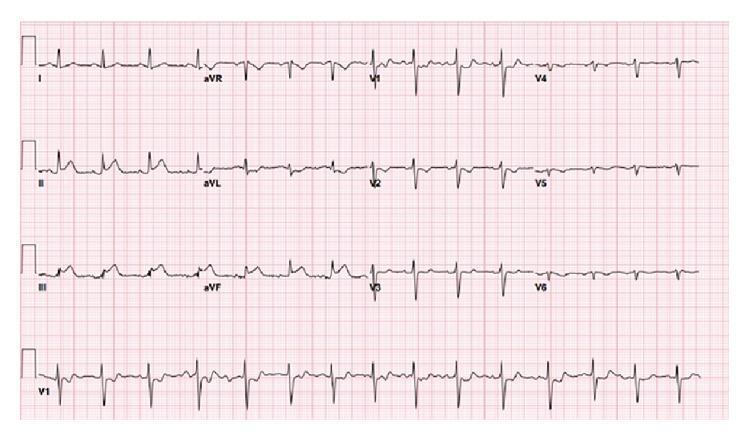
This diagnostic image is a 12-lead electrocardiogram (ECG) demonstrating an acute inferior ST-elevation myocardial infarction (STEMI). The tracing reveals significant convex ST-segment elevation in the inferior leads (II, III, and aVF), characteristic of an injury pattern often involving the right coronary artery or left circumflex artery. Accompanying these findings are prominent reciprocal ST-segment depressions in the anterior precordial leads (V1 through V6) and high lateral lead aVL. The rhythm appears to be a normal sinus rhythm with a regular rate. No significant ST-segment deviations are noted in leads I and aVR. This ECG serves as a classic educational example of an inferior STEMI with reciprocal changes, illustrating the electrical changes associated with acute transmural myocardial ischemia in the inferior wall of the heart.
ECG arrhythmias blocks WPW Brugada Torsades YouTube educational videos playlist
AV block first degree second degree third degree complete heart block ECG
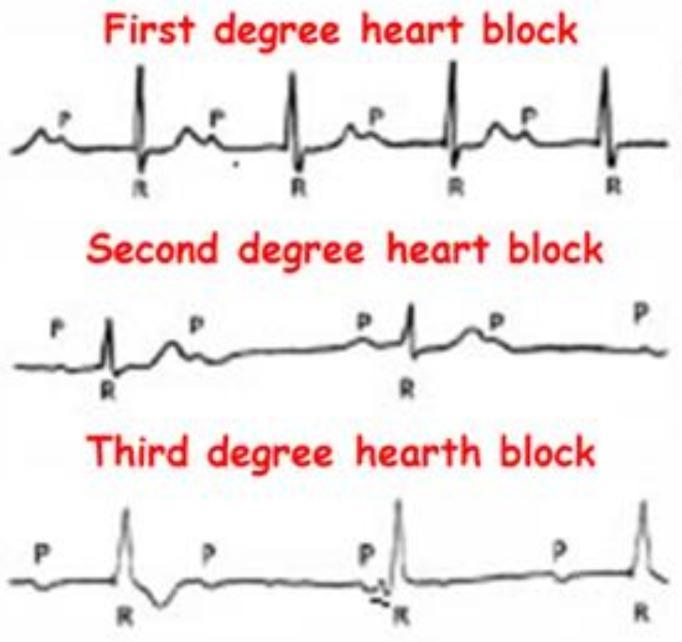
This Comparison Chart illustrates the electrocardiographic (ECG) characteristics of Atrioventricular (AV) blocks. It features three stacked rhythm strips categorized as First, Second, and Third-degree heart blocks, emphasizing the relationship between P waves (atrial depolarization) and QRS complexes (ventricular depolarization). The 'First degree heart block' panel demonstrates a consistent 1:1 P-to-QRS ratio with a fixed, prolonged PR interval. The 'Second degree heart block' panel shows intermittent conduction failure, where specific P waves are not followed by a QRS complex. The 'Third degree heart block' panel depicts complete AV dissociation, where P waves and QRS complexes occur independently and at different rates, indicating a total interruption of impulse transmission and the presence of a ventricular escape rhythm. This diagnostic illustration is designed for cardiovascular education to help students and clinicians distinguish between different stages of cardiac conduction system disease and their associated clinical significance.
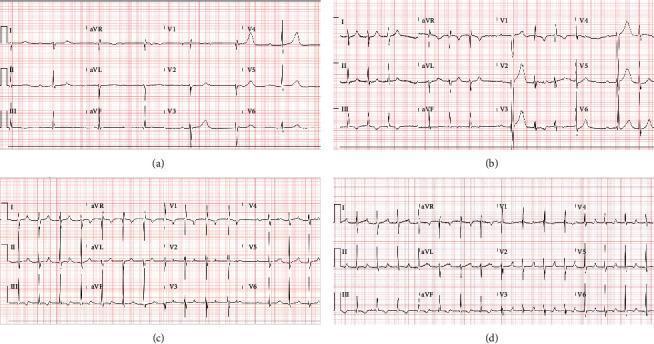
A comparison of four 12-lead electrocardiogram (ECG) tracings illustrating the progression and types of atrioventricular (AV) conduction blocks. (a) Complete heart block (third-degree AV block) demonstrating atrioventricular dissociation with a slow, regular ventricular escape rhythm of 41 bpm and independent atrial activity. (b) Second-degree type 2 AV block (Mobitz II) showing intermittent non-conducted P waves with a constant PR interval in conducted beats. (c) Second-degree Mobitz type 1 AV block (Wenckebach) characterized by progressive lengthening of the PR interval until a QRS complex is dropped. (d) First-degree AV block displaying a 1:1 P-to-QRS ratio with a fixed, prolonged PR interval exceeding 200 ms (specifically >250 ms). The clinical series documents the evolution of conduction system abnormalities in a patient with myocarditis, showing transitions between high-grade blocks and milder conduction delays during treatment with isoproterenol and anti-inflammatory therapies.
hyperkalemia hypokalemia ECG changes electrolyte QT prolongation
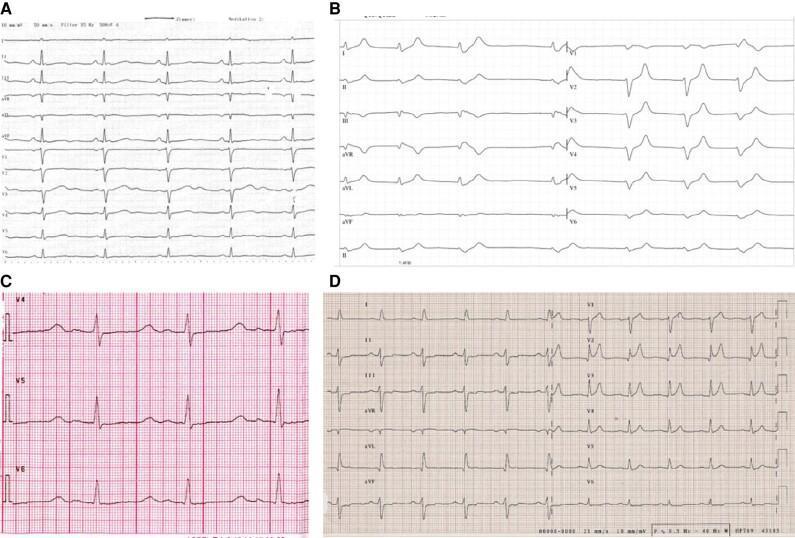
This diagnostic graphic illustrates various electrocardiogram (ECG) manifestations of electrolyte disturbances across four panels. Panel A demonstrates hypokalemia, characterized by flattened T waves and prominent U waves, which can lead to a pseudoprolonged QT interval. Panel B shows hyperkalemia, highlighted by classic tall, peaked 'tented' T waves and narrow QRS complexes. Panel C displays hypocalcemia, primarily showing a prolongation of the ST segment leading to a lengthened QT interval while T wave morphology remains relatively preserved. Panel D represents hypercalcemia, which is characterized by a shortened ST segment and a correspondingly shortened QT interval. The collection serves as an educational comparison chart for clinicians and medical students to recognize pathognomonic rhythm strip changes associated with potassium and calcium imbalances. Key educational concepts include repolarization abnormalities, interval duration changes, and the visual differentiation of metabolic derangements in a clinical cardiology context.
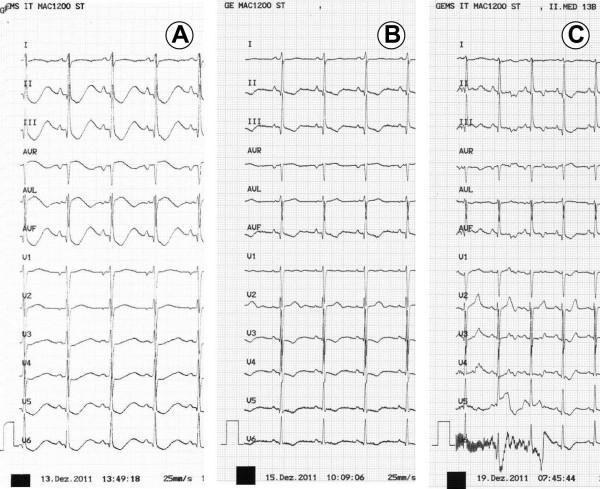
A comparison of three sequential 12-lead electrocardiogram (ECG) recordings (A, B, and C) illustrating the progression and resolution of electrolyte-induced cardiac abnormalities. ECG A (Day 1) demonstrates severe abnormalities characteristic of profound hypokalemia, including significant QT interval prolongation (QTc 670 msec), ST-segment depressions in lateral leads, and prominent U-waves merging with T-waves, creating a 'T-U fusion' appearance. ECG B (Day 3) shows partial normalization following electrolyte substitution, with a reduction in QTc to 405 msec and lessening of ST-T wave morphology distortions. ECG C (Day 7) depicts complete resolution, with the ST segments returning to the isoelectric line, normal T-wave morphology, and a stable QTc of 401 msec. The series serves as a clinical illustration of how severe metabolic derangements, such as furosemide-induced hypokalemia, manifest as reversible electrical conduction defects. The image is optimized for teaching cardiac manifestations of electrolyte imbalances and the diagnostic value of serial ECG monitoring in acute care settings.
WPW syndrome long QT pacemaker RBBB LBBB ECG YouTube Ninja Nerd Osmosis
🫀 ECG A to Z ROADMAP
Complete Learning Guide: Basic → Advanced
═══════════════════════════════
PHASE 1 – BASIC FOUNDATION
═══════════════════════════════
📌 ANATOMY & CONDUCTION SYSTEM
⚡ The Electrical Pathway
SA Node (60-100 bpm)
    ↓
Internodal Pathways → Atrial muscle depolarization (P wave)
    ↓
AV Node (delay 0.12-0.20s)
    ↓
Bundle of His
    ↓        ↓
 Right BB   Left BB (ant. + post. fascicles)
    ↓              ↓
Purkinje Fibers → Ventricular depolarization (QRS)
| Structure | Intrinsic Rate | Clinical Note |
|---|---|---|
| SA Node | 60-100 bpm | Primary pacemaker |
| AV Node | 40-60 bpm | Delays impulse; vulnerable in inferior MI |
| Bundle of His | 40-60 bpm | Transfers atrial → ventricular signal |
| Right Bundle Branch | - | Depolarizes RV; block = RBBB |
| Left Bundle Branch | - | Anterior + posterior fascicles |
| Purkinje Fibers | 20-40 bpm | Fastest conduction velocity in heart |
📌 ECG MACHINE BASICS
📐 ECG Grid: The Ruler of the Heart
┌──────────────────────────────────────┐
│  HORIZONTAL (Time)                   │
│  Small box = 1 mm = 0.04 sec        │
│  Large box = 5 mm = 0.20 sec        │
│                                      │
│  VERTICAL (Voltage)                  │
│  Small box = 1 mm = 0.1 mV          │
│  Large box = 5 mm = 0.5 mV          │
│  10 mm = 1 mV (standard calibration)│
│                                      │
│  Paper speed = 25 mm/sec            │
└──────────────────────────────────────┘
📌 LEAD SYSTEM
Limb Leads (Frontal Plane)
| Lead | View | Normal QRS |
|---|---|---|
| Lead I | Left arm (+) vs Right arm (-) | Positive |
| Lead II | Left foot (+) vs Right arm (-) | Tallest positive |
| Lead III | Left foot (+) vs Left arm (-) | Variable |
| aVR | Right arm augmented | Negative (all goes away) |
| aVL | Left arm augmented | Variable |
| aVF | Left foot augmented | Positive |
Chest Leads (Horizontal Plane)
| Lead | Position | View |
|---|---|---|
| V1 | 4th ICS, right sternal border | Right ventricle |
| V2 | 4th ICS, left sternal border | Septum |
| V3 | Between V2 and V4 | Anterior |
| V4 | 5th ICS, mid-clavicular line | Anterior |
| V5 | Anterior axillary line | Lateral |
| V6 | Mid-axillary line | Lateral |
📌 CARDIAC AXIS
Normal Axis:    -30° to +90°     → Lead I (+), Lead II (+), aVF (+)
Left Axis Dev:  -30° to -90°     → Lead I (+), aVF (-)
Right Axis Dev: +90° to +180°    → Lead I (-), aVF (+)
Extreme Axis:   -90° to +180°    → Lead I (-), aVF (-)
Quick Axis Check: "Lead I and aVF Method"
Lead I (+) + aVF (+) = NORMAL AXIS  ✅
Lead I (+) + aVF (-) = LEFT AXIS    ←
Lead I (-) + aVF (+) = RIGHT AXIS   →
Lead I (-) + aVF (-) = EXTREME      ↙ (Northwest)
═══════════════════════════════
PHASE 2 – ECG WAVES
═══════════════════════════════
📌 NORMAL ECG WAVEFORM ANATOMY
📌 P WAVE
Represents: Atrial depolarization
Duration:   < 0.12 sec (3 small boxes)
Amplitude:  < 2.5 mm
Shape:      Rounded, upright in II, inverted in aVR
Normal P Wave
- Positive in leads I, II, aVF, V4-V6
- Negative in aVR
- Axis: 0° to +75°
Abnormal P Waves
| Finding | ECG Feature | Cause |
|---|---|---|
| P pulmonale | Tall, peaked P >2.5 mm in II | Right atrial enlargement (COPD, PE, RVH) |
| P mitrale | Broad, notched P >0.12s, biphasic in V1 | Left atrial enlargement (mitral stenosis) |
| Absent P | No P waves | AF, junctional rhythm, SA block |
| Inverted P | Negative P in II | Retrograde atrial activation (junctional) |
📌 PR INTERVAL
Normal:     0.12 - 0.20 sec (3-5 small boxes)
Represents: AV node conduction time
| PR Finding | Value | Cause |
|---|---|---|
| Short PR (<0.12s) | <3 small boxes | WPW, LGL syndrome, junctional rhythm |
| Long PR (>0.20s) | >5 small boxes | 1st degree AV block |
| Variable PR | Changes beat-to-beat | 2nd degree AV block (Wenckebach) |
📌 QRS COMPLEX
Represents: Ventricular depolarization
Normal duration: < 0.12 sec (3 small boxes)
| Component | Definition |
|---|---|
| Q wave | First negative deflection BEFORE R wave |
| R wave | First positive deflection |
| S wave | Negative deflection AFTER R wave |
Abnormal QRS Findings
| Finding | Definition | Significance |
|---|---|---|
| Wide QRS (>0.12s) | ≥3 small boxes | BBB, aberrant conduction, paced rhythm |
| Pathological Q wave | >1 small box wide OR >25% of R height | Old MI |
| R-wave progression | R increases V1→V6 | Loss = anterior MI or LBBB |
| Delta wave | Slurred initial QRS upstroke | WPW syndrome |
📌 ST SEGMENT
Represents: Early ventricular repolarization
Normal:     Isoelectric (flat at baseline)
| Finding | Definition | Causes |
|---|---|---|
| ST Elevation | >1mm in limb leads, >2mm in chest leads | STEMI, pericarditis, Brugada, LV aneurysm |
| ST Depression | Below baseline | NSTEMI, digoxin effect, LVH strain |
| J-point | Junction of QRS end and ST start | Reference for ST measurement |
📌 T WAVE
Represents: Ventricular repolarization
Normal:     Same direction as QRS (concordant)
| T Wave Finding | ECG Look | Causes |
|---|---|---|
| Tall, peaked T | >6mm | Hyperkalemia, hyperacute MI |
| Inverted T | Downward | Ischemia, LVH strain, PE (V1-V4) |
| Biphasic T | Up then down | Wellens syndrome (LAD occlusion warning!) |
| Flat T | <1mm | Hypokalemia, hypothyroidism |
📌 QT INTERVAL
Represents: Total ventricular repolarization
Measured:   Start of Q to end of T (lead II or V5)
Normal QTc: < 440ms (men), < 460ms (women)
Formula:    QTc = QT ÷ √RR (Bazett formula)
| QT Finding | Value | Cause |
|---|---|---|
| Prolonged QT | >440ms (M), >460ms (F) | Drugs, hypocalcemia, hypokalemia, Long QT syndrome |
| Short QT | <350ms | Hypercalcemia, digoxin, Short QT syndrome |
═══════════════════════════════
PHASE 3 – RHYTHM ANALYSIS
═══════════════════════════════
📌 HEART RATE CALCULATION
Method 1: Large Box Method (Regular Rhythm)
Rate = 300 ÷ number of large boxes between R-R
Memorize: 300, 150, 100, 75, 60, 50
Method 2: Small Box Method
Rate = 1500 ÷ number of small boxes between R-R
Method 3: 6-Second Strip Method (Irregular Rhythm)
Count QRS complexes in 6 seconds × 10 = rate/min
(Works for AF, irregular rhythms)
📌 RHYTHM ANALYSIS FRAMEWORK
- Is there a P wave before every QRS? (normal conduction)
- Is QRS after every P wave? (AV conduction intact)
- Is the rhythm regular? (measure R-R intervals)
- What is the rate?
- Is the QRS narrow (<0.12s) or wide (≥0.12s)?
📌 SINUS RHYTHMS
| Rhythm | Rate | Features |
|---|---|---|
| Normal Sinus | 60-100 | P before every QRS, PR 0.12-0.20s |
| Sinus Tachycardia | >100 | Same morphology, P present, gradual onset |
| Sinus Bradycardia | <60 | Same morphology, P present |
| Sinus Arrhythmia | 60-100 | Variable R-R, increases with inspiration (normal variant) |
═══════════════════════════════
PHASE 4 – ARRHYTHMIAS
═══════════════════════════════
📌 ATRIAL ARRHYTHMIAS
PAC (Premature Atrial Contraction)
ECG Features:
- Early, abnormal-looking P wave
- Narrow QRS (usually)
- Compensatory pause may follow
- P wave axis different from sinus
SVT (Supraventricular Tachycardia)
ECG Features:
- Rate: 150-250 bpm
- Narrow QRS (unless aberrant)
- Regular rhythm
- P waves hidden in/after QRS or absent
- Abrupt onset and termination
Atrial Flutter
ECG Features:
- "Sawtooth" flutter waves at 300 bpm
- 2:1 or 4:1 conduction ratio
- Ventricular rate: 75-150 bpm
- Best seen in lead II and V1
Atrial Fibrillation (AF)
ECG Features:
- Irregularly IRREGULAR rhythm
- No visible P waves - chaotic baseline
- Narrow QRS (unless BBB)
- Atrial activity at 350-600 bpm
📌 VENTRICULAR ARRHYTHMIAS
PVC (Premature Ventricular Contraction)
ECG Features:
- Wide, bizarre QRS (>0.12s)
- No preceding P wave
- T wave in OPPOSITE direction to QRS
- Compensatory pause
- Can be unifocal or multifocal
Ventricular Tachycardia (VT)
ECG Features:
- Rate: 100-250 bpm
- Wide QRS (>0.12s)
- AV dissociation (P waves independent)
- Fusion beats and capture beats
- Can be: Monomorphic (same QRS shape) or Polymorphic (changing)
Ventricular Fibrillation (VF)
ECG Features:
- Chaotic, disorganized waveforms
- No recognizable QRS
- Varying amplitude and frequency
- CARDIAC EMERGENCY - CPR + Defibrillation
Torsades de Pointes
ECG Features:
- Polymorphic VT
- QRS complexes "twist" around isoelectric line
- Occurs in setting of prolonged QT
- Treat with IV Magnesium Sulfate
Junctional Rhythm
ECG Features:
- Rate: 40-60 bpm
- Narrow QRS
- Inverted P waves (retrograde) - in II, III, aVF
- P may be before, in, or after QRS
Asystole & PEA
Asystole: Flat line - no electrical activity
PEA: Electrical activity present, no pulse
Both = Non-shockable rhythms
═══════════════════════════════
PHASE 5 – HEART BLOCKS
═══════════════════════════════
📌 AV BLOCKS
| Block | PR Interval | Dropped QRS? | P:QRS Ratio | Key Feature |
|---|---|---|---|---|
| 1st Degree | >0.20s (fixed) | Never | 1:1 | Long PR, all conduct |
| 2nd Degree Mobitz I (Wenckebach) | Progressively longer | Yes (periodically) | n:1 (e.g. 4:3) | PR gets longer until drop |
| 2nd Degree Mobitz II | Fixed | Yes | n:1 | Sudden drop, no warning |
| 3rd Degree (Complete) | No relationship | Complete block | None | AV dissociation |
Memory Tips:
- Wenckebach (Mobitz I): "Longer, Longer, Drop - then you Wenckebach"
- Mobitz II: More dangerous than Mobitz I - can progress to complete block
- 3rd Degree: Atria and ventricles beat independently
📌 BUNDLE BRANCH BLOCKS
RBBB (Right Bundle Branch Block)
Criteria: QRS ≥ 0.12s
Classic Pattern in V1: RSR' ("Rabbit ears" or "M" pattern)
Lead I/V6: Wide S wave
T waves: Inverted in V1-V2
Memory: "WiLLiaM" → LBBB = W in V1, M in V6
         "MaRRoW"  → RBBB = M in V1, W in V6
LBBB (Left Bundle Branch Block)
Criteria: QRS ≥ 0.12s
Classic Pattern in V1: Broad, deep QS or rS (W shape)
Lead I/V6: Broad, tall R with no S (M shape)
T waves: Inverted in I, aVL, V5-V6
IMPORTANT: LBBB makes ischemia/MI diagnosis difficult!
═══════════════════════════════
PHASE 6 – ISCHEMIA & MI
═══════════════════════════════
📌 STEMI vs NSTEMI
| Feature | STEMI | NSTEMI |
|---|---|---|
| ST Segment | ELEVATED | Depressed or normal |
| Troponin | Elevated | Elevated |
| Q waves | May develop | Rare |
| Treatment | Immediate cath/PCI | Medical + early cath |
📌 STEMI LOCALIZATION
| MI Territory | ST Elevation Leads | Reciprocal Changes | Artery |
|---|---|---|---|
| Inferior MI | II, III, aVF | I, aVL, (V1-V3) | RCA (80%), LCx (20%) |
| Anterior MI | V1-V4 | II, III, aVF | LAD |
| Lateral MI | I, aVL, V5-V6 | II, III, aVF | LCx |
| Septal MI | V1-V2 | - | LAD (septal branch) |
| Posterior MI | Tall R in V1-V2 + ST depression V1-V3 | (posterior leads V7-V9) | RCA or LCx |
| Right Ventricular MI | V1, V3R-V4R | - | Proximal RCA |
Posterior MI Trick:
- Look for ST depression + tall R in V1-V2
- "Mirror image" of a STEMI if you flip the ECG
- Use right-sided leads V3R, V4R to confirm RV MI
Evolutionary Changes of MI:
Hours 0-6:   Hyperacute T waves (tall, peaked) → ST elevation
Hours 6-24:  ST elevation, Q waves begin
Days 1-7:    T wave inversion, Q waves deepen
Weeks-months: ST normalizes, T waves may normalize, Q waves persist
═══════════════════════════════
PHASE 7 – ELECTROLYTE CHANGES
═══════════════════════════════
📌 ELECTROLYTE EFFECTS ON ECG
HYPERKALEMIA
Progression (K+ rising):
Mild (5.5-6.5):   Tall, peaked ("tented") T waves
Moderate (6.5-7): PR prolongation, QRS widening
Severe (>7):      Sine wave pattern, P wave disappears
Critical (>8):    VF → Asystole
HYPOKALEMIA
ECG Changes (K+ falling):
- Flattened T waves
- Prominent U waves (positive deflection after T)
- "T-U fusion" (prolonged apparent QT)
- Risk of Torsades de Pointes
HYPERCALCEMIA
- Shortened QT interval (main finding)
- Short ST segment
- J-waves possible
Memory: "HIGH calcium = SHORT QT"
HYPOCALCEMIA
- Prolonged QT interval
- Long ST segment (flat)
- T wave normal initially
Memory: "LOW calcium = LONG QT"
═══════════════════════════════
PHASE 8 – ADVANCED ECG
═══════════════════════════════
📌 WPW SYNDROME
Mechanism: Accessory pathway (Bundle of Kent) bypasses AV node
ECG Features:
  - Short PR interval (<0.12s)
  - Delta wave (slurred QRS upstroke)
  - Wide QRS (>0.12s)
  - ST/T changes (discordant)

Risk: Can conduct AF very rapidly → VF → sudden death
AVOID: Adenosine, digoxin, verapamil (can cause VF)
TREAT: Procainamide, cardioversion, ablation
📌 BRUGADA SYNDROME
Mechanism: SCN5A sodium channel mutation
ECG Features (Type 1 - diagnostic):
  - "Coved" ST elevation ≥2mm in V1-V2 (right precordial leads)
  - Downsloping ST followed by T wave inversion

Types:
  Type 1: Coved pattern (diagnostic)
  Type 2: "Saddleback" pattern (not diagnostic alone)

Triggers: Fever, sodium channel blockers, alcohol
Risk: Sudden cardiac death during sleep
Treatment: ICD
📌 LONG QT SYNDROME
Definition: QTc >440ms (men), >460ms (women)
Types: Congenital (LQT1, LQT2, LQT3) or Acquired

Congenital causes:
  LQT1 - KCNQ1 gene, triggered by exercise (swimming)
  LQT2 - HERG gene, triggered by sudden sound
  LQT3 - SCN5A gene, occurs at rest/sleep

Acquired causes:
  Drugs: QT-prolonging drugs (anti-arrhythmics, antipsychotics, macrolides)
  Electrolytes: Hypokalemia, hypomagnesemia, hypocalcemia

Risk: Torsades de Pointes → VF → sudden death
Treatment: Beta-blockers (congenital), remove offending drug (acquired)
📌 PACEMAKER ECG
ECG Features:
  - Pacing spike (vertical line) before each paced beat
  - Atrial pacing: spike → P wave
  - Ventricular pacing: spike → wide QRS (LBBB-like morphology)
  - Dual-chamber: spike before P + spike before QRS

Pacemaker Malfunction:
  Failure to pace: Expected spike absent
  Failure to capture: Spike present but no P/QRS after
  Failure to sense: Spikes where they shouldn't be (undersensing)
📌 PERICARDITIS ECG
Classic ECG Findings (4 stages):
Stage 1: Diffuse ST elevation (saddle-shaped, concave up) + PR depression
         - ALL leads except aVR and V1
Stage 2: ST normalizes, PR depression persists
Stage 3: T wave inversion (may simulate ischemia)
Stage 4: Normalization

Key Differentiators from MI:
  ✅ Pericarditis: Diffuse ST elevation (multiple territories)
  ✅ Pericarditis: PR depression (highly specific)
  ✅ Pericarditis: Saddle/concave shape
  ❌ MI: Focal ST elevation + reciprocal changes

Spodick's Sign: Downsloping TP segment
📌 PULMONARY EMBOLISM (PE)
Classic S1Q3T3 Pattern (only 20% of cases):
  - S wave in Lead I
  - Q wave in Lead III
  - T wave inversion in Lead III

More Common ECG Features in PE:
  - Sinus tachycardia (most common!)
  - Right heart strain: T inversion V1-V4
  - RBBB (complete or incomplete)
  - Right axis deviation
  - P pulmonale
  - AF (acute onset)
📌 COPD ECG
ECG Features of COPD:
  - P pulmonale (tall peaked P >2.5mm in II)
  - Right axis deviation
  - Low voltage QRS (hyperinflation)
  - Poor R-wave progression V1-V4
  - Vertical heart axis
  - RVH pattern (dominant R in V1, deep S in V5-V6)
  - "Clockwise rotation" of precordial leads
📌 LVH / RVH
Left Ventricular Hypertrophy (LVH)
Voltage Criteria (most common):
  Sokolow-Lyon: S in V1 + R in V5 or V6 > 35mm
  Cornell: R in aVL + S in V3 > 28mm (men), >20mm (women)

Associated Features:
  - ST depression + T inversion in I, aVL, V5-V6 ("strain pattern")
  - Left axis deviation
  - Prolonged QRS
Right Ventricular Hypertrophy (RVH)
Criteria:
  - R > S in V1 (dominant R in right leads)
  - Right axis deviation (>+90°)
  - ST depression + T inversion V1-V3 (strain)
  - S waves V5-V6

Causes: Pulmonary hypertension, mitral stenosis, Eisenmenger, COPD
═══════════════════════════════
ECG INTERPRETATION: 10-STEP METHOD
═══════════════════════════════
🔟 THE SYSTEMATIC 10-STEP APPROACH
STEP 1 - Patient Details
✔ Name, age, sex, date/time
✔ Clinical context (chest pain? syncope? routine?)
✔ Compare with previous ECG if available
STEP 2 - Calibration
✔ Check calibration mark: 10mm = 1mV (standard)
✔ Check paper speed: 25mm/s (standard)
✔ Half-standard (5mm=1mV) or double-standard? → Adjust your measurements!
STEP 3 - Heart Rate
Regular rhythm:
  Rate = 300 ÷ large boxes between QRS peaks
  Quick sequence: 300 → 150 → 100 → 75 → 60 → 50

Irregular rhythm:
  Count QRS in 6-sec strip × 10

Classification:
  Bradycardia: <60 bpm
  Normal: 60-100 bpm
  Tachycardia: >100 bpm
STEP 4 - Rhythm
✔ Regular or irregular?
✔ Regularly irregular (pattern) or irregularly irregular (AF)?
✔ Identify P wave relationship to QRS
STEP 5 - Axis
Use Lead I and aVF:
  Both +  → Normal (-30° to +90°)
  I+/aVF- → Left axis deviation
  I-/aVF+ → Right axis deviation
  Both -  → Extreme/NW axis
STEP 6 - P Wave
✔ Present? One before every QRS?
✔ Normal morphology (upright in II, inverted in aVR)?
✔ Duration <0.12s? Height <2.5mm?
✔ Abnormal: tall (RAE), broad/notched (LAE), absent (AF)?
STEP 7 - PR Interval
✔ Normal: 0.12-0.20s (3-5 small boxes)
✔ Long PR: 1st degree AV block
✔ Short PR: WPW, LGL
✔ Variable PR: Wenckebach
✔ No consistent PR: Complete heart block
STEP 8 - QRS Complex
✔ Duration: Normal <0.12s; Wide ≥0.12s?
✔ Morphology: BBB pattern? Delta wave?
✔ Voltage: Low (COPD, effusion) or high (LVH)?
✔ Q waves: Pathological (>1 box wide, >25% R height)?
✔ R-wave progression V1→V6 normal?
STEP 9 - ST Segment
✔ Isoelectric (at baseline)?
✔ Elevation: STEMI, pericarditis, Brugada?
✔ Depression: Ischemia, NSTEMI, digoxin?
✔ Shape: Concave (pericarditis), convex (STEMI), horizontal (ischemia)?
✔ Check ALL 12 leads + note which territory
STEP 10 - T Wave & QT Interval
T Wave:
✔ Concordant with QRS? (should be same direction)
✔ Tall peaked: hyperkalemia, hyperacute MI
✔ Inverted: ischemia, strain, PE, RBBB, normal V1
✔ Biphasic: Wellens syndrome
✔ Flat: hypokalemia

QT Interval:
✔ Measure in lead II or V5 (clearest T wave)
✔ Calculate QTc = QT ÷ √RR interval (seconds)
✔ Normal: <440ms (M), <460ms (F)
✔ Long: drug effects, electrolytes, congenital LQT
🎬 MASTER VIDEO PLAYLIST
📚 QUICK REFERENCE CHEAT SHEET
| Condition | Key ECG Finding | Memory Hook |
|---|---|---|
| Normal Sinus | P→QRS→T, rate 60-100 | "Perfectly predictable" |
| AF | Irregularly irregular, no P | "A-Fibrillation = A-normally chaotic" |
| AFL | Sawtooth at 300 bpm | "Saw the flutter" |
| VT | Wide complex tachycardia | "Wide & Fast = Ventricular" |
| VF | Chaotic - no QRS | "Ventricular Failure" |
| 1° AV Block | Long PR (>0.20s) | "Delayed not denied" |
| Mobitz I | Longer-longer-drop | "Wenckebach Wanders then Drops" |
| Mobitz II | Fixed PR, sudden drop | "Mobitz Murders without warning" |
| 3° AVB | P & QRS unrelated | "Complete Divorce" |
| RBBB | RSR' in V1 (M shape) | "MaRRoW - M in V1" |
| LBBB | W in V1, M in V6 | "WiLLiaM - W in V1" |
| Inferior STEMI | ST↑ in II, III, aVF | "Inferior = II, III, aVF (low leads)" |
| Anterior STEMI | ST↑ in V1-V4 | "Anterior = chest leads" |
| Hyperkalemia | Tall peaked T waves | "High K = High T tent" |
| Hypokalemia | Flat T + U wave | "Low K = U see U wave" |
| Hypercalcemia | Short QT | "High Ca = Squeeze the QT" |
| Hypocalcemia | Long QT | "Low Ca = Loooong QT" |
| WPW | Delta wave + short PR | "Wolf in sheep's clothing" |
| Pericarditis | Diffuse ST↑ + PR↓ | "Saddle shape, PR sags" |
| PE | S1Q3T3 + tachycardia | "Sinus tachycardia + strain right" |
| Torsades | Twisting QRS + long QT | "Torsades Twists" |