Give me 10 diaeases with ecg changes and ecg images of that diseases
ECG changes 10 diseases electrocardiogram findings with images
ECG changes hyperkalemia hypokalemia STEMI atrial fibrillation Brugada syndrome images litfl
ECG STEMI pulmonary embolism WPW long QT pericarditis hyperkalemia images litfl site:litfl.com
STEMI inferior ECG image litfl pericarditis ECG pulmonary embolism S1Q3T3 ECG image
atrial fibrillation ECG image hypokalaemia U wave ECG pulmonary embolism S1Q3T3 ECG long QT syndrome ECG litfl images
10 Diseases with ECG Changes
1. ST-Elevation Myocardial Infarction (STEMI)
- ST elevation ≥ 1mm in 2+ contiguous leads in the territory of the occluded artery
- Hyperacute (tall, broad) T waves in early phase
- Reciprocal ST depression in mirror leads
- Pathological Q waves develop within hours (>40ms wide, >25% of R wave height)
- T wave inversion follows ST elevation

2. Acute Pericarditis
- Diffuse, saddle-shaped (concave up) ST elevation in most leads (except aVR and V1)
- PR segment depression in the same leads (very specific finding)
- PR elevation in aVR (reciprocal)
- No reciprocal ST depression (unlike STEMI)
- Evolves through 4 stages: ST elevation → ST normalization → T wave inversion → T wave normalization
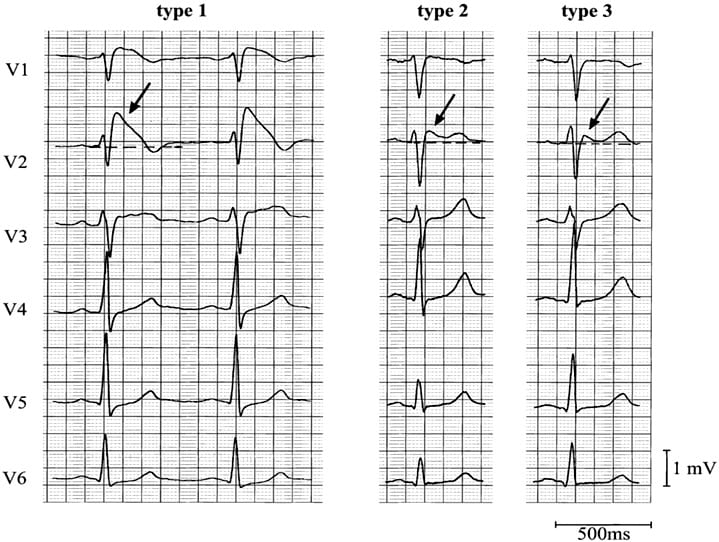
3. Brugada Syndrome
- Coved-type ST elevation ≥ 2mm in V1-V3
- Followed by negative T wave (no isoelectric separation)
- Spontaneous or drug-induced (sodium channel blockers, fever)
- Right bundle branch block pattern may be present
- Predisposes to ventricular fibrillation and sudden cardiac death
4. Hyperkalemia
- K+ 5.5-6.5 mmol/L: Tall, peaked (tented) T waves, narrow-based
- K+ 6.5-7.5 mmol/L: Prolonged PR interval, widening QRS
- K+ 7.5-9.0 mmol/L: P wave flattening/disappearance, wide QRS, sine wave pattern
- K+ >9 mmol/L: Sine wave, ventricular fibrillation, asystole
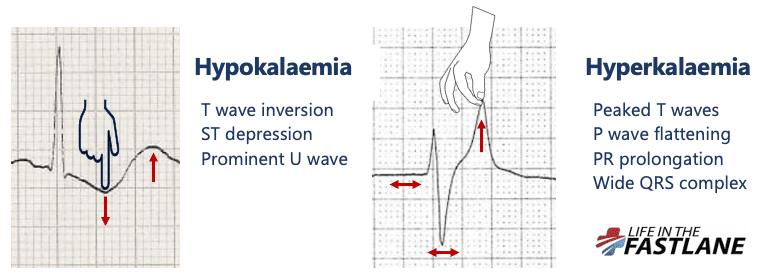
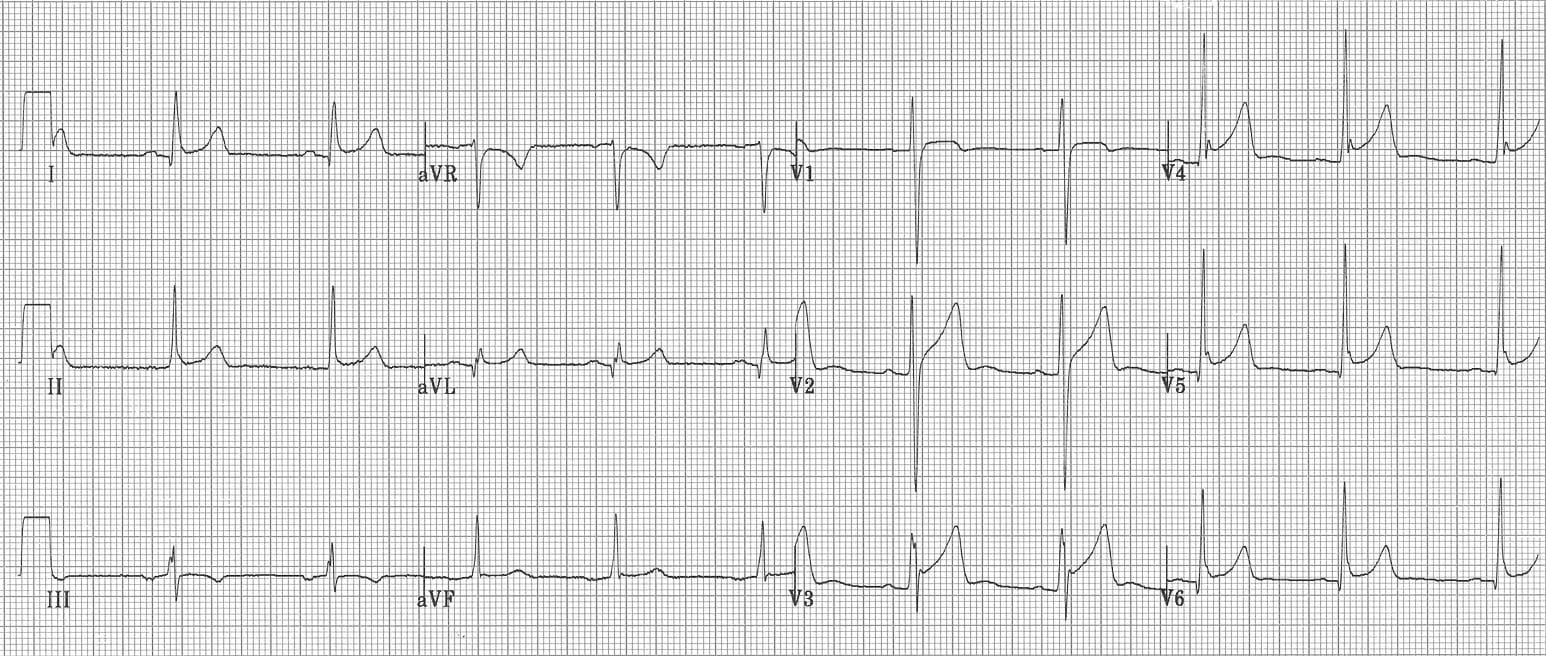
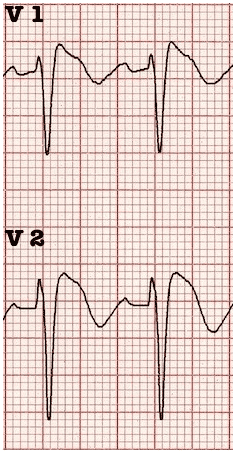
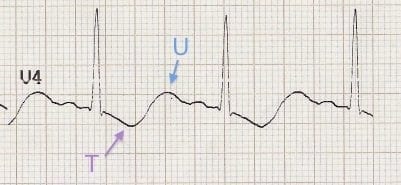
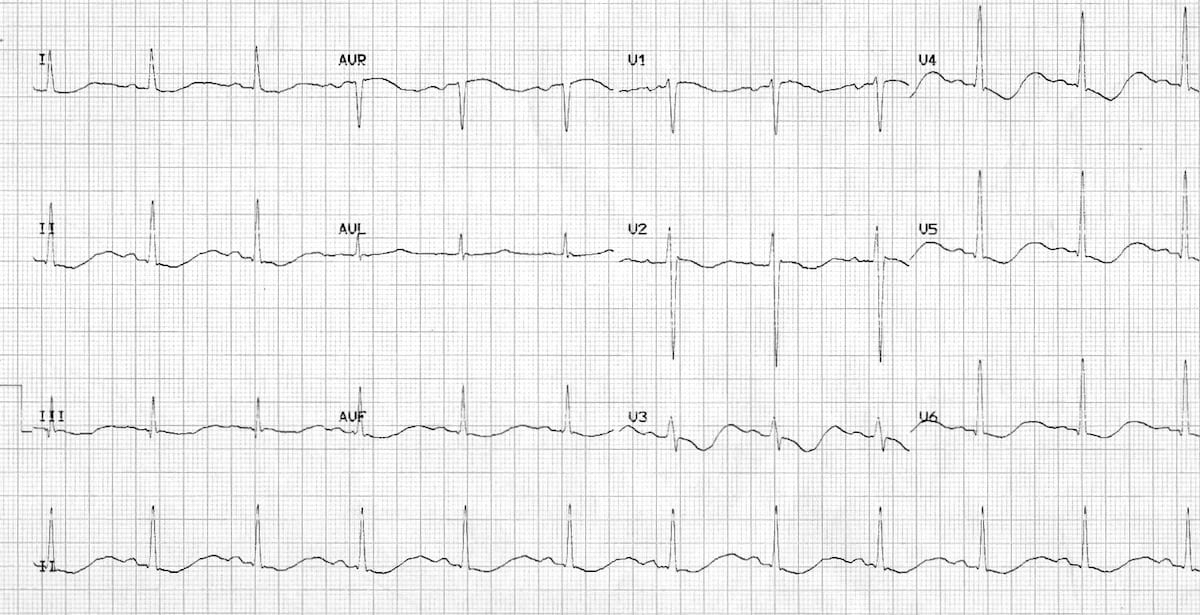
5. Hypokalemia
- Prominent U waves (most characteristic; best seen in V2-V3)
- Flattened or inverted T waves
- ST segment depression
- Apparent QT prolongation (actually QU prolongation)
- Prolonged PR interval
- Predisposes to torsades de pointes and atrial/ventricular ectopy
6. Pulmonary Embolism (PE)
- S1Q3T3 pattern - deep S in lead I, Q wave in III, inverted T in III (classic but only ~20% sensitive)
- T wave inversions in right precordial leads V1-V4 (most specific finding)
- New incomplete or complete RBBB
- Sinus tachycardia (most common finding)
- Right axis deviation
- P pulmonale (peaked P waves in II)
- Negative T waves in BOTH lead III and V1 have 88% sensitivity and 99% specificity for PE vs ACS
7. Wolff-Parkinson-White (WPW) Syndrome
- Short PR interval (< 120ms) - pre-excitation via accessory pathway
- Delta wave - slurred upstroke of the QRS
- Widened QRS (> 120ms)
- Pseudo-infarction Q waves (negative delta waves can mimic Q waves)
- Secondary ST-T changes (discordant from QRS)
- Susceptible to SVT (AVRT) and, dangerously, AF with rapid ventricular conduction
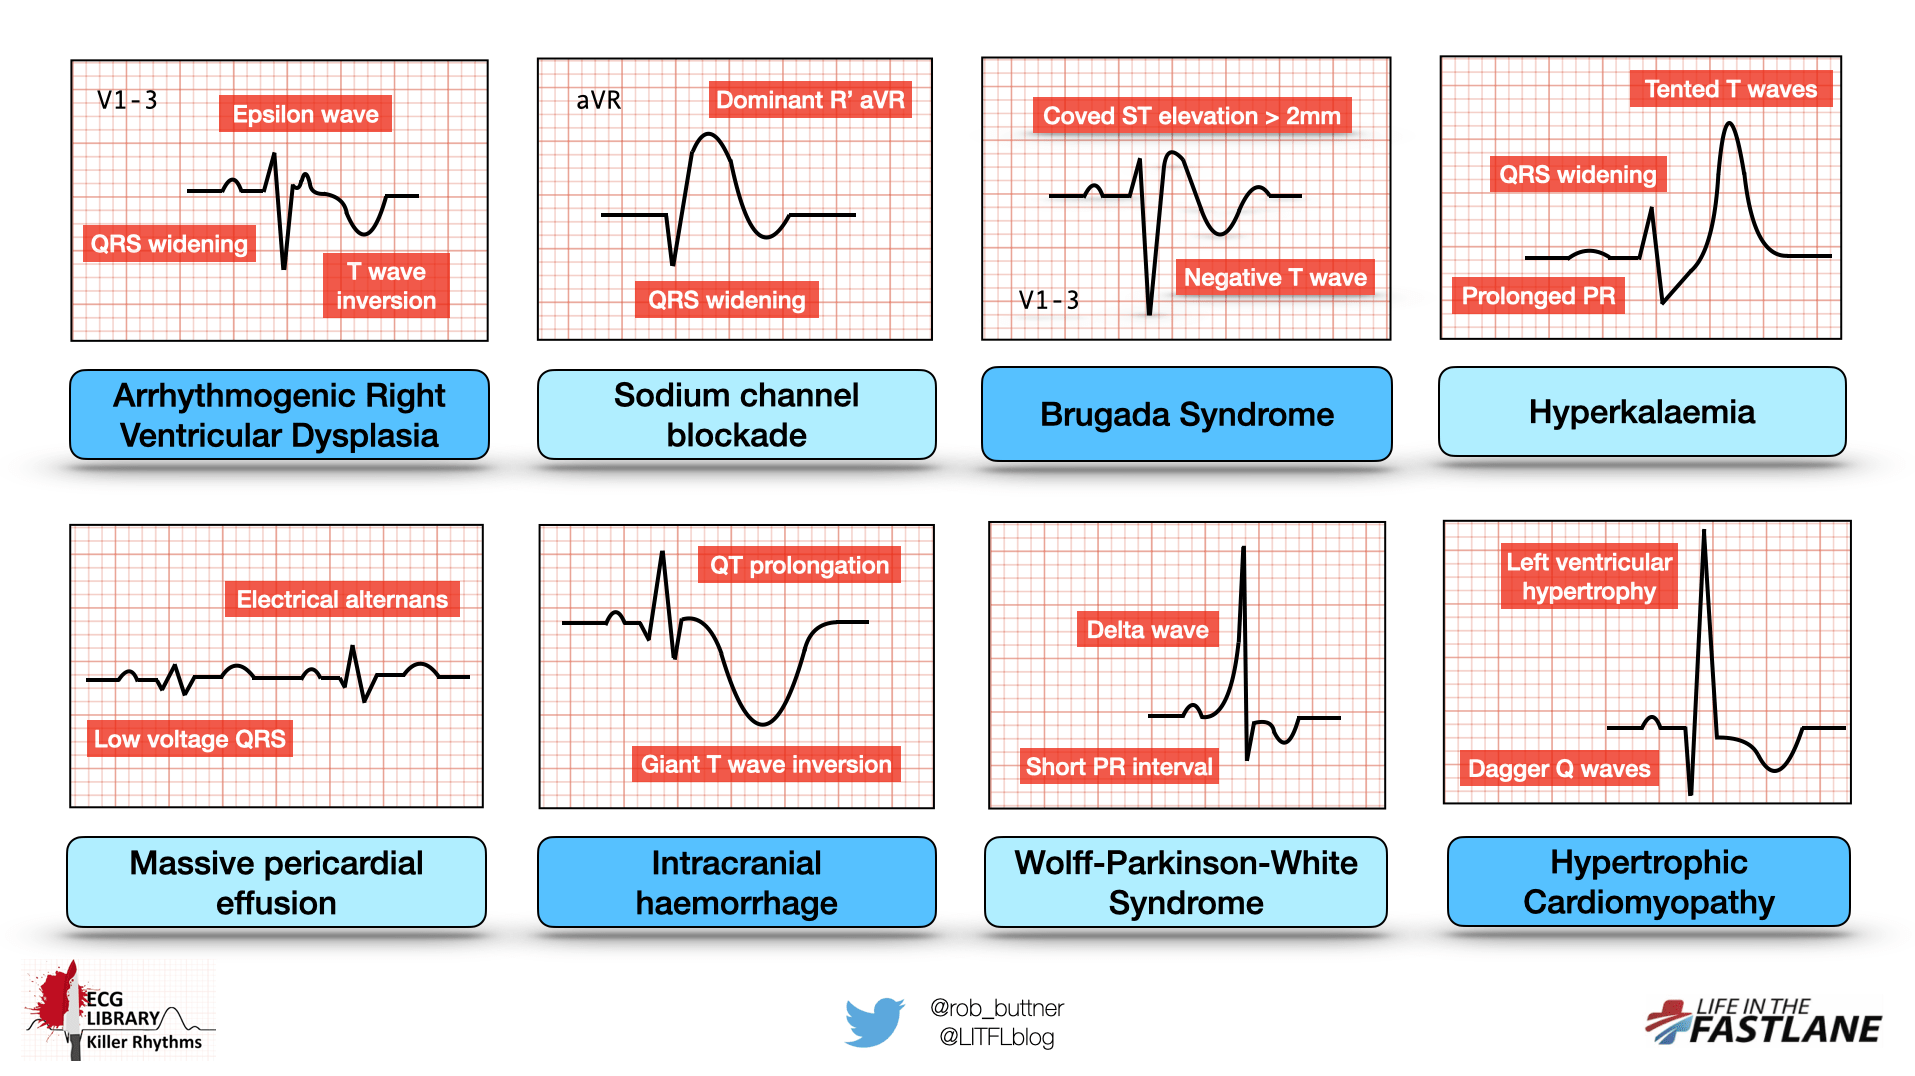
8. Hypertrophic Cardiomyopathy (HCM)
- Left ventricular hypertrophy (increased QRS voltage: S in V1 + R in V5/V6 > 35mm)
- Deep, narrow ("dagger") Q waves in lateral leads (I, aVL, V5-V6) due to septal hypertrophy
- Left axis deviation
- T wave inversions (especially in apical HCM - giant T wave inversions in V3-V5)
- Left atrial enlargement (broad, notched P waves in II)
- Apical HCM specifically: giant T wave inversions (>10mm) in precordial leads
9. Complete Heart Block (Third-Degree AV Block)
- P waves and QRS complexes are completely dissociated (no relationship between P and R)
- Regular P-P intervals and regular R-R intervals, but at different rates
- P rate > ventricular rate
- Wide, bizarre QRS if ventricular escape rhythm (junctional escape gives narrow QRS ~40-60 bpm, ventricular escape gives wide QRS ~20-40 bpm)
- Cannon A waves on JVP clinically
10. Long QT Syndrome (Congenital or Acquired)
- Prolonged QTc: ≥ 450ms in men, ≥ 460ms in women (QTc = QT / √RR interval)
- T wave morphology abnormalities: notched T waves, bifid T waves, biphasic T waves
- Predisposes to torsades de pointes (polymorphic VT with twisting around the baseline)
- T wave alternans may be seen
- Causes: congenital (LQTS1-3), drugs (antiarrhythmics, antipsychotics, antibiotics), electrolyte abnormalities (hypoK, hypoMg, hypoCa), hypothyroidism, intracranial hemorrhage
Quick Reference Summary
| Disease | Key ECG Finding |
|---|---|
| STEMI | ST elevation in territory + reciprocal changes + Q waves |
| Acute Pericarditis | Diffuse concave ST elevation + PR depression |
| Brugada Syndrome | Coved ST elevation V1-V3 + negative T wave |
| Hyperkalemia | Peaked T waves → wide QRS → sine wave |
| Hypokalemia | Prominent U waves + ST depression + flat T waves |
| Pulmonary Embolism | S1Q3T3 + T inversions V1-V4 + sinus tachycardia |
| WPW Syndrome | Short PR + delta wave + wide QRS |
| Hypertrophic Cardiomyopathy | LVH + dagger Q waves (lateral) + T inversions |
| Complete Heart Block | P-QRS dissociation + escape rhythm |
| Long QT Syndrome | Prolonged QTc ≥ 450ms + T wave morphology changes |
Sources: LITFL ECG Library - Life in the Fast Lane; Braunwald's Heart Disease, 11th Ed.; ROSEN's Emergency Medicine
How to read ecg easily at opd ? Explain with ecg images
how to read ECG systematically step by step approach OPD clinical litfl ECG interpretation
ECG lead placement anatomy diagram 12 lead normal sinus rhythm ECG image litfl
ECG paper speed calibration rate calculation normal values PR QRS QT intervals diagram litfl images 2024
ECG axis determination leads I aVF normal left right axis deviation diagram cardiac axis ECG image
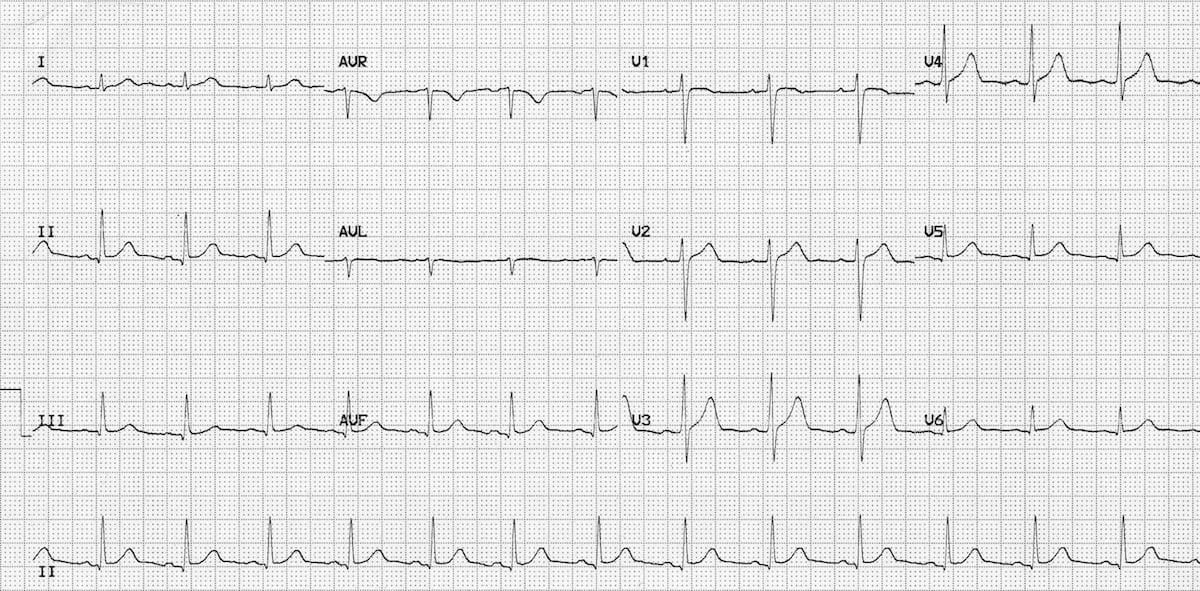
normal sinus rhythm 12 lead ECG image normal P wave QRS T wave litfl site:litfl.com
How to Read an ECG at OPD - A Systematic Approach
Before You Start: Know Your ECG Paper

- Paper speed: 25 mm/sec (standard)
- Amplitude: 10 mm = 1 mV
- 1 small square = 1 mm = 40 ms
- 1 large square = 5 mm = 200 ms
The ECG Waveform - Know What You're Looking At
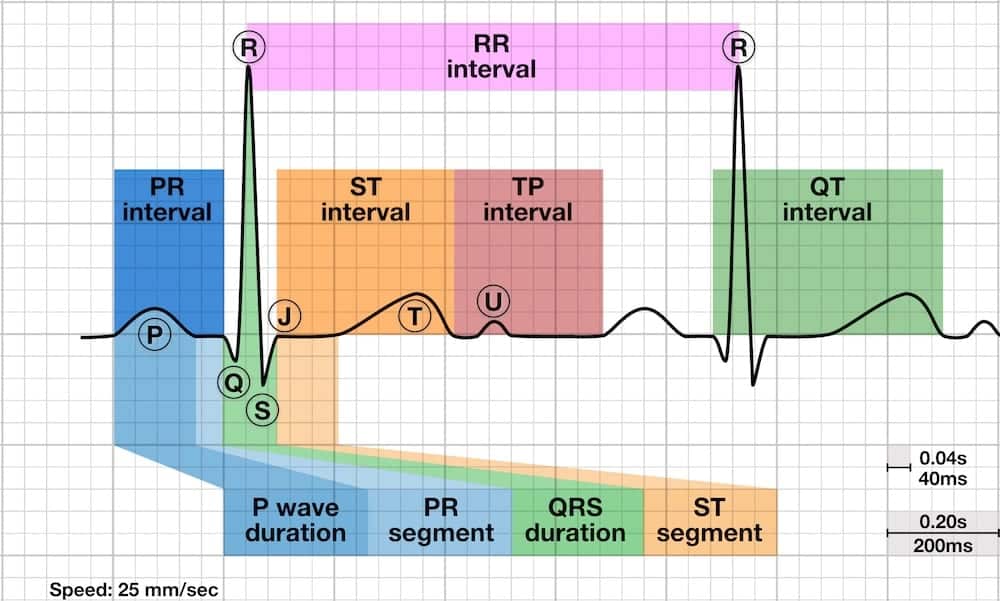
| Wave/Interval | Represents | Normal Value |
|---|---|---|
| P wave | Atrial depolarisation | < 120ms wide, < 2.5mm tall |
| PR interval | AV conduction time | 120-200ms (3-5 small squares) |
| QRS complex | Ventricular depolarisation | < 120ms (3 small squares) |
| ST segment | Early ventricular repolarisation | Isoelectric (flat at baseline) |
| T wave | Ventricular repolarisation | Upright in I, II, V3-V6 |
| QT interval | Total ventricular electrical activity | QTc < 440ms men, < 460ms women |
STEP 1 - RATE
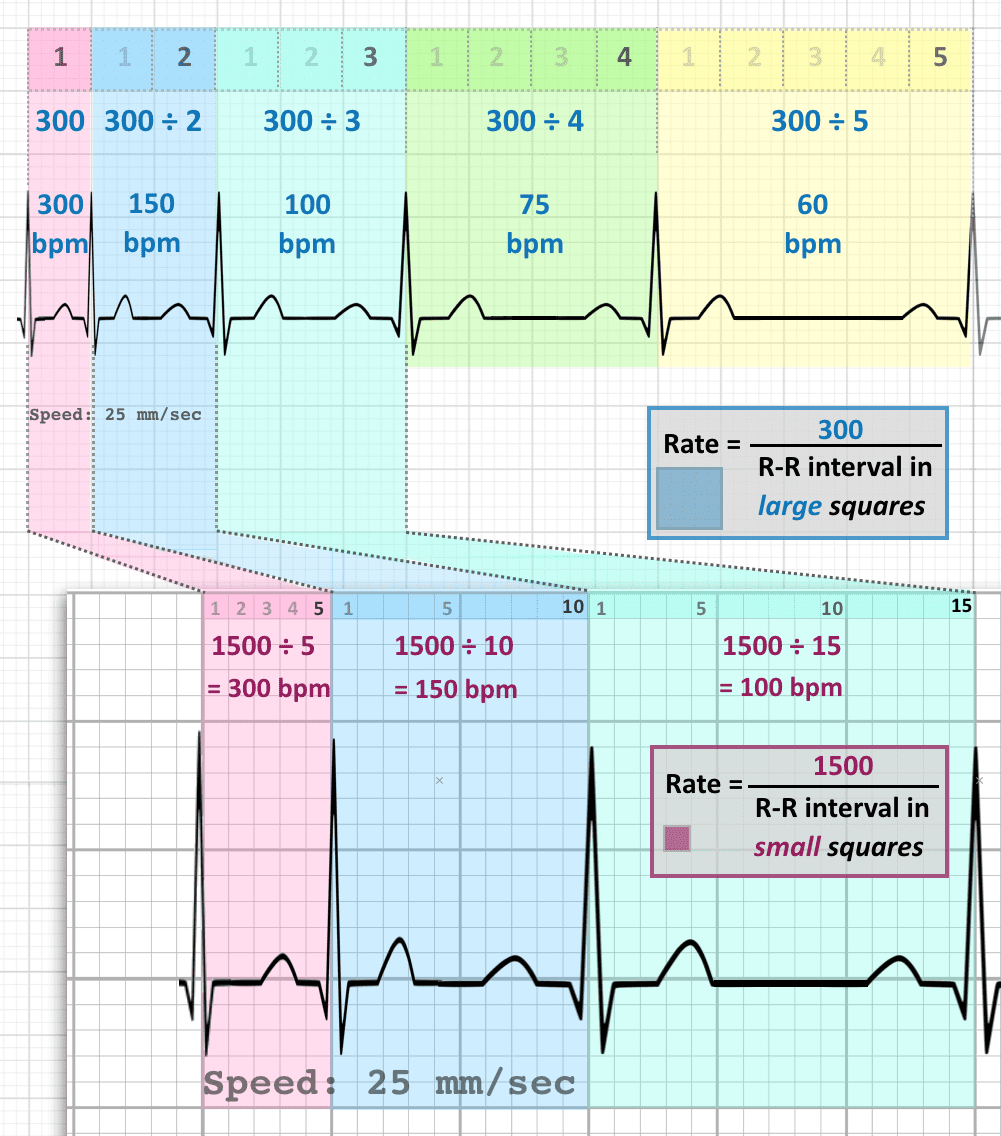
Count large squares between two R waves → Rate = 300 ÷ number of large squares
- 1 large square = 300 bpm
- 2 large squares = 150 bpm
- 3 large squares = 100 bpm
- 4 large squares = 75 bpm
- 5 large squares = 60 bpm
- 6 large squares = 50 bpm
Count QRS complexes in a 10-second strip × 6 = bpm
STEP 2 - RHYTHM
- Regular P waves - one before every QRS
- P waves upright in lead II, inverted in aVR
- Constant PR interval (120-200ms)
- Regular R-R intervals
| Finding | Think of |
|---|---|
| No P waves, irregularly irregular | Atrial Fibrillation |
| P waves present, regular but rate >100 | Sinus Tachycardia |
| P waves absent, saw-tooth pattern | Atrial Flutter |
| P-QRS dissociation | Complete Heart Block |
| Irregular with different P wave shapes | Multifocal Atrial Tachycardia |
STEP 3 - AXIS (Cardiac Axis)
| Lead I | Lead aVF | Axis | Meaning |
|---|---|---|---|
| Positive (↑) | Positive (↑) | Normal (-30° to +90°) | Normal |
| Positive (↑) | Negative (↓) | Left Axis Deviation | LVH, LAFB, Inferior MI |
| Negative (↓) | Positive (↑) | Right Axis Deviation | RVH, PE, RBBB |
| Negative (↓) | Negative (↓) | Northwest/Extreme | Severe pathology, dextrocardia |
OPD tip: If Lead I is "thumbs up" and aVF is "thumbs up" = normal axis. Easy!
STEP 4 - P WAVE (Atrial abnormalities)
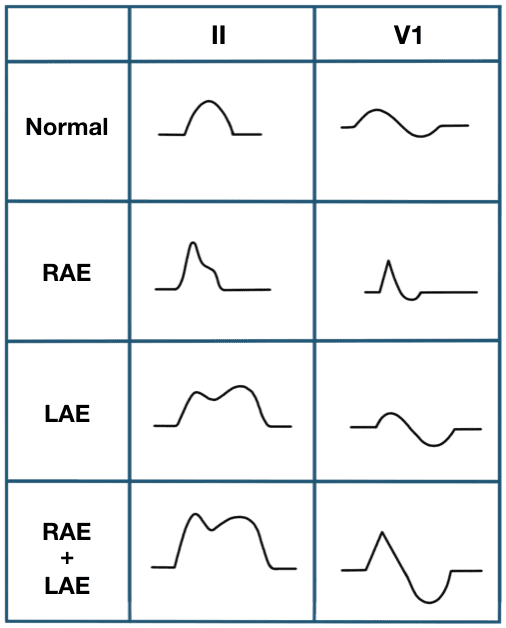
- Normal P wave: Smooth, rounded, < 2.5mm tall, < 120ms wide in Lead II
- Right Atrial Enlargement (P pulmonale): Peaked tall P wave > 2.5mm in Lead II (and III, aVF)
- Left Atrial Enlargement (P mitrale): Broad, notched (bifid) P wave > 120ms in Lead II; deep negative component in V1
- No P waves: Consider AF or junctional rhythm
STEP 5 - PR INTERVAL
| PR Finding | Meaning |
|---|---|
| PR > 200ms (>1 large square) | 1st degree AV block |
| PR progressively lengthens until P drops | 2nd degree AV block Mobitz I (Wenckebach) |
| Constant PR, occasional non-conducted P | 2nd degree AV block Mobitz II |
| P and QRS completely unrelated | 3rd degree (complete) AV block |
| Short PR < 120ms + delta wave | WPW syndrome |
| Short PR, narrow QRS, no delta wave | LGL syndrome / junctional rhythm |
STEP 6 - QRS COMPLEX
- Width - narrow vs wide
- Voltage - tall vs low
- Q waves - pathological Q waves?
- R wave progression - V1 to V6 (R gets taller, S gets smaller)
| QRS Finding | Meaning |
|---|---|
| Wide QRS > 120ms (RBBB pattern - rSR' in V1) | Right Bundle Branch Block |
| Wide QRS > 120ms (LBBB - broad notched R in V6) | Left Bundle Branch Block |
| Tall R in V5/V6 + deep S in V1 (>35mm total) | LVH |
| R > S in V1, right axis | RVH |
| Pathological Q waves (> 1mm wide or > 25% QRS height) in territory | Old MI / current STEMI |
| Low voltage (<5mm all limb leads, <10mm all precordial leads) | Pericardial effusion, obesity, COPD, amyloid |
| R wave does not grow V1→V6 (poor R wave progression) | Anterior MI, LBBB, LVH |
STEP 7 - ST SEGMENT
| ST Finding | Most Likely Cause |
|---|---|
| ST elevation in territory leads (V1-V4) | Anterior STEMI (LAD) |
| ST elevation in II, III, aVF with reciprocal change in I, aVL | Inferior STEMI (RCA) |
| Diffuse concave ST elevation + PR depression | Acute Pericarditis |
| ST depression widespread | NSTEMI, subendocardial ischemia, hypokalemia |
| Coved ST elevation V1-V3 + negative T | Brugada syndrome |
Key rule: ST elevation in a "territory" with reciprocal changes = STEMI until proven otherwise. Act immediately.
STEP 8 - T WAVE
| T Wave Finding | Meaning |
|---|---|
| Tall peaked (tented) T waves | Hyperkalemia, hyperacute STEMI |
| T wave inversion in V1-V4 + signs of strain | Pulmonary embolism, RV strain |
| Deep T wave inversions in V4-V6 | Ischemia, apical HCM (giant T inversions) |
| Biphasic T waves | De Winter pattern (LAD occlusion equivalent) |
| Flat T waves | Hypokalemia, early ischemia |
STEP 9 - QT INTERVAL
- Prolonged QTc: Drugs (amiodarone, antipsychotics, macrolides), hypokalemia, hypomagnesemia, hypothyroidism, congenital LQTS → risk of torsades de pointes
- Short QTc < 340ms: Hypercalcemia, digoxin, congenital short QT syndrome
The OPD Quick Reference Card
R - RATE       (>100 tachy, <60 brady)
R - RHYTHM     (regular? P before every QRS?)
R - (R wave progression V1→V6)
P - P WAVE     (tall, broad, absent?)
Q - PR interval (120-200ms normal)
R - QRS        (narrow <120ms, Q waves, voltage)
S - ST segment (elevation? depression?)
T - T waves    (peaked, inverted, flat?)
  + QT interval (< half RR = ok)
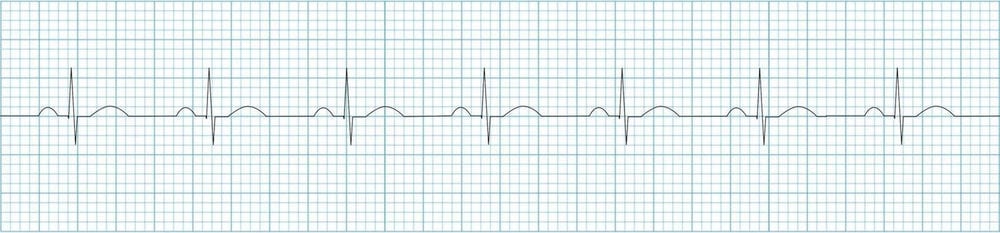
What a Normal ECG Should Look Like
- Rate: 60-100 bpm
- Regular rhythm, upright P in II before every QRS
- PR 120-200ms, narrow QRS <120ms
- R wave grows from V1 to V5/V6
- ST segment isoelectric in all leads
- Upright T waves in I, II, V3-V6
- QTc within normal limits
Practical OPD Tips
- Always look at the patient first - ECG findings must match clinical context
- Compare with old ECG when available - a "new" change matters much more than a "known" one
- Rate and rhythm first - if the patient is unstable, this is what matters immediately
- A normal ECG does not rule out ACS - if chest pain is present, serial ECGs and troponins are needed
- aVR is the forgotten lead - ST elevation in aVR + diffuse ST depression = left main / proximal LAD occlusion (critical!)
- Calibration check - always confirm 1mV = 10mm marker is present on the ECG before interpreting voltage
Sources: LITFL ECG Library - Life in the Fast Lane; Braunwald's Heart Disease, 11th Ed.