
Compound action potential
A quick overview before I pull from the textbooks:
A compound action potential (CAP) is the summed electrical response of many nerve fibers firing together. When a mixed nerve is stimulated, fibers of different diameters and myelination conduct at different speeds, so the recorded waveform shows multiple peaks - each peak representing a group of fibers (A-alpha, A-beta, A-delta, B, C) arriving at the recording electrode at different times.
Searching sources...
Reading File
Finding Sources
Finding Sources
Searching Images
compound action potential nerve fiber peaks velocity
Good findings. Now let me read the most relevant sections - the physiology textbook (Kandel's Principles of Neural Science) and the Medical Physiology content:
Reading File
Reading File
Reading File
Now let me fetch the key diagram from Kandel and also read the Adams & Victor section on CMAP:
Loading Image
Reading File
Finding Sources
Let me also grab the nerve fiber classification table from Costanzo and the local anesthetic differential block from Campbell's:
Reading File
Reading File
I now have comprehensive, well-sourced material. Here is the full answer:
Compound Action Potential (CAP)
Definition
A compound action potential is the summated electrical response recorded from a whole nerve (or muscle) when multiple nerve fibers are stimulated simultaneously. Unlike a single-fiber action potential, the CAP represents the algebraic sum of all individual action potentials firing at roughly the same time. The distinct conduction velocities of different fiber classes cause them to arrive at the recording electrode at different times, producing multiple peaks on the recorded waveform.
- Eric Kandel, Principles of Neural Science, 6th ed., p. 460
Why Multiple Peaks Form
When a nerve trunk is electrically stimulated:
- All fibers above threshold fire (all-or-none law applies to each fiber individually)
- Large, heavily myelinated fibers conduct fastest and arrive first
- Smaller, lightly myelinated and unmyelinated fibers arrive progressively later
- Each group of fibers "clusters" into a distinct wave or peak on the recording
The shape and size of each peak reflect the number and diameter of fibers in that population.
Fiber Classification and CAP Peaks
The Erlanger-Gasser classification (A, B, C) applies to both sensory and motor fibers. The Lloyd-Hunt system (I-IV) applies to sensory fibers only.
| Fiber | Diameter (μm) | Conduction Velocity (m/s) | Myelination | Modality |
|---|---|---|---|---|
| Aα | 15-20 | 80-120 | Yes | Large motor, proprioception |
| Aβ | 8-15 | 30-70 | Yes | Touch, pressure |
| Aγ | 4-8 | 30-70 | Yes | Muscle spindle (intrafusal), reflex |
| Aδ | 3-4 | 10-30 | Yes | Temperature, sharp (fast) pain |
| B | 3-4 | 10-15 | Yes (lightly) | Preganglionic autonomic |
| C | 1-2 | 1-2 | No | Slow/burning pain, postganglionic autonomic |
- Campbell's Operative Orthopaedics, 15th ed., eTable 46.1
- Costanzo Physiology, 7th ed., Table 3.1
Key formula for conduction velocity:
- Large myelinated fibers: velocity (m/s) ≈ 6 × diameter (μm)
- Thinly myelinated: ≈ 5 × diameter
- Unmyelinated: ≈ 1.5-2.5 × diameter
The Classic CAP Waveform (Erlanger and Gasser, 1938)
The diagram below (from Kandel's Principles of Neural Science) shows how increasing stimulus intensity recruits successive fiber populations:
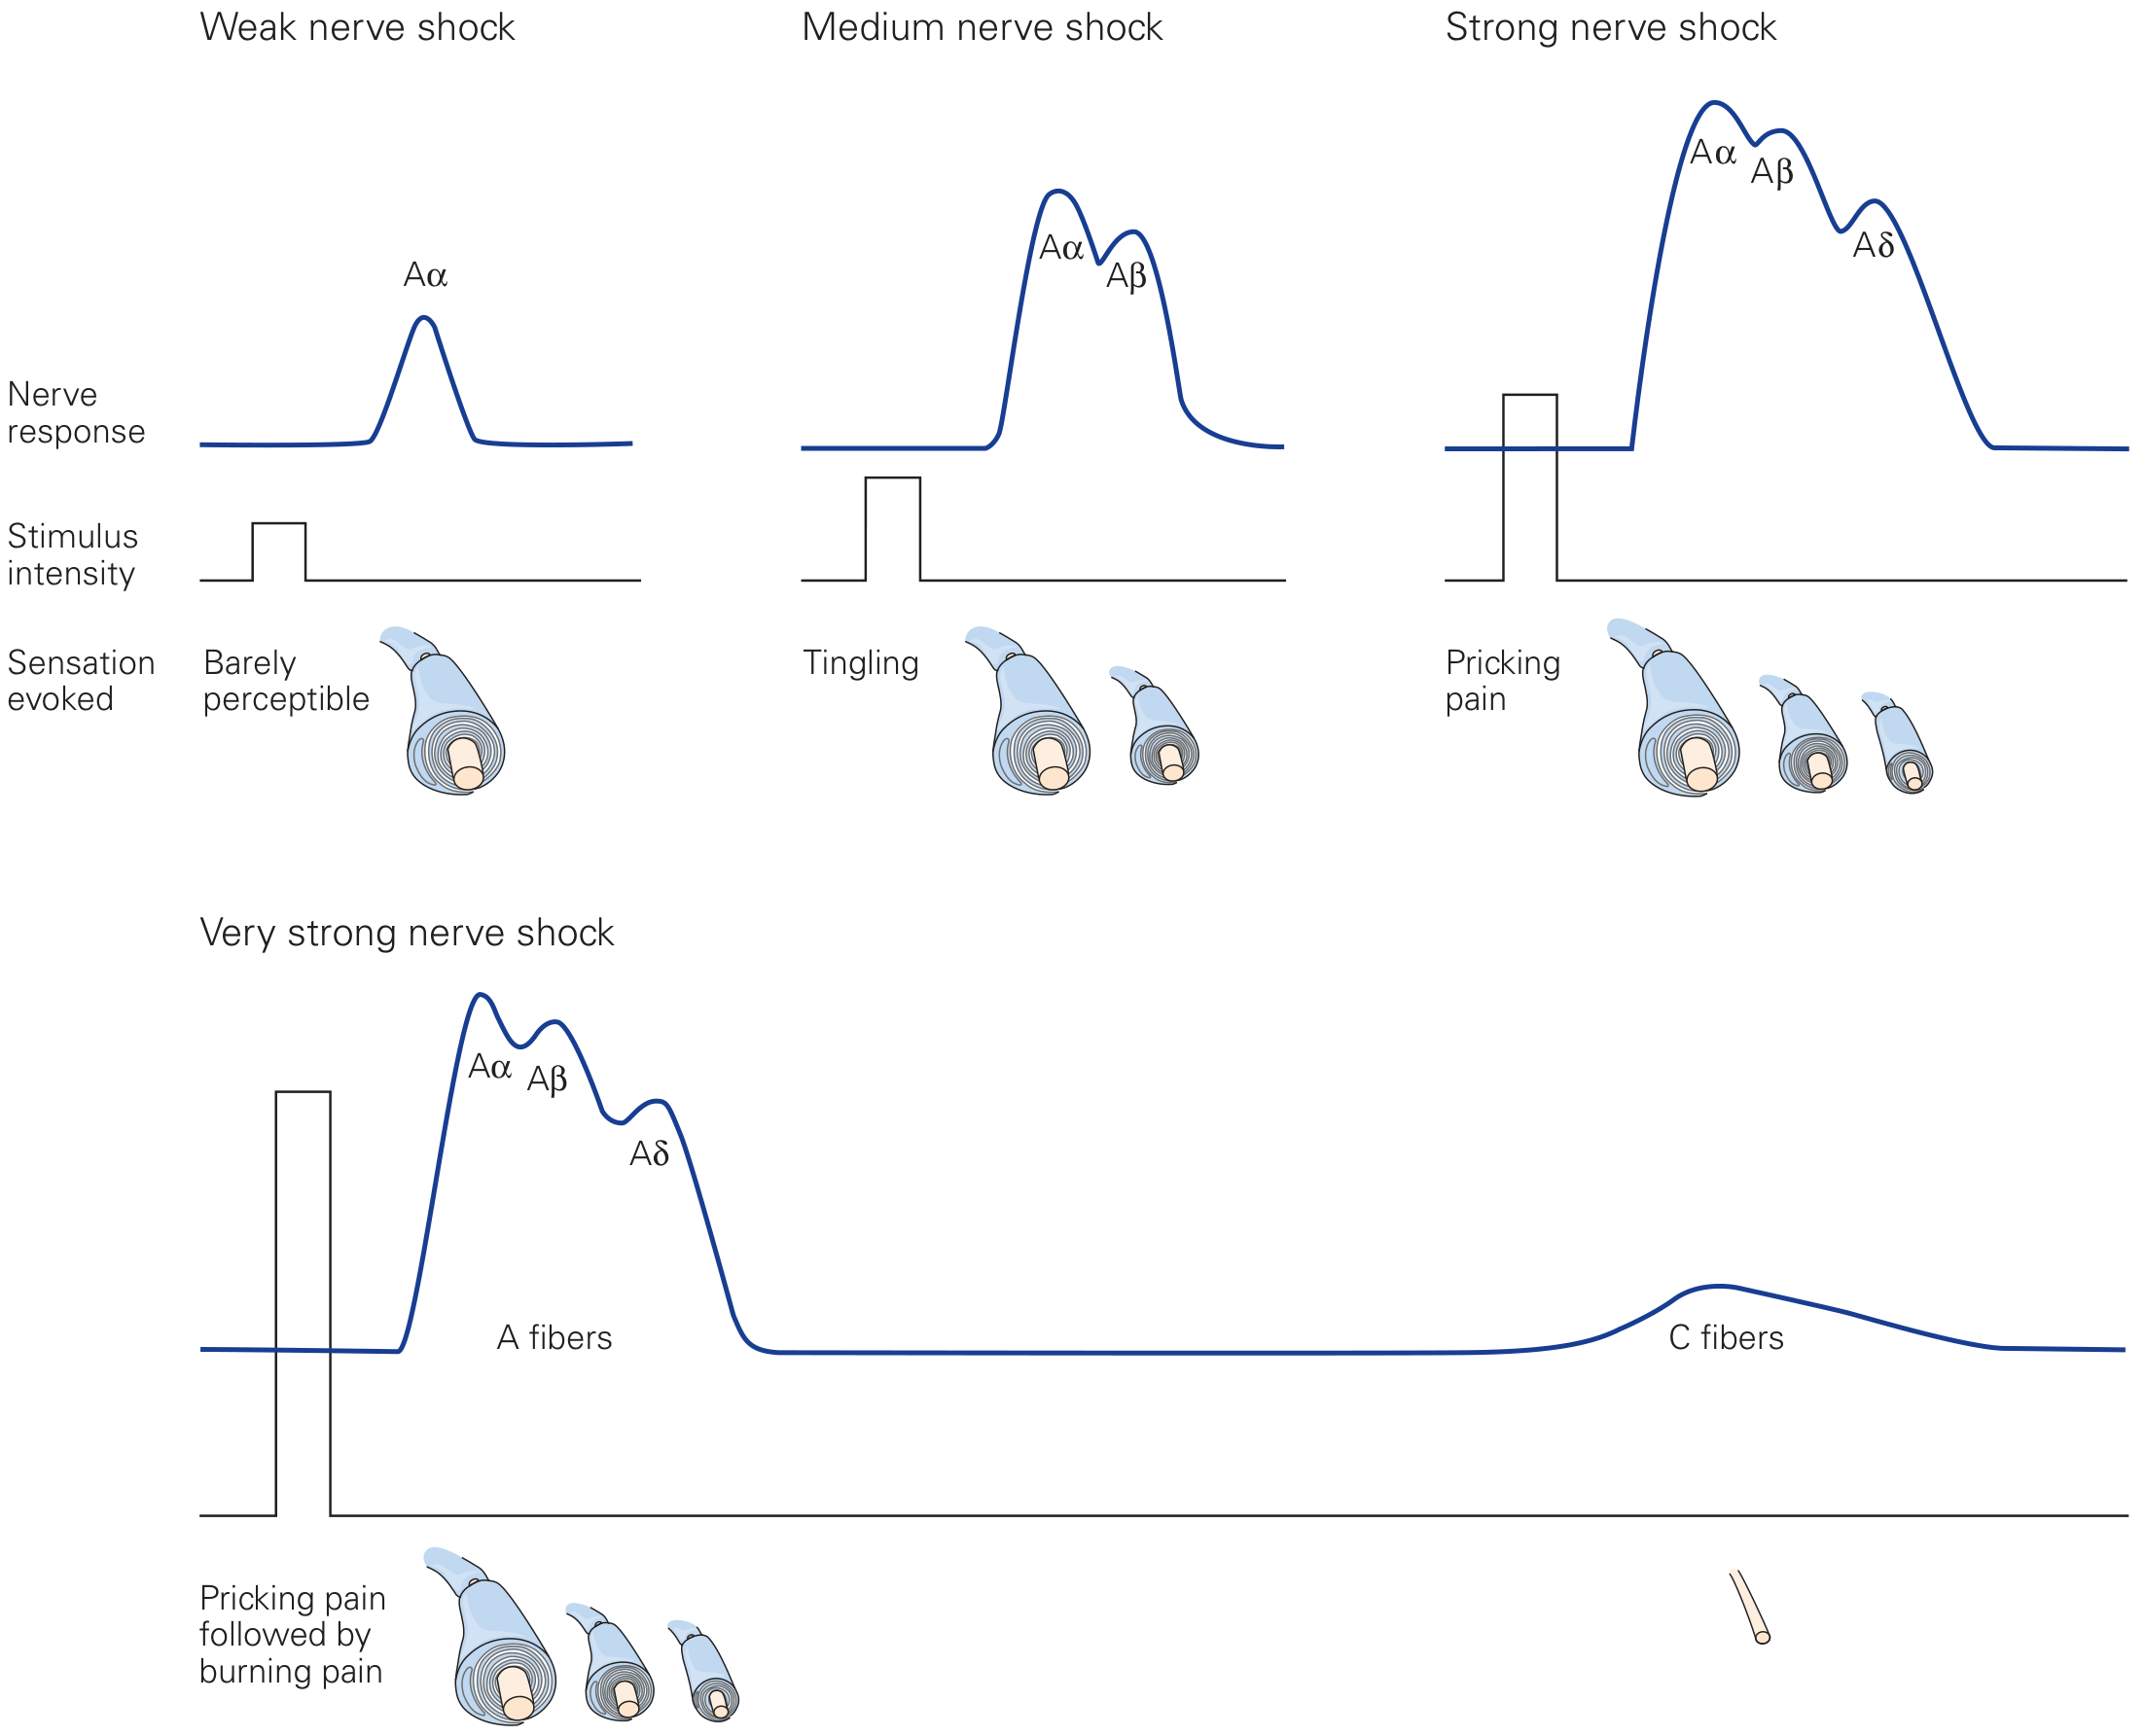
- Weak shock - Only Aα fibers activated → single early peak; sensation barely perceptible
- Medium shock - Aα + Aβ recruited → two peaks; sensation is tingling
- Strong shock - Aα + Aβ + Aδ → three peaks; pricking pain
- Very strong shock - All A fibers + C fibers → the late broad C-fiber hump appears; pricking pain followed by burning pain
Sensations Corresponding to Each Wave
| CAP Peak | Fiber | Sensation |
|---|---|---|
| Aα (earliest) | Group I / motor | Proprioception, motor |
| Aβ | Group II | Touch, pressure, vibration |
| Aγ | Intrafusal motor | Usually indistinct (overlaps Aβ/Aδ range) |
| Aδ | Group III | Sharp, fast, pricking pain; cold |
| C (latest, broad) | Group IV | Burning, slow, dull pain; warmth |
- Kandel, Principles of Neural Science, 6th ed., pp. 460-461
Compound Muscle Action Potential (CMAP)
In clinical nerve conduction studies, the recording is made over a muscle rather than a nerve trunk - this is the CMAP (compound muscle action potential). Key points:
-
Amplitude (in millivolts) reflects the number of functional motor axons and the innervated muscle volume; reduced amplitude = axonal loss
-
Latency to CMAP onset = basis for calculating motor nerve conduction velocity
-
Motor NCV = distance between two stimulation sites ÷ difference in latencies
-
Normal motor NCV: 40-75 m/s (slower in legs than arms; lower in infants, normalized by age 2-4 years; reduced with cold)
-
Demyelinating lesions reduce peak amplitude and slow conduction (differential arrival times); axonal loss reduces amplitude more specifically
-
Adams and Victor's Principles of Neurology, 12th ed., p. 51
CAP in the Auditory System (Electrocochleography)
In the context of auditory testing (ECoG), the CAP has a specific meaning:
-
A transient response at the onset of a click stimulus
-
Reflects synchronous firing of auditory nerve fibers (8th nerve)
-
Appears as negative deflections N1 and N2, synonymous with waves I and II of the ABR
-
The SP/AP ratio is used in diagnosis of Ménière disease: >50% (TIPtrode) or >35% (Tymptrode) is abnormal
-
Electrically evoked CAP (ECAP) is used in cochlear implant recipients via Neural Response Telemetry (NRT)
-
K.J. Lee's Essential Otolaryngology
Clinical Significance of CAP Analysis
| Finding | Interpretation |
|---|---|
| Reduced Aα/Aβ peak, slowed velocity | Diabetic neuropathy (large-fiber degeneration) |
| Slowed/absent conduction | Multiple sclerosis (central myelin loss) |
| Selective peak loss | Identifies which fiber class is affected |
| Low CMAP amplitude | Axonal loss (e.g., motor neuron disease) |
| Normal amplitude, prolonged latency | Demyelination |
- Kandel, Principles of Neural Science, 6th ed., p. 461
- Adams and Victor's Principles of Neurology, 12th ed., p. 51
Differential Sensitivity to Local Anesthetics
Fiber size also determines susceptibility to local anesthetic block - smaller fibers are blocked at lower concentrations:
- B and C fibers blocked first (0.25-0.5% concentration)
- Aδ blocked next (0.5%)
- Aβ/Aγ blocked next
- Aα (large motor) blocked last (requires 1%)
This is the physiological basis of differential spinal blockade - sympathetic block precedes sensory, which precedes motor block.
- Campbell's Operative Orthopaedics, 15th ed., eTable 46.1
Strength duration curve
A quick overview before pulling from the textbooks:
The strength-duration (S-D) curve plots the minimum stimulus intensity (strength) needed to excite a nerve or muscle against the duration of that stimulus pulse. Two key parameters define the curve: rheobase (the minimum current needed with an infinitely long pulse) and chronaxie (the pulse duration needed when stimulus strength = 2x rheobase). Denervated muscle has a shifted, flatter curve compared to normal nerve/muscle.
Searching sources...
Finding Sources
Finding Sources
Searching Images
strength duration curve rheobase chronaxie nerve muscle
Good hits. Now reading the core physiology content from Medical Physiology and Ganong's:
Reading File
Reading File
Reading File
Excellent. Let me fetch the S-D curve image from Medical Physiology and also search for more on denervated muscle / accommodation:
Loading Image
Finding Sources
Let me search specifically for denervation, accommodation, and the pacemaker-related S-D curve image:
Finding Sources
Reading File
Reading File
I have the pacemaker S-D curve image URL. Let me fetch it and also get more detail on accommodation and denervation from Campbell's and Ganong's:
Loading Image
Reading File
I have all the material needed for a thorough answer. Here it is:
Strength-Duration (S-D) Curve
Definition
The strength-duration curve plots the minimum stimulus intensity (strength, y-axis) required to just excite a nerve or muscle against the duration of that stimulus pulse (x-axis). It is a threshold curve - any stimulus falling on or above it will generate an action potential; any below it will not.
The fundamental principle underlying the curve is:
It is the product of strength × duration (i.e., charge = current × time) that determines excitability. Therefore, strength and duration are inversely related - a brief strong pulse and a long weak pulse can both be at threshold.
- Medical Physiology (Boron & Boulpaep), p. 275
The Curve
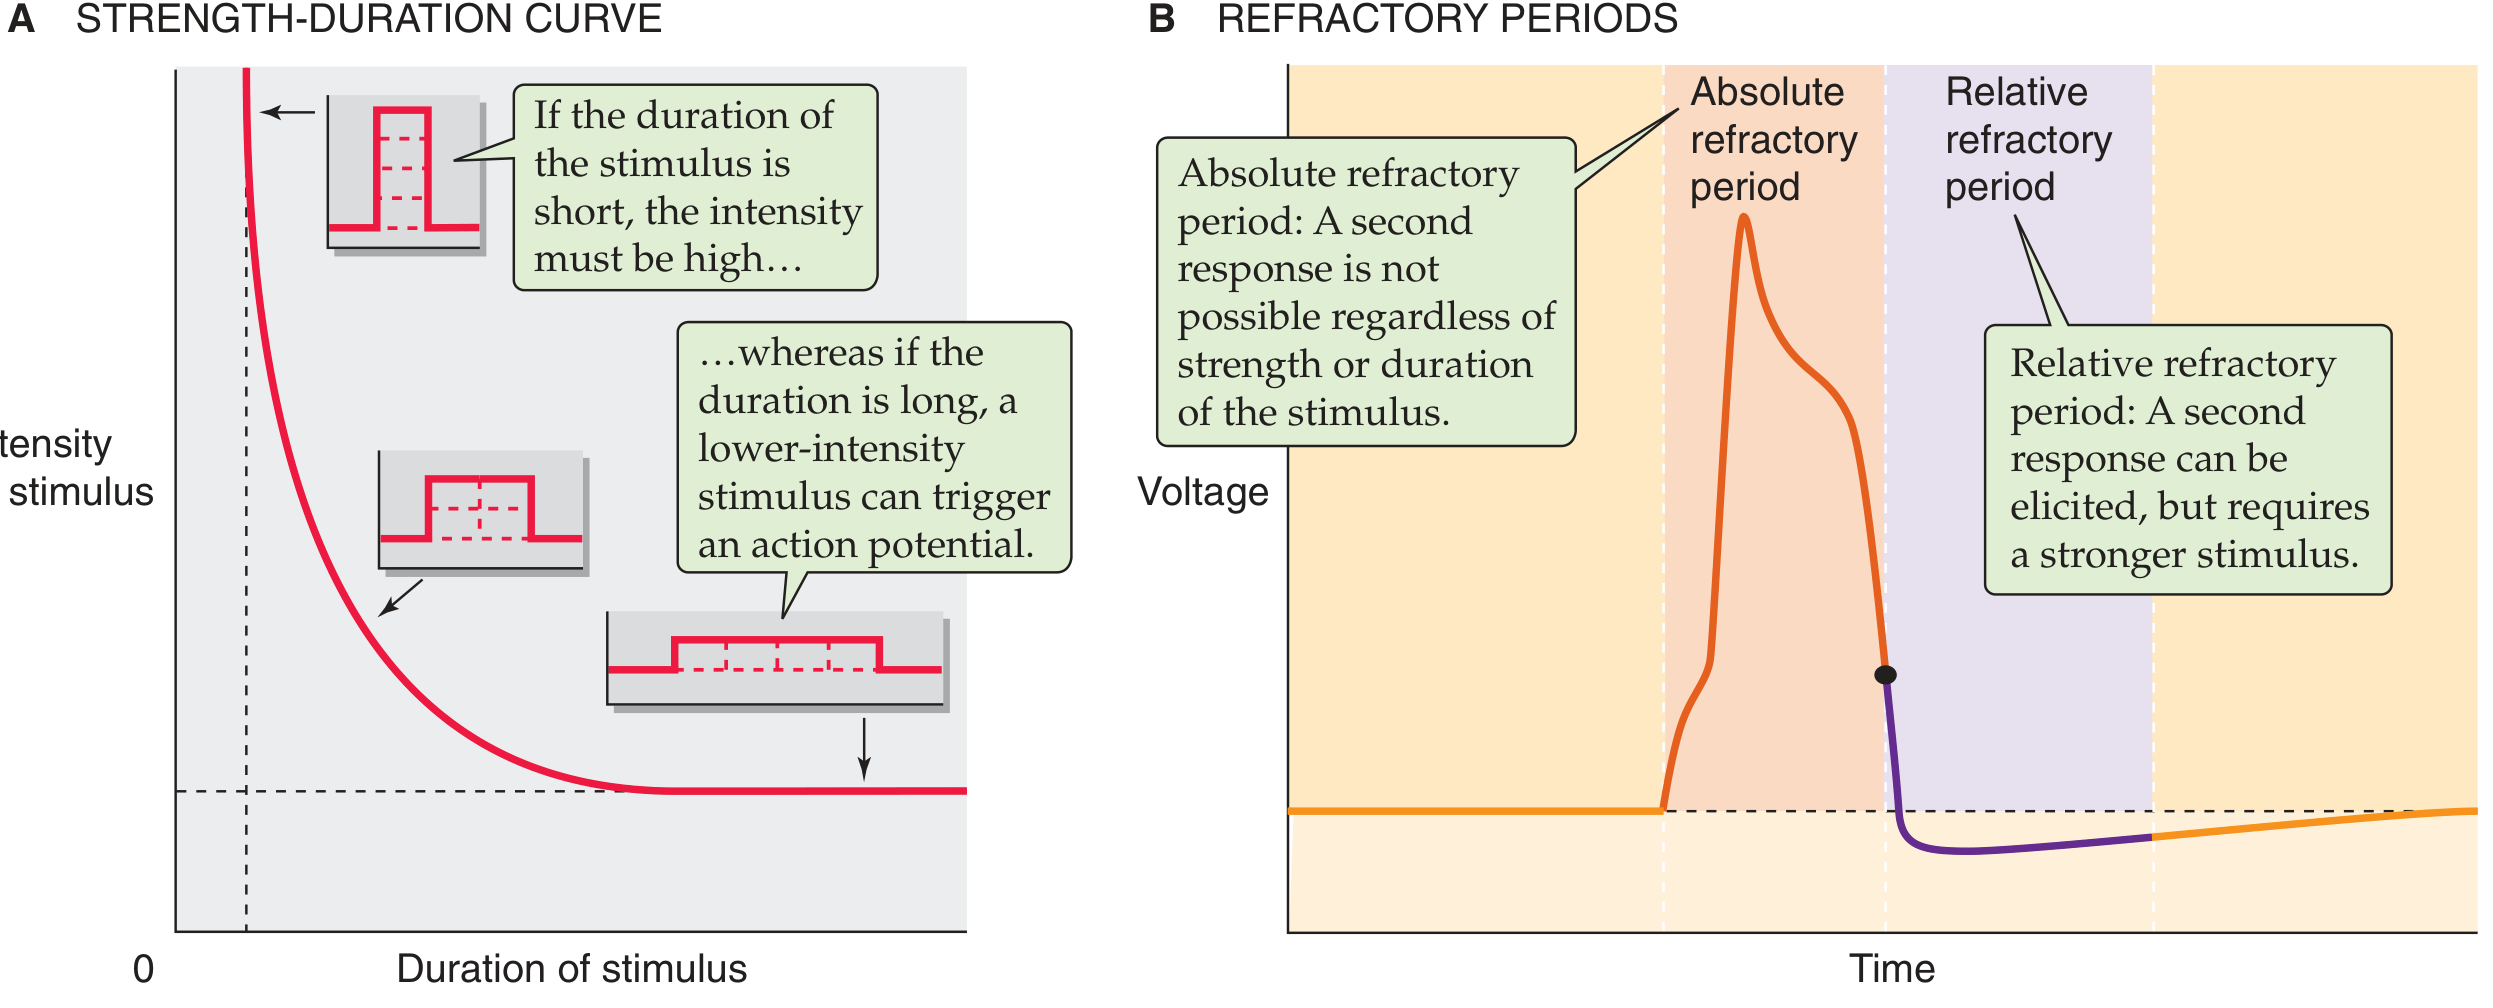
The curve is a rectangular hyperbola with two asymptotes:
- Horizontal asymptote (x-axis side): No matter how long the stimulus duration, there is a minimum intensity below which stimulation will never succeed - this is the rheobase
- Vertical asymptote (y-axis side): No matter how strong the stimulus, there is a minimum duration below which stimulation will never succeed - this is the utilization time (or minimum duration)
Key Parameters
1. Rheobase
- The minimum current (or voltage) that can just excite the tissue when the pulse duration is infinitely long (practically estimated at ~1.5-2.0 ms in pacemaker studies)
- Represents the horizontal asymptote of the S-D curve
- Units: milliamps (mA) or volts (V)
- Physiologically: the smallest sustained depolarization that can bring the membrane to threshold
2. Chronaxie
- The pulse duration required to excite the tissue when stimulus strength = 2 × rheobase
- A measure of the excitability of the tissue - shorter chronaxie = more excitable
- Units: milliseconds (ms)
- Clinical significance: chronaxie is the most practically useful parameter because it falls near the "knee" of the curve where the energy cost of stimulation is most efficient
3. Utilization Time (Minimum Duration)
-
The minimum pulse duration below which no stimulus - regardless of strength - can excite the tissue
-
Forms the vertical asymptote of the S-D curve
-
Medical Physiology (Boron & Boulpaep), N7-2, p. 277
-
Ganong's Review of Medical Physiology, 26th ed., p. 101
Pacemaker S-D Curve
The strength-duration relationship is of direct practical importance in cardiac pacing:
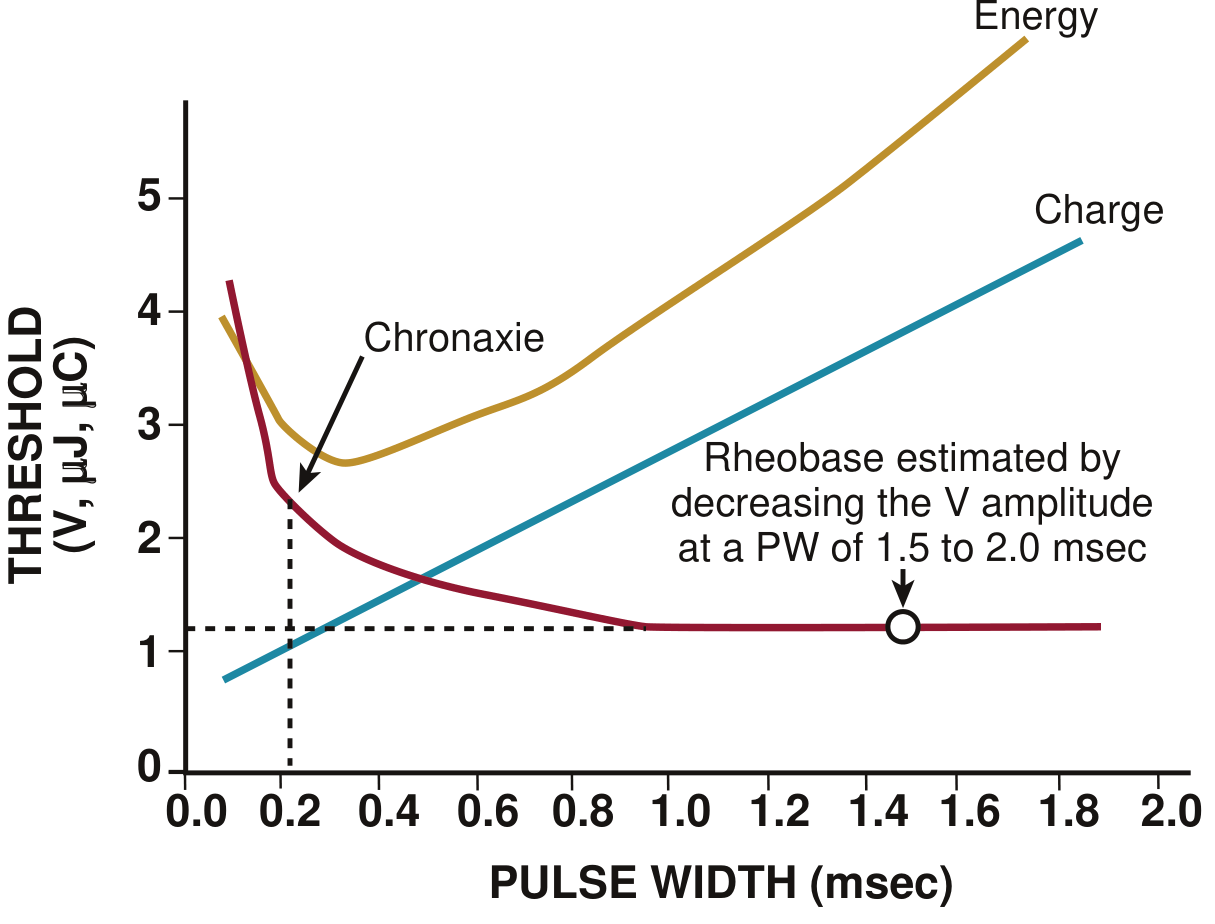
-
Capture occurs above and to the right of the S-D curve
-
Rheobase is estimated at pulse widths of 1.5-2.0 ms
-
At very short pulse widths (<0.1-0.2 ms), the curve rises steeply - increasing voltage is ineffective
-
The energy curve (gold) is U-shaped: minimum energy is consumed near the chronaxie
-
The charge curve (blue) increases linearly with pulse width
-
Optimal pacing: set pulse width near chronaxie for the best balance of safety margin and battery efficiency
-
Braunwald's Heart Disease, 2-Vol Set, p. 590 (Fig. 69.8)
Accommodation (Adaptation)
A key property of excitable tissue related to the S-D curve:
Slowly rising stimuli fail to trigger an action potential even if their final intensity exceeds the threshold predicted by the S-D curve.
This is called accommodation. As current rises slowly, Na⁺ channels partially inactivate progressively (h-gate closes) before the membrane reaches threshold, so the threshold rises faster than the stimulus. The result: a slow ramp stimulus is less effective than a rectangular pulse of the same peak intensity.
This is why the S-D curve is measured with rectangular (square) pulses - they rise instantaneously, giving no time for accommodation.
- Ganong's Review of Medical Physiology, 26th ed., p. 101
Normal vs. Denervated Muscle: Diagnostic Use
The S-D curve shifts characteristically after nerve injury, making it a useful early diagnostic tool:
| Parameter | Normal (Innervated) | Denervated Muscle |
|---|---|---|
| Chronaxie | Short (~0.1-1 ms) | Prolonged (10-100 ms) |
| Rheobase | Lower | Higher (raised) |
| Curve shape | Steep, shifts to the left | Flat, shifted right |
| Response to faradic | Present | Absent (after ~3 weeks) |
| Response to galvanic | Present | Present (sluggish) |
-
After nerve injury, denervated muscle loses the fast-conducting nerve input. Muscle membrane is less excitable (higher rheobase, longer chronaxie) and cannot be activated by short pulses
-
The curve shifts to the right and upward
-
As reinnervation occurs, the curve gradually returns toward normal - the S-D curve can track recovery before voluntary contraction returns
-
Galvanic (DC) stimulation is used to plot the S-D curve; faradic (AC/short pulse) stimulation specifically tests for nerve-mediated response
-
Campbell's Operative Orthopaedics, 15th ed.
Factors That Affect the S-D Curve / Excitability
| Factor | Effect on Excitability | Effect on Curve |
|---|---|---|
| Decreased extracellular Ca²⁺ | Increased | Shifts left (lower threshold) |
| Increased extracellular Ca²⁺ | Decreased | Shifts right (higher threshold) |
| Hyperkalemia | Increased (initially), then decreased | Complex |
| Local anesthetics | Decreased | Shifts right, chronaxie prolonged |
| Denervation | Decreased | Right shift, prolonged chronaxie |
| Reinnervation | Restored | Returns to normal |
Summary Points
- S-D curve = rectangular hyperbola; strength and duration are inversely related
- Rheobase = minimum current for infinite duration (horizontal asymptote)
- Chronaxie = pulse width at 2× rheobase; inversely proportional to excitability
- Utilization time = minimum duration (vertical asymptote)
- Accommodation = slowly rising stimuli are less effective due to Na⁺ channel inactivation
- Denervation shifts the curve right and prolongs chronaxie - detected earlier than clinical signs
- Optimal stimulation (and pacing) occurs near the chronaxie for minimum energy cost
This is a shared conversation. Sign in to Orris to start your own chat.