What is tumor? Write the differences between benign and malignant with 20 points.
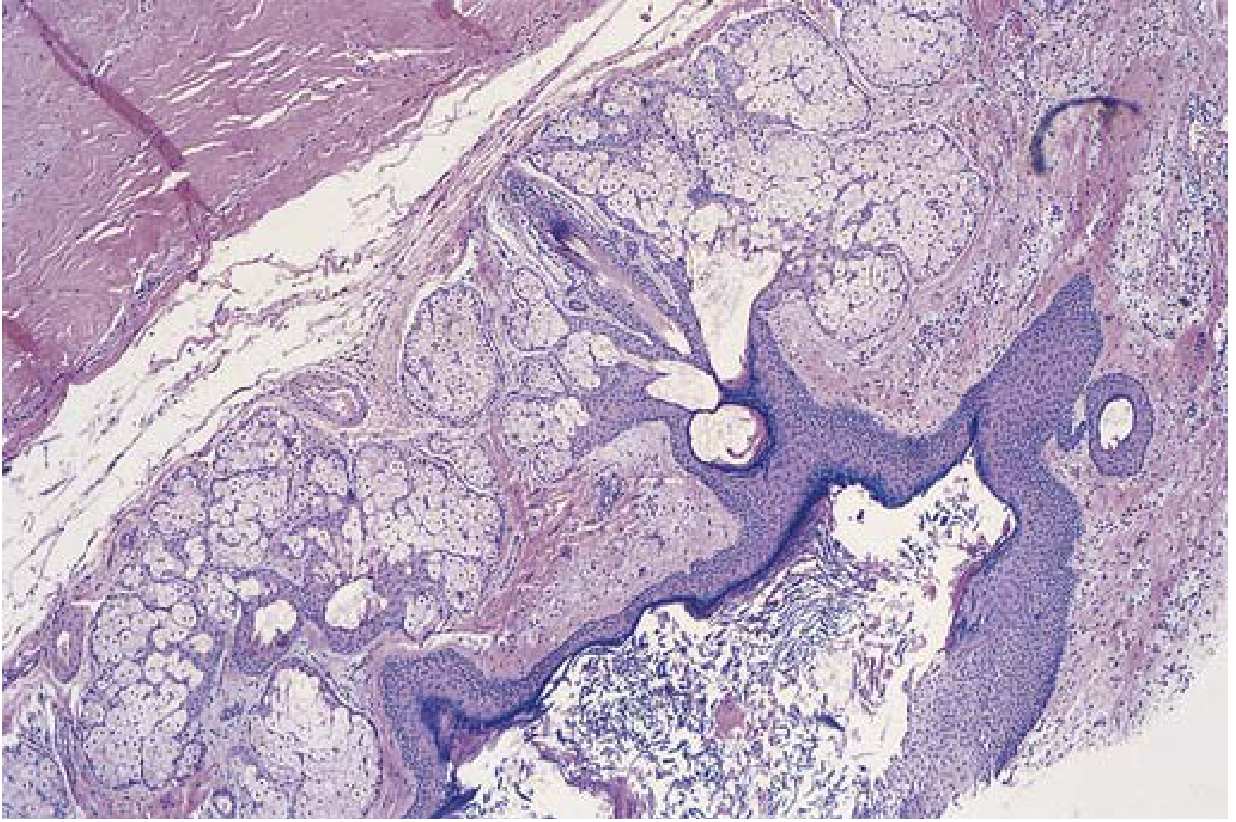
benign vs malignant tumor comparison histology
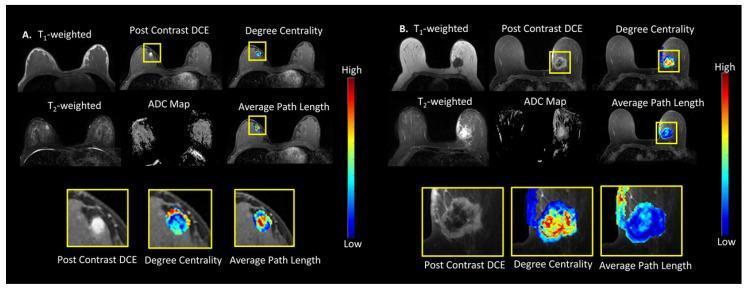
This Comparison Chart illustrates multiparametric breast MRI (mpMRI) and tumor connectomics for a benign vs. malignant lesion. Panel (A) displays a benign fibroadenomatous change in a 27-year-old female, characterized by a small, well-defined lesion with high ADC (1.54 × 10⁻³ mm²/s) and homogeneous signal on T1-weighted and Post-Contrast DCE images. Panel (B) shows an infiltrating ductal carcinoma in a 56-year-old female, featuring a larger, irregular mass with restricted diffusion (ADC 0.68 × 10⁻³ mm²/s) and heterogeneous enhancement. The images include T1-weighted, T2-weighted, Post-Contrast Dynamic Contrast-Enhanced (DCE), and Apparent Diffusion Coefficient (ADC) maps. Integrated Tumor Connectomics Framework (TCF) maps overlay 'Degree Centrality' and 'Average Path Length' metrics using a colorimetric scale (blue = low, red = high). The malignant lesion demonstrates significantly different network topography, with larger, more diffuse areas of varying centrality and altered average path length compared to the focal patterns seen in the benign lesion, highlighting the use of graph theoretic metrics in oncological imaging and diagnostic radiology.
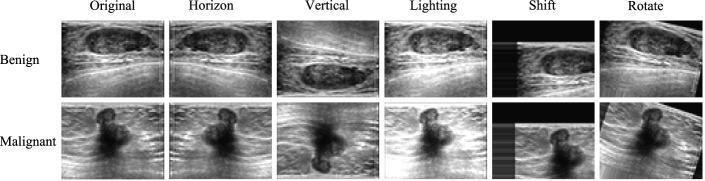
A comparison chart showing breast ultrasound (BUS) images of benign and malignant tumors, demonstrating various data augmentation techniques for deep learning models. The chart is organized into two rows (Benign and Malignant) and six columns representing different image states: Original, Horizon (horizontal flip), Vertical (vertical flip), Lighting (brightness adjustment), Shift (spatial translation with padding), and Rotate. The 'Original' benign tumor is characterized by an oval, circumscribed shape with smooth margins and a relatively homogeneous internal echotexture. In contrast, the 'Original' malignant tumor demonstrates an irregular, non-parallel orientation (taller-than-wide) with spiculated or angular margins and significant internal heterogeneity, indicating potential infiltration. Each augmentation column illustrates how the visual features are transformed: 'Horizon' and 'Vertical' flips change the spatial orientation, 'Lighting' modifies the echogenicity contrast, 'Shift' introduces black-masked boundaries, and 'Rotate' alters the lesion's angle relative to the transducer plane. This educational visual is designed to showcase how varied data inputs help train neural networks like Fus2Net for robust clinical diagnostic classification.
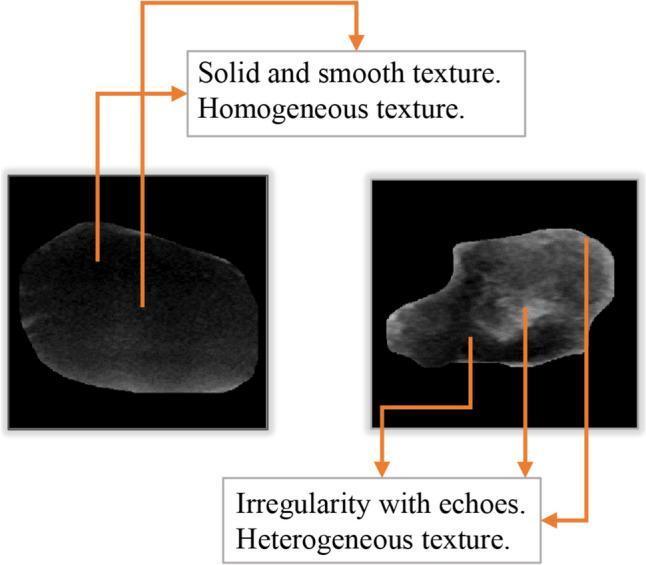
This Comparison Chart illustrates the distinguishing diagnostic features of benign and malignant breast tumors using ultrasound imaging. The image is divided into two clinical diagnostic frames. On the left, a benign tumor is presented, characterized by a regular, rounded boundary, a solid and smooth texture, and a homogeneous internal echo pattern. On the right, a malignant tumor is displayed, demonstrating key pathological indicators including highly irregular, branching boundaries and a heterogeneous internal texture. Orange arrows and labels highlight the 'internal echoes' and 'irregularity' present in the malignant mass compared to the 'homogeneous' and 'smooth' appearance of the benign lesion. This visual serves as an educational tool for medical training in breast imaging and radiology, specifically focusing on morphological features such as solidity and echogenicity used to differentiate tumor types. The material is relevant for oncology and diagnostic imaging specialties at an intermediate learning level.
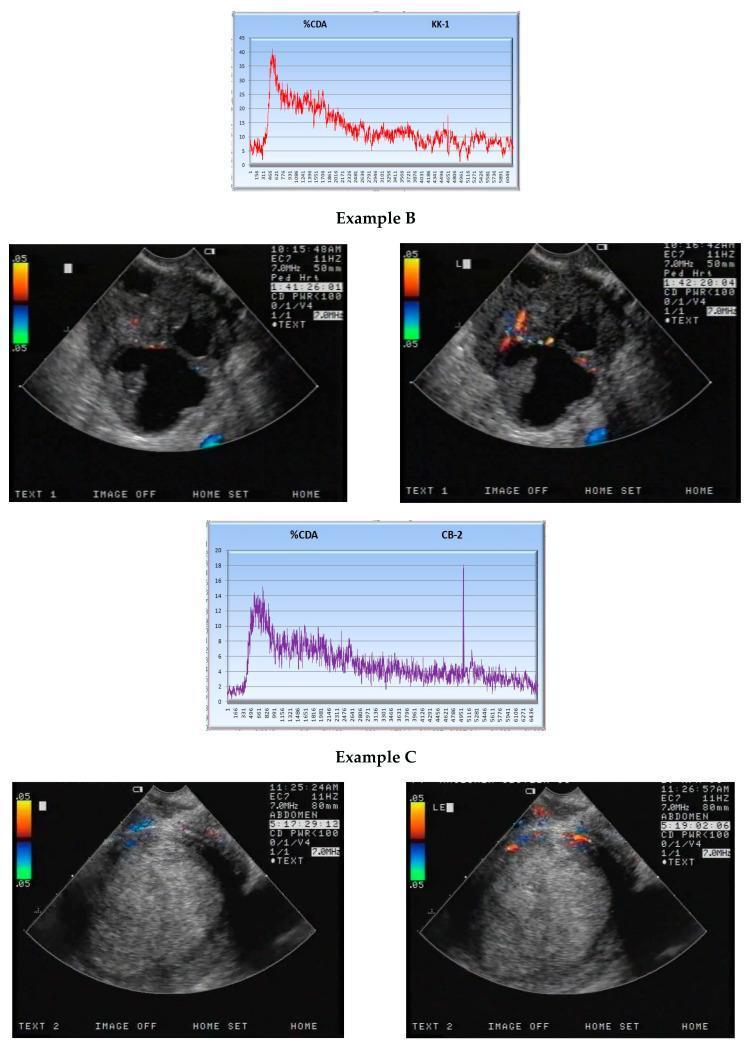
Contrast-Enhanced Ultrasound (CEUS) comparison panels illustrating diagnostic features of malignant versus benign lesions. The image is divided into Example B (malignant) and Example C (benign). Each panel consists of a quantitative %CDA (Computerized Digital Analysis) time-intensity curve above dual-view ultrasound images showing pre-contrast and peak enhancement phases. Example B (top) displays a malignant lesion with a high-amplitude %CDA curve reaching a peak (Ymax) near 40 units, characterized by an aggressive washout phase; the corresponding sonograms show heterogeneous peripheral enhancement. Example C (bottom) displays a benign lesion with a significantly lower %CDA peak (Ymax) near 14 units and a more stable, lower-intensity enhancement pattern. The ultrasound displays include technical parameters: 7.0 MHz frequency, 50-80mm depth, and CD PWR < 100. This graphic demonstrates the clinical utility of quantitative CEUS analysis in differentiating tumor pathology based on vascular perfusion kinetics and contrast agent distribution over time.
What is a Tumor?
- Parenchyma - the proliferating neoplastic cells that determine the tumor's behavior and name
- Stroma - the supporting connective tissue, blood vessels, and immune cells that the tumor recruits from the host
20 Differences Between Benign and Malignant Tumors
| # | Feature | Benign | Malignant |
|---|---|---|---|
| 1 | Definition | Non-cancerous tumor; cells overgrow but do not invade or spread | Cancerous tumor; cells invade locally and can spread to distant sites |
| 2 | Differentiation | Well differentiated - cells closely resemble the normal tissue of origin | Poorly or undifferentiated (anaplastic) - cells bear little resemblance to normal counterparts |
| 3 | Anaplasia | Absent; cells are mature and well organized | Often present; cells show loss of structural and functional differentiation |
| 4 | Rate of Growth | Slow growing; mitoses rare | Often rapid; mitotic activity is high (though some malignancies can grow slowly) |
| 5 | Mitotic Figures | Rare, normal configuration | Numerous; atypical (tripolar, quadripolar spindles) mitotic figures are common |
| 6 | Nuclear Features | Normal nuclear-cytoplasmic (N:C) ratio; uniform nuclei | High N:C ratio; nuclear hyperchromatism, pleomorphism, prominent nucleoli |
| 7 | Cell Pleomorphism | Absent or minimal - cells uniform in size and shape | Present - marked variation in cell and nuclear size and shape |
| 8 | Capsule | Usually encapsulated by a fibrous capsule; well circumscribed | No true capsule; poorly circumscribed, infiltrative borders |
| 9 | Borders / Margins | Well-defined, smooth, pushing margins | Irregular, infiltrative, spiculated margins |
| 10 | Local Invasion | Absent; grows by expansion and compresses surrounding tissue | Present - invades and destroys adjacent normal tissues; does not respect anatomic boundaries |
| 11 | Metastasis | Does NOT metastasize (the most defining feature) | CAN metastasize - spread to distant sites via lymphatics, blood vessels, or body cavities |
| 12 | Necrosis | Rarely necrotic; blood supply usually adequate | Central necrosis common due to outgrowing blood supply |
| 13 | Recurrence after removal | Rare; complete surgical excision is usually curative | High recurrence rate; complete excision difficult due to infiltrative growth |
| 14 | Effect on host | Usually localized effects only (compression, obstruction, hormone secretion); rarely fatal | Can cause cachexia, paraneoplastic syndromes, organ failure, death |
| 15 | Prognosis | Excellent; generally curable with surgery | Variable to poor; depends on stage, grade, and histologic type |
| 16 | Stroma / Desmoplasia | Stroma present but no desmoplastic reaction | Many malignant tumors induce a dense fibrous stromal reaction (desmoplasia), making them hard ("scirrhous") |
| 17 | Vascularity | Less vascular; blood supply adequate | Abnormal, abundant vascularity due to angiogenesis (VEGF-driven); vessels are leaky and disorganized |
| 18 | Gross Appearance | Soft, smooth, movable, uniform consistency | Firm, fixed, irregular; may ulcerate through skin or mucosa |
| 19 | Chromosomal Abnormalities | Minimal or absent genetic instability | Genomic instability common; chromosomal rearrangements, deletions, amplifications, point mutations |
| 20 | Naming Convention | Named by tissue of origin + suffix -oma (e.g., lipoma, adenoma, fibroma) | Named with prefixes carcinoma (epithelial), sarcoma (mesenchymal), or blastoma (embryonal); exceptions include lymphoma, melanoma, seminoma |
Histological Examples