
Neimanm algorithm
Neiman algorithm computer science OR statistics
Neyman algorithm optimal allocation stratified sampling
For svt vs vt
Brugada criteria SVT VT wide complex tachycardia ECG algorithm
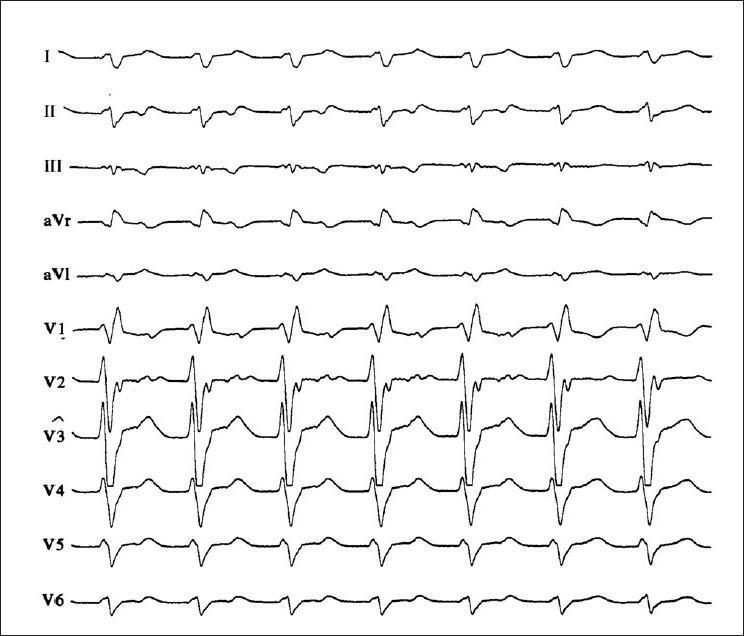
A 12-lead electrocardiogram (ECG) demonstrating monomorphic wide-QRS complex tachycardia. The tracing shows a rapid, regular rhythm with diagnostic features of ventricular tachycardia (VT). Key morphological findings include a Right Bundle Branch Block (RBBB) pattern, specifically characterized by a triphasic (rsR') QRS complex in lead V1 and an R to S ratio of less than 1 in lead V6 (dominant S wave). The axis is oriented toward the 'northwest' quadrant (extreme right axis deviation), visualized as predominantly negative QRS complexes in leads I and aVF. Additionally, evidence of AV dissociation is present, which is a highly specific hallmark for differentiating ventricular tachycardia from supraventricular tachycardia with aberrancy. The precordial leads show a progression from dominant R waves in V1-V4 to dominant S waves in V5-V6. This clinical image serves as an educational example of cardiac arrhythmia diagnosis and the application of Brugada or Vereckei criteria in emergency cardiology.
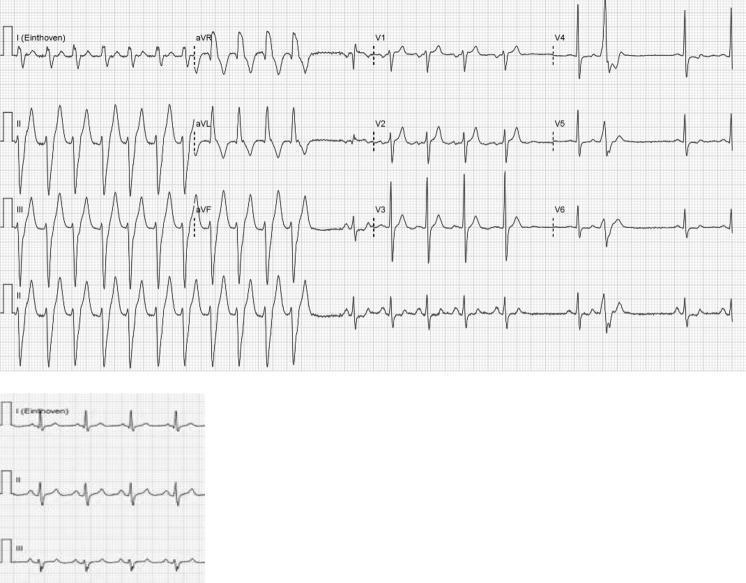
This diagnostic image is a twelve-lead electrocardiogram (ECG) tracing capturing a transition from a wide complex tachycardia to sinus rhythm. The left side of the tracing demonstrates a regular tachycardia with a QRS duration of approximately 146 ms and a rate of 160 bpm. The morphology exhibits a right bundle branch block (RBBB) pattern in V1 and a left axis deviation in the limb leads, suggesting a possible fascicular ventricular tachycardia (VT) or supraventricular tachycardia (SVT) with aberrancy. Following a transition phase, the right side of the tracing shows conversion to a normal sinus rhythm with clearly visible P waves and a significantly narrower QRS complex. The limb leads (I, II, III, aVR, aVL, aVF) and precordial leads (V1-V6) are organized in a standard layout, with a rhythm strip included at the bottom. This ECG illustrates key clinical findings for differentiating ventricular versus supraventricular origins of wide complex tachycardias and demonstrates the effect of therapeutic conversion.
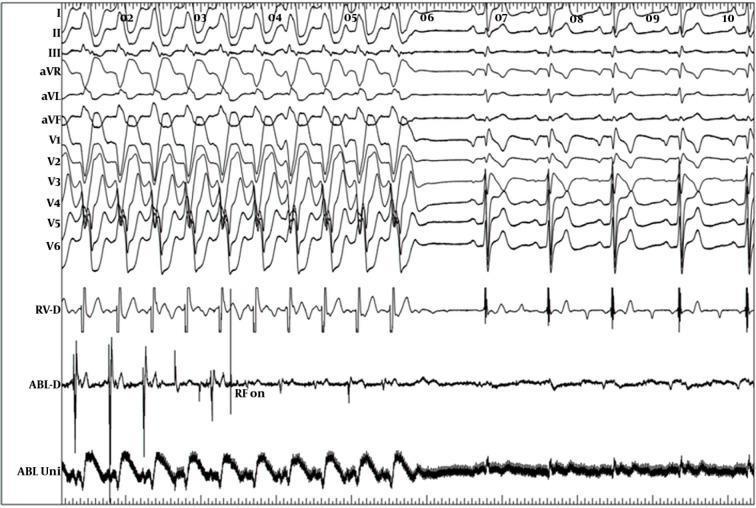
An intracardiac electrogram (EGM) and surface 12-lead electrocardiogram (ECG) recording demonstrating the termination of monomorphic ventricular tachycardia (VT) during an electrophysiology study (EPS). The upper section displays surface leads I, II, III, aVR, aVL, aVF, and V1-V6, showing a wide-complex tachycardia with a left bundle branch block (LBBB) morphology and inferior axis. The lower section includes intracardiac signals from the right ventricle (RV-D) and ablation catheter (ABL-D, ABL Uni). At time point 05, the label 'RF on' indicates the initiation of radiofrequency energy application. Following this intervention, there is a clear transition from the rapid VT rhythm to a slower, more organized rhythm (likely sinus rhythm or a paced rhythm), visible as the widening and subsequent narrowing of QRS complexes on the surface ECG and the stabilization of EGM signals. This visual represents a successful catheter ablation procedure in a patient with suspected Brugada syndrome or arrhythmogenic substrate in the right ventricular outflow tract (RVOT).
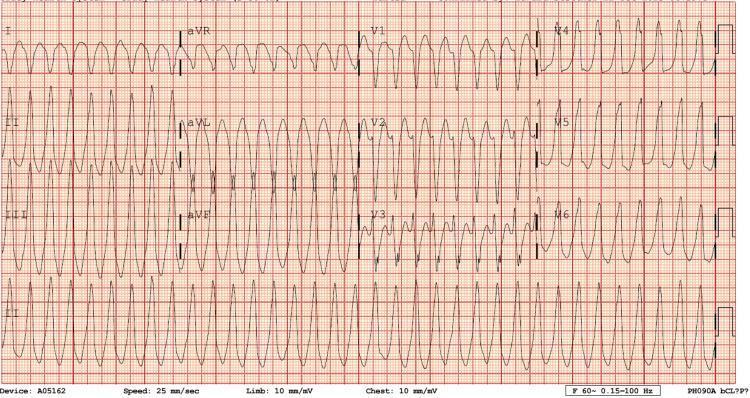
This diagnostic image is a 12-lead electrocardiogram (ECG) demonstrating a regular, monomorphic wide-complex tachycardia (WCT). The ventricular rate is approximately 250 beats per minute, characterized by widened QRS complexes that maintain a consistent morphology across each lead. P waves are not clearly discernible, and there is no obvious evidence of atrioventricular (AV) dissociation on this tracing, making it visually challenging to differentiate between ventricular tachycardia (VT) and supraventricular tachycardia (SVT) with aberrant conduction. Notably, the limb leads aVR and aVL exhibit signs of potential lead reversal, complicating axis determination. The rhythm is monomorphic, suggesting a uniform ventricular depolarization pathway. This ECG is a critical educational example used to illustrate the emergency department presentation of tachyarrhythmias, often requiring clinical correlation and potentially electrical cardioversion. It serves as a teaching tool for advanced cardiac life support (ACLS) and cardiology-level interpretation of life-threatening arrhythmias.
The Brugada Algorithm (Neiman/Neyman Algorithm) - SVT vs VT
This is the most commonly used validated ECG algorithm for this purpose. - Frameworks for Internal Medicine
The Algorithm: 4 Sequential Steps
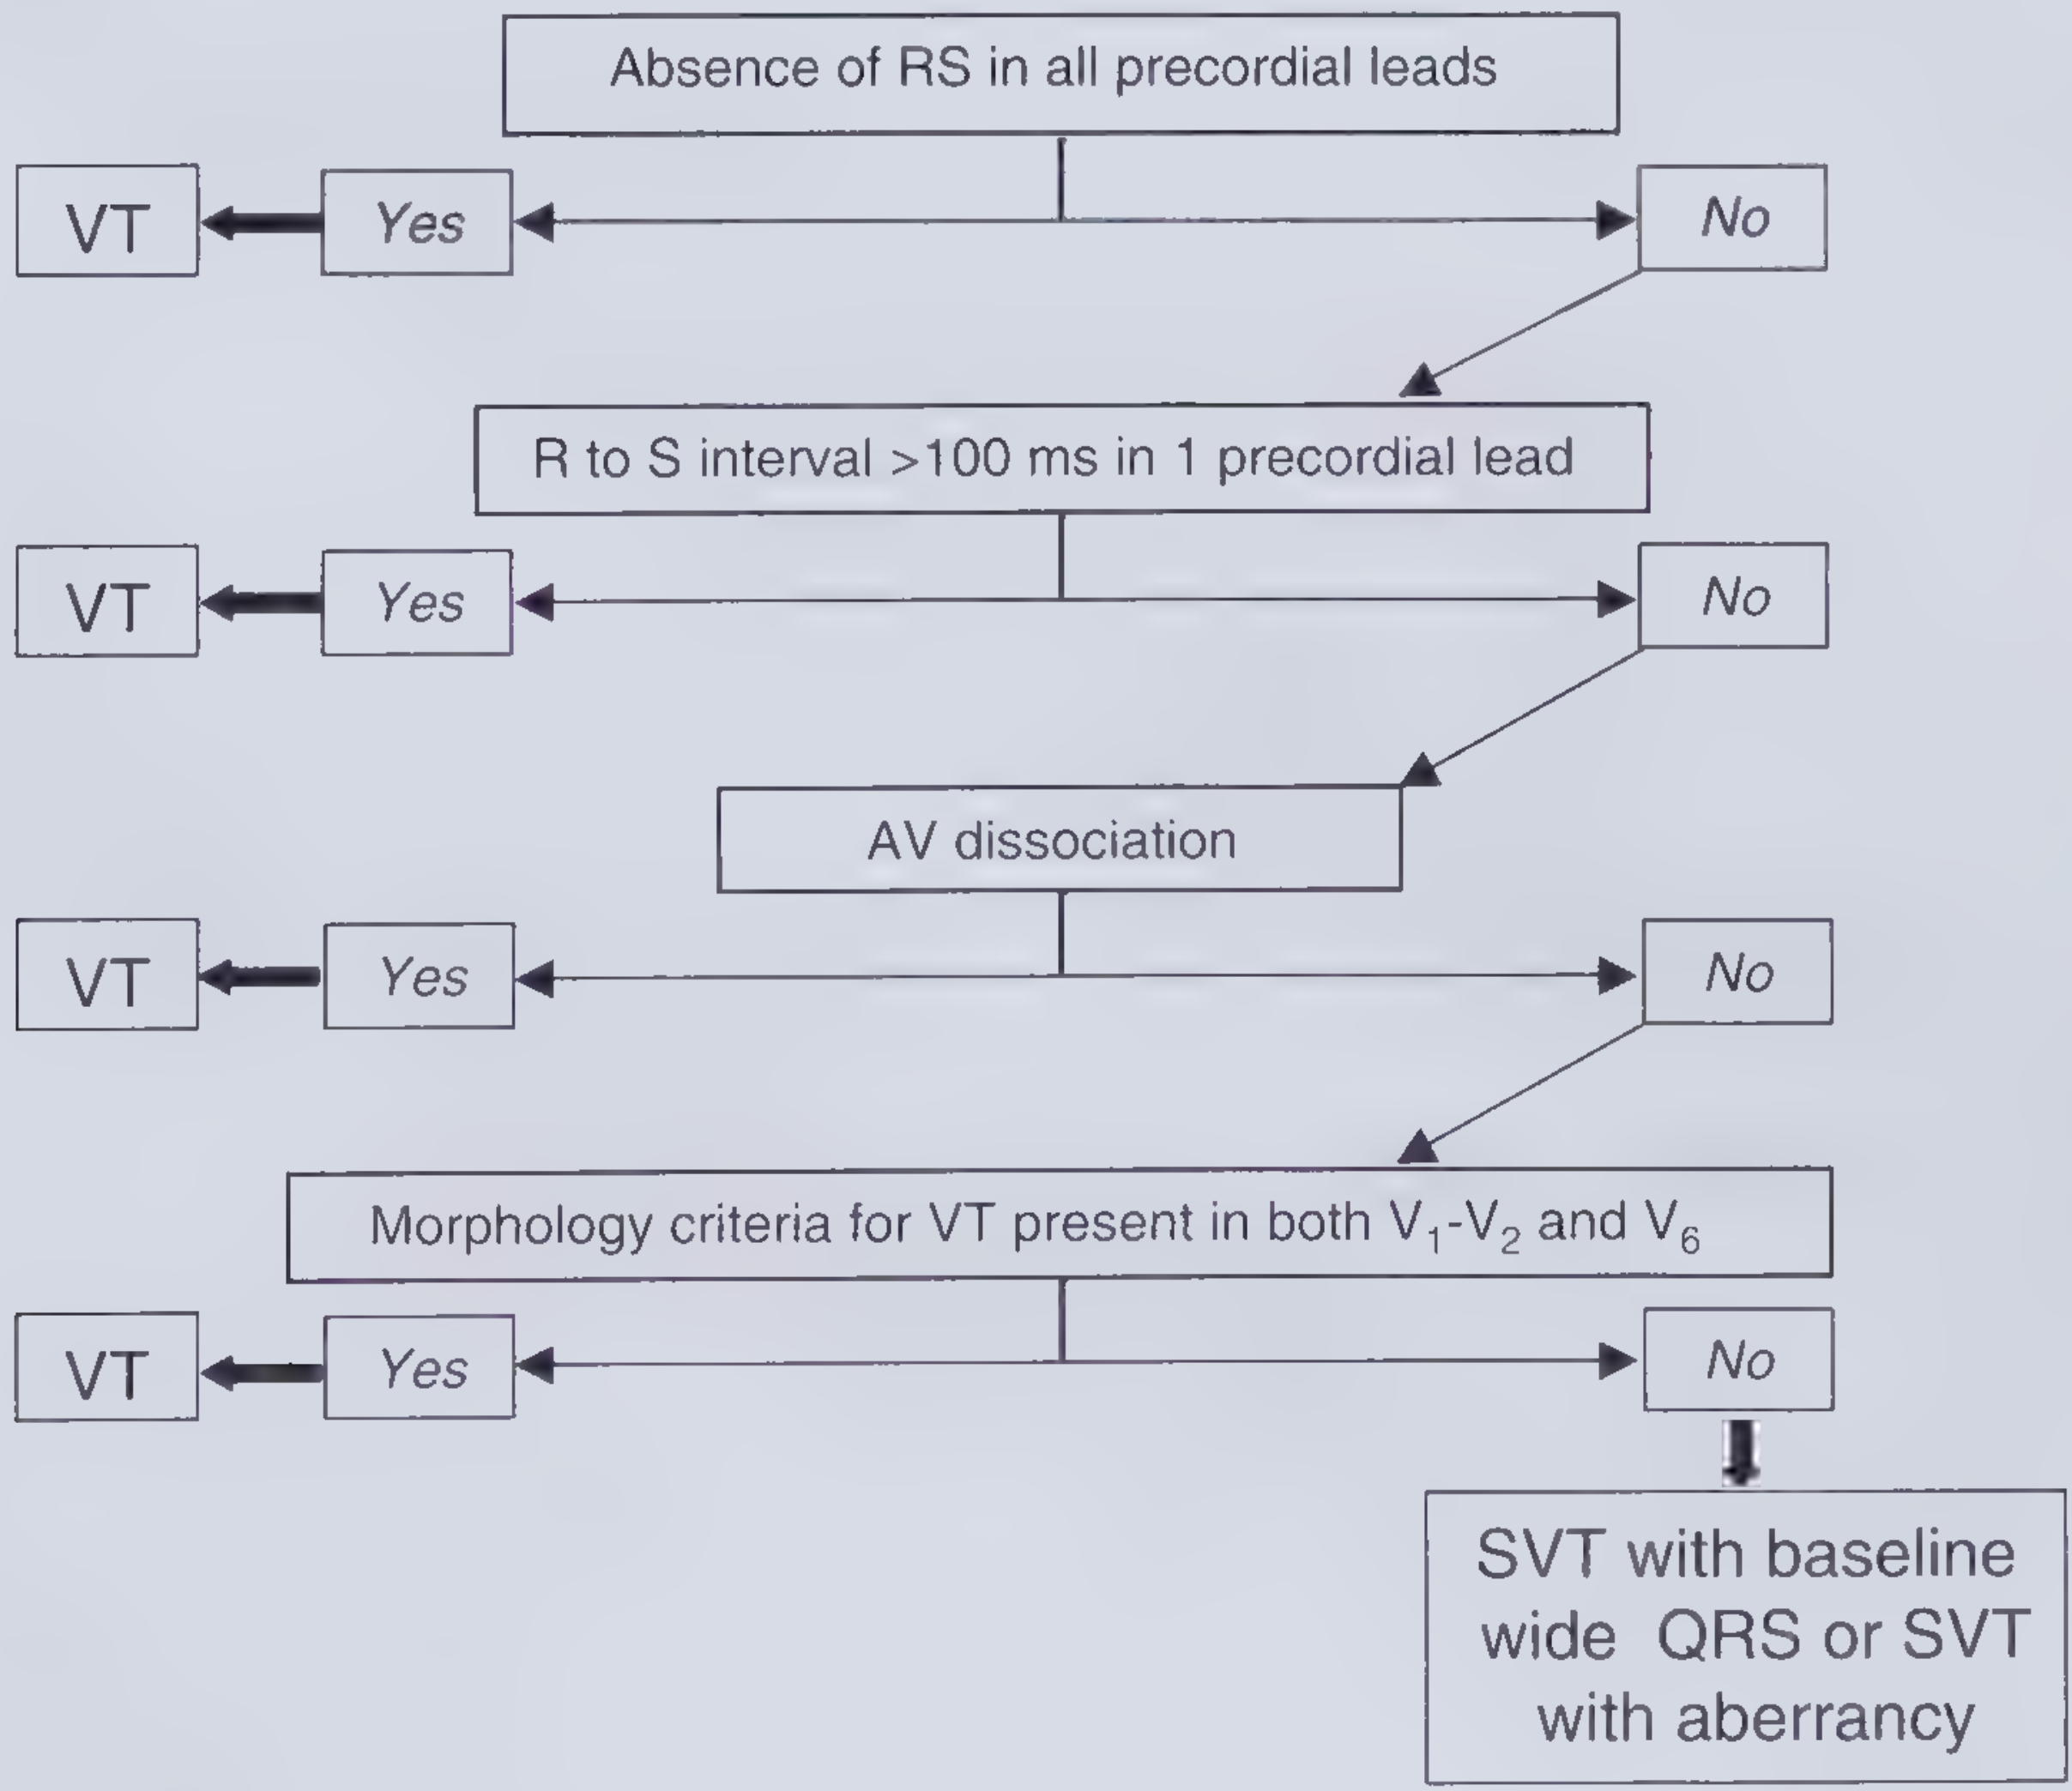
Step 1 - Absence of RS complex in ALL precordial leads (V1-V6)?
- If there is no RS complex in any precordial lead (only pure R, QS, or QR patterns) → VT
- If RS is present in at least one precordial lead → proceed to Step 2
Step 2 - RS interval > 100 ms in ANY one precordial lead?
- The RS interval = onset of R to nadir of S in any precordial lead
- If RS interval > 100 ms in any single precordial lead → VT
- If RS interval ≤ 100 ms in all precordial leads → proceed to Step 3
Step 3 - AV dissociation?
- P waves and QRS complexes beating independently (P rate ≠ QRS rate)
- Often best seen in inferior leads (II, III, aVF) and V1
- Look for fusion beats (narrow QRS merging with wide QRS) and capture beats (isolated narrow QRS during wide-complex tachycardia) - both are pathognomonic for VT
- If AV dissociation present → VT
- If absent or not visible → proceed to Step 4
Step 4 - Morphology criteria for VT in BOTH V1-V2 AND V6?
If RBBB-like morphology (dominant R in V1):
| Lead | SVT pattern | VT pattern |
|---|---|---|
| V1 | Triphasic rsR' or rSR' | Monophasic R, biphasic qR or Rs, or "rabbit ear" (taller left peak) |
| V6 | Triphasic qRs (R > S) | QS, rS (deep S), or R to S ratio < 1 |
If LBBB-like morphology (dominant S in V1):
| Lead | SVT pattern | VT pattern |
|---|---|---|
| V1/V2 | Narrow r (<30 ms), rapid S downstroke | Broad r (>30 ms), notched S downstroke, RS onset > 60 ms |
| V6 | No Q wave (or small q) | QS or qR pattern |
Key Pearls
| Feature | Favors VT | Favors SVT |
|---|---|---|
| Prior MI or cardiomyopathy | Strongly | - |
| AV dissociation | Pathognomonic | Never |
| Fusion / capture beats | Pathognomonic | Never |
| QRS width | > 160 ms (especially RBBB-type) | Usually < 160 ms |
| Axis | Northwest axis (-90° to ±180°) | Rarely northwest |
| Concordance | All precordial leads same direction | Rare |
| Clinical response to adenosine | Does NOT terminate | Often terminates |
Performance & Limitations
- Original Brugada (1991) sensitivity 98.7%, specificity 96.5% for detecting VT
- Real-world ED sensitivity drops to 92-94%
- Less reliable in patients taking Class I antiarrhythmics (flecainide, procainamide)
- If in doubt, treat as VT - misdiagnosing VT as SVT and giving verapamil can be fatal
- Other algorithms: Griffith criteria (sensitivity 92%, uses RBBB/LBBB morphology in V1 and V6 first), Vereckei criteria (uses only lead aVR, 4 steps)
"Only the absence of ALL Brugada criteria allows the diagnosis of SVT." - Rosen's Emergency Medicine
Clinical Bottom Line
- Unstable wide-complex tachycardia → synchronized DC cardioversion immediately (100 J biphasic), do not waste time on algorithm
- Stable wide-complex tachycardia → apply Brugada algorithm; if uncertain, treat as VT with procainamide or amiodarone (never verapamil/diltiazem if VT is possible)