
Morphology of mi
myocardial infarction morphology gross histology
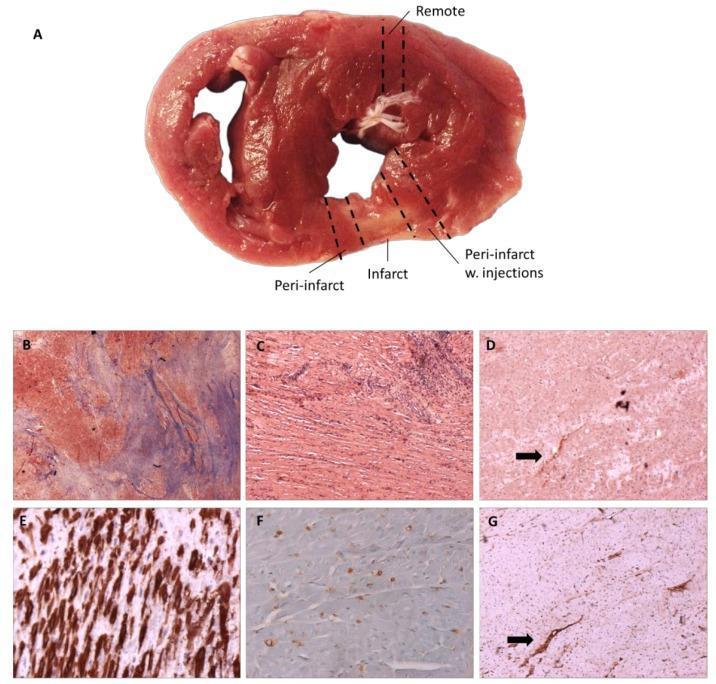
This composite educational image illustrates myocardial histology following infarction. Panel A displays a gross clinical photograph of a transverse heart section (minipig model), with dashed lines demarcating 'Remote', 'Infarct', and 'Peri-infarct' sampling regions. Panels B and C show light microscopy of the infarcted tissue; Masson’s Trichrome (B) reveals significant collagen deposition (blue staining), indicating fibrosis, while Hematoxylin-eosin (C) demonstrates myocyte arrangement and cellular infiltration. Panels D through G utilize immunohistochemistry (IHC) to identify molecular markers in the peri-infarct and infarct areas. Integrin αvβ3 (D) and CD31 (G) staining (light brown) highlight neo-angiogenesis and endothelial structures, with arrows indicating co-localized vascular expression. Alpha-smooth muscle actin (E) shows dense brown staining of myofibroblasts within the scar tissue. CD68 (F) displays punctate brown staining consistent with macrophage infiltration. This visual material is used to teach concepts related to tissue remodeling, fibrotic scar formation, and the inflammatory response in ischemic heart disease.
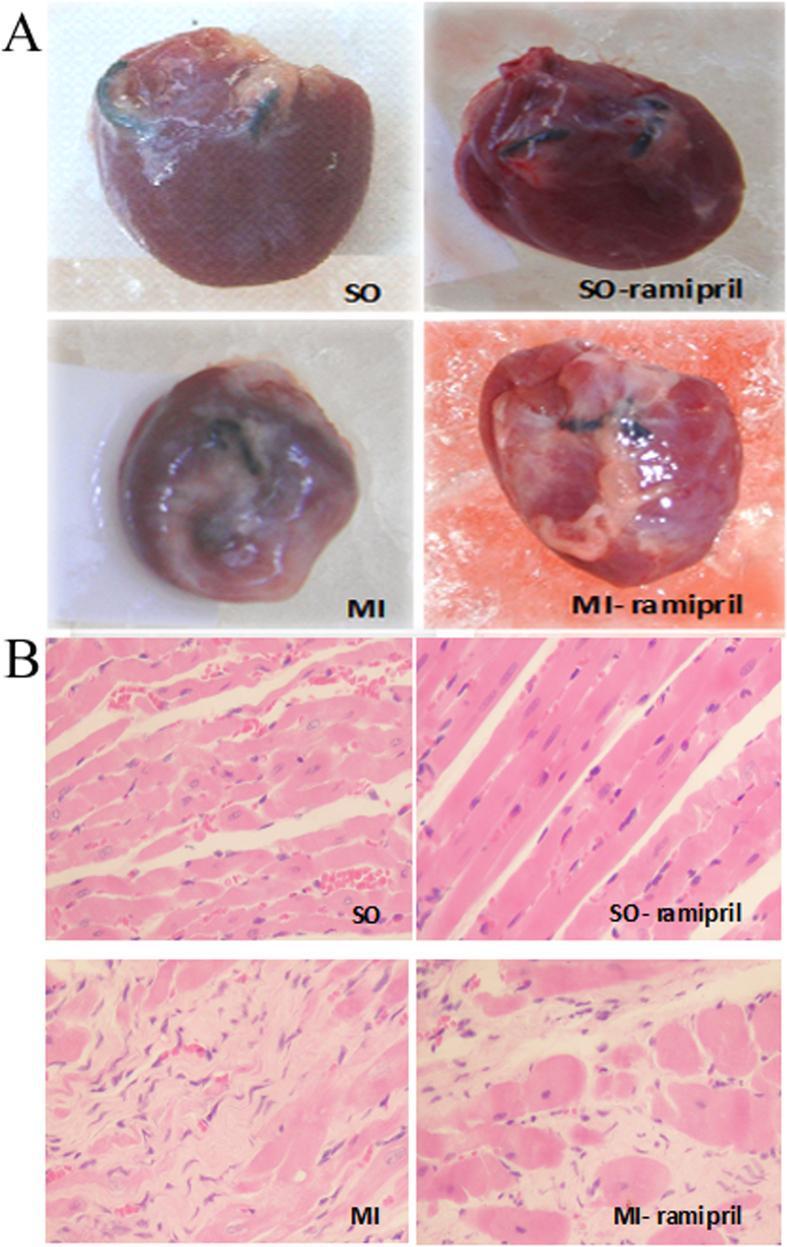
This composite educational image illustrates the gross morphology and histopathology of myocardial infarction (MI) and the effects of ramipril treatment in a rat model. Panel A presents a comparison of gross heart specimens. The Sham-Operated (SO) group shows a healthy ellipsoid shape with a smooth, dark-red surface. In contrast, the MI group exhibits significant ventricular enlargement (eccentric hypertrophy), a pale infarcted region, and thinning of the ventricular wall. The MI-ramipril group demonstrates a moderate reduction in heart volume and infarct size compared to the untreated MI group. Panel B displays light microscopy of myocardial tissue stained with Hematoxylin and Eosin (H&E). The SO groups show organized, parallel myocardial fibers with intact cardiomyocytes and clear nuclei. The untreated MI group reveals significant pathological changes in the non-infarcted area, including irregular fiber arrangement, cardiomyocyte hypertrophy, and evidence of interstitial fibrosis and degeneration. The MI-ramipril specimen shows partially preserved fiber architecture and less severe cardiomyocyte degeneration, highlighting the cardioprotective effects of ACE inhibition on post-MI remodeling.
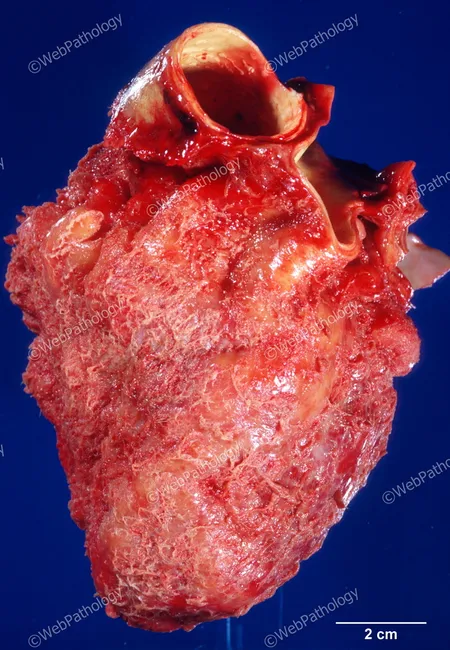
This gross pathology image depicts the heart with the visceral pericardial surface coated by a dry, coarse granular exudate consistent with fibrinous pericarditis following myocardial infarction. The pericardial surface is roughened and opaque, lacking a serous effusion, and the fibrinous layer appears adherent at several foci, giving a bread-and-butter texture in places. The scale bar indicates 2 cm for size reference. The underlying myocardium is not fully visible but the inflammation is localized to the pericardial layers, a common early complication after acute infarction. Macroscopically, fibrin strands produce a granular, filamentous appearance with a friable, waxy consistency. This lesion reflects an acute inflammatory process secondary to myocardial necrosis, with fibrin deposition along the epicardial and parietal pericardial surfaces. Clinically, fibrinous pericarditis after MI presents with chest pain and a friction rub, and may progress to adhesions and effusion if unresolved. This image is valuable for teaching post-infarction complications, correlating gross pathology with histology of fibrinous exudate, and illustrating differential diagnoses such as serofibrinous or purulent pericarditis. It also supports educational use in pathology libraries, medical education, and case-based learning for cardiology and internal medicine. This representation reinforces recognition of postinfarction fibrinous pericarditis patterns in exams and clinical review materials worldwide.
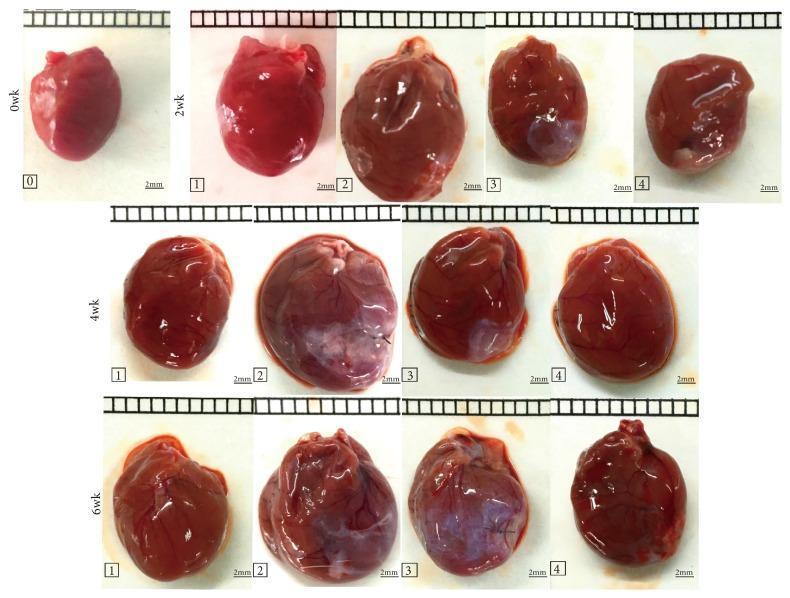
This clinical photograph displays a grid of gross heart specimens from a rat model study on myocardial infarction (MI) and pharmacological interventions. The image is organized by rows representing time points (0, 2, 4, and 6 weeks) and columns representing experimental groups: (0) Control, (1) Sham, (2) MI untreated, (3) MI + XJEK, and (4) MI + Fosinopril. The specimens are shown against a white background with a 2mm scale bar. In the untreated MI group (2) at 4 and 6 weeks, there is evident cardiac hypertrophy (increased heart size) and significant pallor. Areas of myocardial infarction are visually represented by white/blue-gray patches on the ventricular surface, indicating fibrotic scar tissue or ischemic damage, whereas healthy myocardium appears reddish-brown. Groups 3 (XJEK) and 4 (Fosinopril) demonstrate a comparative reduction in cardiac enlargement and a decrease in the visible surface area of infarction at 4 and 6 weeks post-MI. The series illustrates the progression of pathological remodeling and the potential cardioprotective effects of the tested treatments on gross anatomical morphology.
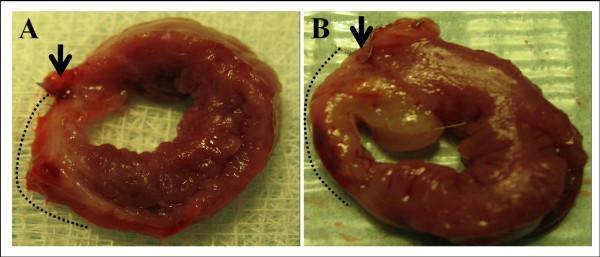
This clinical photograph displays a comparative gross histology of harvested heart specimens, showing 3 mm transverse ventricular sections used to evaluate myocardial infarction. The image is divided into two panels: Panel A illustrates a heart treated with conventional open-chest ligation of the Left Anterior Descending (LAD) coronary artery, where a black arrow indicates the visible 5-0 monofilament polypropylene suture. Panel B shows a heart from a minimally invasive transauricular transcatheter LAD embolization, with a black arrow pointing to an embedded platinum micro-coil. In both specimens, dotted black lines demarcate a distinct 'gray-white' zone of myocardial infarction, contrasting with the surrounding healthy reddish-brown viable myocardium. These sections represent the greatest dimension of post-infarct fibrotic areas, illustrating the macroscopic pathological changes—such as tissue discoloration and necrosis—resulting from different coronary occlusion techniques. This visual comparison is relevant for cardiovascular research, particularly in the development and validation of experimental myocardial infarction models.
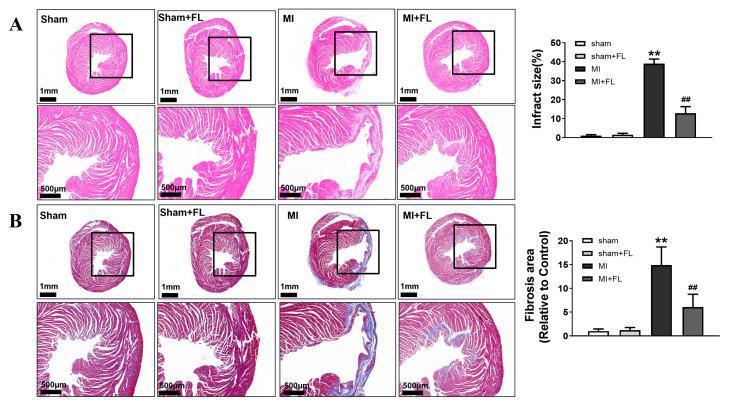
This composite educational graphic displays histopathological sections of mouse hearts used to study myocardial infarction (MI) and the protective effects of Flt3 ligand (FL) treatment. Row A presents Hematoxylin and Eosin (H&E) stained cross-sections showing gross cardiac morphology. The Sham and Sham+FL groups exhibit normal ventricular wall thickness and intact structural integrity. The MI group reveals significant ventricular wall thinning and a distorted cardiac shape, indicative of a large infarct. The MI+FL group shows a preserved ventricular structure with reduced wall thinning compared to the MI group. Row B utilizes Masson's Trichrome staining to highlight fibrosis. Fibrotic tissue is stained blue, while healthy myocardium appears red/pink. Extensive blue collagen deposition is visible in the MI group's infarct region, which is markedly reduced in the MI+FL group. Accompanying bar graphs provide quantitative data for both infarct size and fibrotic area percentage across the four groups (Sham, Sham+FL, MI, MI+FL), demonstrating that FL administration significantly attenuates adverse cardiac remodeling and collagen deposition following LAD-induced ischemia.
myocardial infarction coagulative necrosis wavy fibers neutrophil infiltration histology
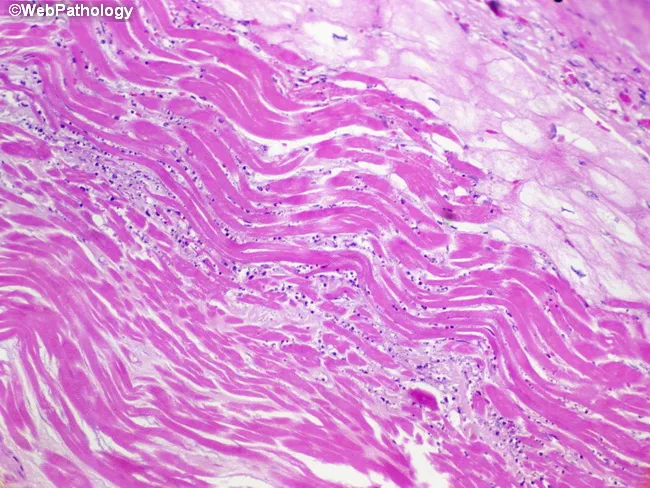
Imaging modality: light microscopy of a cardiac tissue section stained with hematoxylin and eosin reveals infarct border-zone myocardium from the left ventricle. The tissue shows parallel, wavy myocardial fibers along the border between viable and necrotic tissue—a hallmark of early coagulative necrosis in myocardial infarction. The fibers appear elongated and noncontractile, with eosinophilic (pink) cytoplasm and loss of distinctive cross-striations; nuclei are scarce or absent in necrotic cells. In the periphery, viable myocytes tug on adjacent fibers during systole, producing the characteristic waviness. The infarct core is hypo-cellular with meshy eosinophilic areas and early inflammatory cells beginning to infiltrate, consistent with the 6–12 hour window after ischemic onset. These histologic changes reflect irreversible injury, rapid necrosis, and initiation of repair processes. Clinically, recognition of wavy fibers and coagulative necrosis supports an acute MI diagnosis and helps estimate timing, guiding anti-ischemic therapy, reperfusion decisions, and prognostic assessment. This image is representative in education and research contexts for teaching infarct evolution, distinguishing acute from subacute tissue changes, and illustrating the border zone pathophysiology in cardiology and pathology education. This micrograph serves as a teaching tool for students, residents, and researchers studying ischemic injury timelines, scar formation, and therapeutic windows in infarcted myocardium.
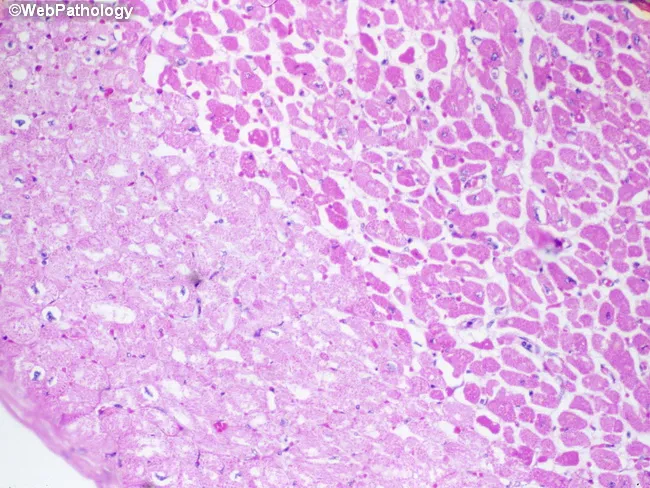
Imaging modality: Light microscopy of hematoxylin-eosin (H&E) stained cardiac tissue. Specimen is paraffin-embedded myocardial section, 5 micron thick, imaged with bright-field optics at high magnification. Anatomic region: left ventricular myocardium with an infarct in the left half of the field. The histology demonstrates pallor of necrotic cardiomyocytes (myocytolysis) produced by sarcolemmal disruption with influx of salt and water and cytoplasmic swelling. In this early post-ischemic stage, fibers lose cross-striations and display increased eosinophilia; nuclei are often absent or pyknotic. The infarct border may show waviness of fibers and mild edema; contraction bands may be present at the margin. Neutrophilic infiltration is typically minimal during the first 24 hours but may begin to appear around this window. The combination of coagulative necrosis, myocytolysis, and pallor indicates an acute myocardial infarction approximately one day old. This histologic pattern correlates with ischemia from coronary occlusion, clinical presentation of acute coronary syndrome, and aligns with diagnostic timelines (0-24 h). Clinically the image supports timing of infarct and helps distinguish acute infarction from myocarditis or chronic scar, serving as an educational reference for pathology, medical education, and research on myocardial injury dynamics. Further confirmed by clinical correlation and education.
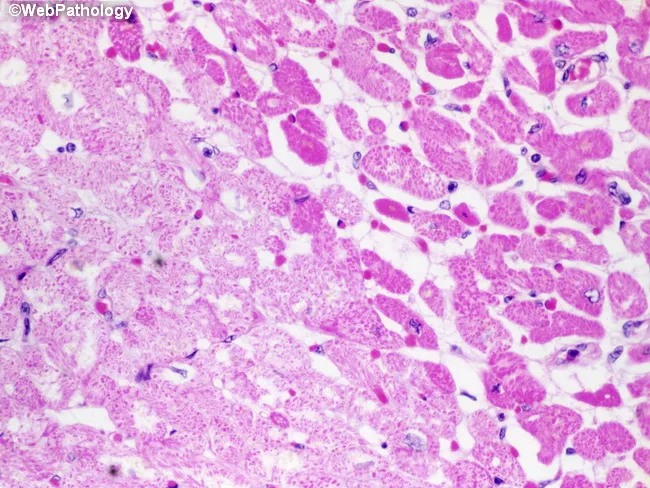
Imaging modality and tissue: light microscopy of hematoxylin and eosin stained myocardial tissue from the left ventricle showing acute infarct with myocytolysis. The left half of the field demonstrates pallor of necrotic cardiac myocytes, consistent with early ischemic injury about one day old. Disruption of the sarcolemma and loss of cytoplasmic integrity produce osmotic swelling as salt and water accumulate within myocytes, yielding pale, swollen, eosinophilic cells. Nuclei are pyknotic or obscured, and cross‑striations are variably preserved in some fibers while others show early coagulative necrosis. The surrounding myocardium exhibits preserved architecture with clear demarcation between infarcted and viable tissue. This stage precedes substantial neutrophilic infiltration and precedes macrophage clearance. The histologic features correlate with an acute coronary syndrome of short duration, typically anterior or lateral wall involvement depending on infarct territory, and predict ongoing impairment of contractility in the affected region. Clinically, this finding supports acute myocardial infarction (AMI) within 24 hours, ischemic necrosis, and myocytolysis as a pathologic correlate of severe ischemia. Differential considerations include early myocarditis, reperfusion injury, or artifact; however, the combination of pallor, sarcolemmal disruption, and myocytolysis most strongly supports early infarction. The image is diagnostic for early infarct with histologic confirmation.
Morphology of Myocardial Infarction (MI)
Overview
Types of MI by Extent
| Type | Description |
|---|---|
| Transmural (STEMI) | Full-thickness necrosis of the ventricular wall; associated with plaque rupture + complete coronary occlusion |
| Subendocardial (NSTEMI) | Necrosis limited to the inner 1/3 to 1/2 of the myocardium; reflects reduced perfusion in the zone most distal from epicardial vessels |
Time-Dependent Morphological Changes
REVERSIBLE INJURY
| Time | Gross | Light Microscopy | Electron Microscopy |
|---|---|---|---|
| 0-30 min | None | None | Relaxation of myofibrils; glycogen loss; mitochondrial swelling |
IRREVERSIBLE INJURY
| Time | Gross | Light Microscopy | Electron Microscopy |
|---|---|---|---|
| 30 min - 4 hr | None | Usually none; variable wavy fibers at border | Sarcolemmal disruption; mitochondrial amorphous densities |
| 4-12 hr | Occasional dark mottling | Onset of coagulative necrosis; edema; hemorrhage | - |
| 12-24 hr | Dark mottling | Ongoing coagulative necrosis; pyknosis of nuclei; myocyte hypereosinophilia; marginal contraction band necrosis; early neutrophilic infiltrate | - |
| 1-3 days | Mottling with yellow-tan infarct center | Coagulative necrosis with loss of nuclei and striations; brisk neutrophilic infiltration | - |
| 3-7 days | Hyperemic border; central yellow-tan softening | Disintegration of dead myofibers; dying neutrophils; early macrophage phagocytosis at borders; early granulation tissue | |
| 7-10 days | Maximally yellow-tan and soft; depressed red-tan margins | Well-developed phagocytosis; granulation tissue at margins with new vessels | |
| 10-14 days | Red-gray depressed infarct borders | Well-established granulation tissue; new blood vessels; collagen deposition | |
| 2-8 weeks | Gray-white scar progressing from border toward core | Increased collagen deposition with decreased cellularity | |
| >2 months | Scarring complete | Dense collagenous scar |
Key Gross Features - A Narrative Timeline
-
<12 hours: Infarct is usually not visible on gross examination alone. A special histochemical stain - triphenyl tetrazolium chloride (TTC) - can identify the area: intact myocardium stains brick-red (preserved lactate dehydrogenase activity), while the infarcted zone appears as a pale, unstained area (LDH leaks out through damaged membranes).
-
12-24 hours: A reddish-blue area of discoloration due to congestion and extravasated trapped blood becomes visible.
-
3-7 days: The infarct is rimmed by a hyperemic zone of early granulation tissue.
-
Week 1-2: Progressive yellow-tan softening of the central necrotic core; this is the period of maximum weakness and highest risk of rupture (days 3-7).
-
Weeks-months: Progressive replacement by a gray-white fibrous scar moving from the borders inward.
Key Histologic Features
"Wavy Fibers" (earliest sign, ~1-2 hours)
- Viable myocardium at the infarct border continues to contract, pulling and stretching the adjacent noncontractile dead fibers
- Results in elongated, undulating fiber pattern
- Seen at the periphery/border zone of the infarct
Coagulative Necrosis (4-12 hours onward)
- Loss of nuclear staining (pyknosis → karyorrhexis → karyolysis)
- Loss of cross-striations
- Cytoplasmic hypereosinophilia (pink, homogenous cytoplasm on H&E)
- Cell outlines preserved but contents dead ("ghost cells")
Contraction Band Necrosis
- Dense transverse eosinophilic bands across myofibers
- Results from massive calcium influx causing hypercontraction of sarcomeres
- Seen at the margins of an infarct and in reperfused infarcts
- A hallmark of reperfusion injury
Inflammatory Response
- 1-3 days: Brisk neutrophil infiltration
- 5-10 days: Neutrophils die; macrophages dominate - phagocytosing necrotic debris
- 1-2 weeks: Granulation tissue with new capillaries and fibroblasts replaces necrotic zone
- 6+ weeks: Dense collagenous scar - acellular, firm, gray-white
Complications Based on Morphologic Stage
| Complication | Timing | Morphologic Basis |
|---|---|---|
| Arrhythmias | First hour | Myocardial irritability from ischemic zone |
| Myocardial rupture | 3-7 days | Maximum lysis/softening of necrotic myocardium |
| Fibrinous pericarditis | 2-3 days | Transmural inflammation reaching the epicardium |
| Mural thrombus | Days-weeks | Stasis + endocardial damage |
| Ventricular aneurysm | Late (weeks-months) | Thinned fibrous scar wall bulges outward |
| Dressler syndrome | Weeks later | Immune response to damaged pericardium/myocardium |
Special Points to Remember
- Large, central infarcts heal from the periphery inward - the center is always the last to heal
- Subendocardial ischemia can occur even without a thrombus (severe fixed stenosis + increased demand)
- Reperfusion causes contraction band necrosis and hemorrhage but can salvage the ischemic penumbra if done early
- TTC stain is the best way to identify infarcts at autopsy within the first 12 hours