
Hypersomolar hyperglycemia state HHS
"hyperosmolar hyperglycemic state" management
hyperosmolar hyperglycemic state HHS management algorithm
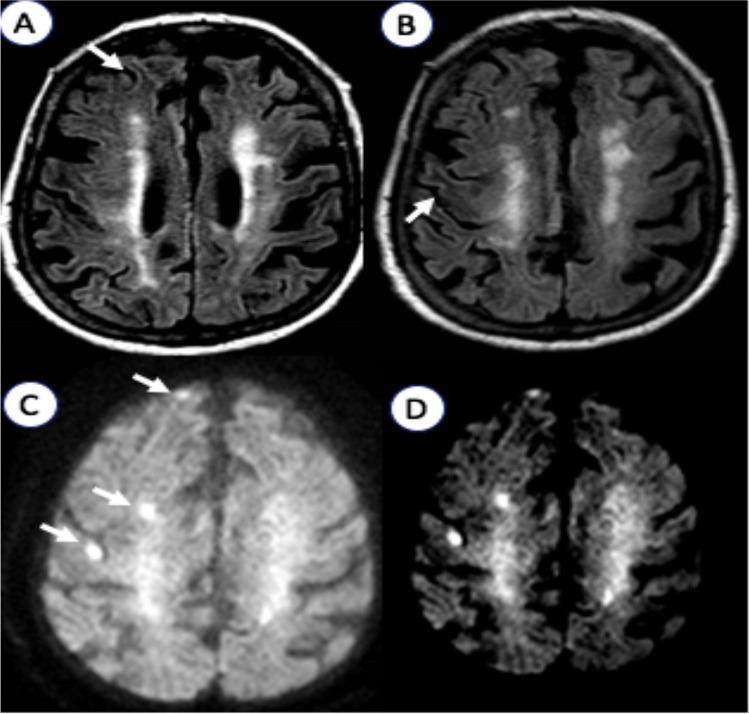
This diagnostic imaging panel presents axial brain MRI sequences from a patient with nonketotic hyperglycemic hyperosmolar state (NKHHS). Panels A and B are T2-FLAIR sequences showing multifocal, subcortical hypointensities predominantly in the right hemisphere's white matter. These areas (marked with arrows) demonstrate decreased signal intensity compared to adjacent brain parenchyma. Panel C illustrates Diffusion-Weighted Imaging (DWI), revealing disseminated hyperintense cortical lesions in the right frontal region. Panel D shows the corresponding Apparent Diffusion Coefficient (ADC) map, where these same regions exhibit signal loss (restricted diffusion). The combination of high DWI signal and low ADC signal indicates cytotoxic edema. These findings are characteristic of hyperglycemia-induced brain injury, where metabolic derangement and hyperosmolarity lead to transient neurological deficits and specific neuroimaging patterns, often localized to the subcortical white matter and overlying cortex.
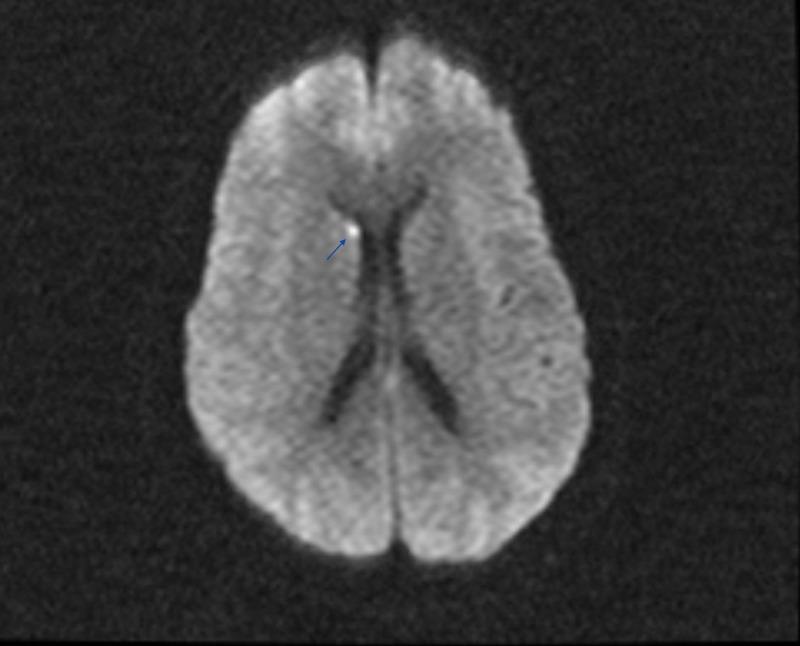
This diagnostic image is an axial slice of a brain MRI, specifically utilizing Diffusion-Weighted Imaging (DWI) or a similar high-contrast sequence to identify acute pathology. The image displays the cerebral hemispheres with visible sulci and gyri and centrally located, hypointense (dark) lateral ventricles. A focal, hyperintense (bright) signal abnormality is identified in the right hemisphere, specifically localized to the head of the caudate nucleus adjacent to the frontal horn of the lateral ventricle. This lesion is highlighted by a blue arrow and is clinically consistent with an acute lacunar infarct. The image is used to demonstrate the localization of small vessel ischemic strokes in patients presenting with encephalopathy or focal neurological deficits, particularly in the context of metabolic derangements like Hyperosmolar Hyperglycemic Syndrome (HHS).
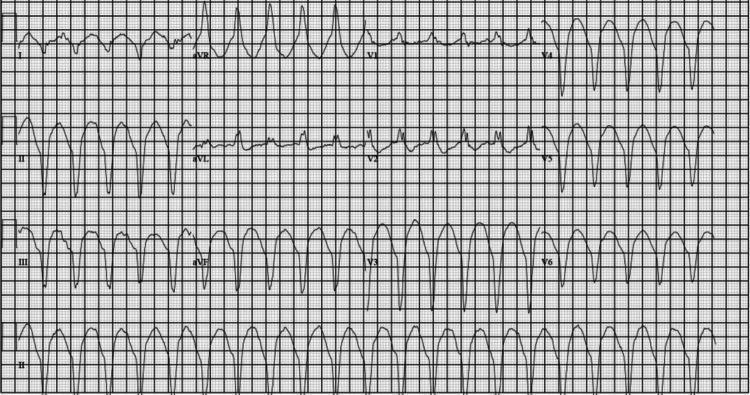
A 12-lead electrocardiogram (EKG) illustrating a wide complex tachycardia, clinically consistent with ventricular tachycardia (VT) occurring after return of spontaneous circulation (ROSC). The tracing displays a rapid, regular rhythm with broad QRS complexes, exceeding 120 ms, which suggests a ventricular origin rather than supraventricular conduction. Discernible P waves are absent throughout all leads, indicating a lack of atrioventricular synchrony. The precordial leads (V1-V6) show significant ST-segment and T-wave abnormalities, with high-amplitude T-waves and variable ST-segment deviations secondary to the aberrant depolarization. Lead II (rhythm strip at the bottom) confirms a sustained, monotonic wide-complex pattern. This diagnostic image demonstrates the electrical manifestations of severe electrolyte imbalances, specifically profound hypokalemia in the context of hyperosmolar hyperglycemic state (HHS). The EKG serves as an educational example of lethal cardiac arrhythmias associated with metabolic emergencies and the importance of rapid recognition of wide-complex tachycardias in clinical practice.
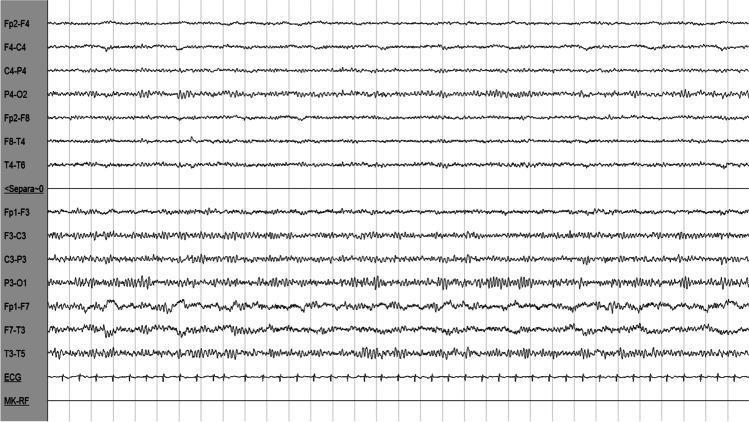
Diagnostic Image: This is an electroencephalography (EEG) tracing showing a longitudinal bipolar montage (P2 montage) alongside a single-lead electrocardiography (ECG) channel. The EEG displays cortical electrical activity from both hemispheres. The upper set of derivations (Fp2-F4 through T4-T6) corresponds to the left hemisphere, while the lower set (Fp1-F3 through T3-T5) corresponds to the right hemisphere. The right-sided derivations demonstrate a clear asymmetry characterized by higher-amplitude, lower-frequency slow-wave activity (delta and theta ranges), particularly prominent in the temporal and posterior leads (F7-T3, T3-T5, P3-O1). There is a notable absence of epileptiform discharges, such as spikes or sharp waves. The recording parameters indicate a paper speed of 1.5 cm/s, a sensitivity of 7.0 uV/mm, and a high-frequency filter setting of 70.0 Hz. This tracing illustrates focal cerebral dysfunction, clinically associated in this context with nonketotic hyperglycemic hyperosmolar state (NKHHS) affecting the right hemisphere.
Hyperosmolar Hyperglycemic State (HHS)
Definition & Overview
- Predominantly affects elderly patients with type 2 diabetes
- Has a higher mortality than DKA (up to 15% in some series)
- Mortality usually tied to the precipitating event and comorbidities
Pathophysiology
- Insulin deficiency → increased hepatic glucose production (glycogenolysis + gluconeogenesis) + decreased peripheral glucose utilization
- Hyperglycemia → osmotic diuresis → profound intravascular volume depletion
- Patients (often elderly, debilitated, or cognitively impaired) cannot adequately replenish fluids
- Hypotonic diuresis produces hyperglycemia, hypernatremia, and hypertonicity
- Eventually, decreased GFR halts the osmotic diuresis, worsening hyperglycemia further
- Harrison's Principles of Internal Medicine 22E, p. 3262
- Rosen's Emergency Medicine, p. 2546
Precipitating Causes
| Category | Examples |
|---|---|
| Infections | Pneumonia (most common), UTI, gram-negative sepsis |
| Cardiovascular | Myocardial infarction, stroke |
| Renal | Chronic renal insufficiency, uremia |
| GI | GI hemorrhage, mesenteric ischemia |
| Iatrogenic | Parenteral/enteral nutrition, peritoneal or hemodialysis |
| Other | Burns, trauma, rhabdomyolysis, heat-related illness, pancreatitis |
Clinical Features
- Prodrome: Several weeks of polyuria, polydipsia, weight loss, diminished oral intake (much longer than DKA)
- Dehydration: Severe - fluid deficit is accumulated over days to weeks
- Hemodynamic: Orthostatic hypotension or frank hypotension, tachycardia
- Neurologic: Altered mental status (the degree of CNS depression correlates directly with the degree and rate of hyperosmolarity), seizures, stroke syndromes, movement disorders; coma in severe cases
- Absent features (distinguishing from DKA): No Kussmaul respirations, no nausea/vomiting/abdominal pain
- ~20% of patients have no prior known history of type 2 diabetes
Diagnostic Criteria
| Parameter | DKA | HHS |
|---|---|---|
| Plasma glucose | >250 mg/dL | >600 mg/dL |
| Serum osmolality | Variable | >320 mOsm/kg |
| Serum bicarbonate | ≤18 mEq/L | >15 mEq/L |
| Arterial pH | <7.30 | >7.30 |
| Serum ketones | Positive | Negative or small |
| Anion gap | >12 mEq/L | <12 mEq/L |
| Urine ketones | Positive | Negative or small |
-
BUN markedly elevated (prerenal azotemia)
-
Initial K+, Mg2+, and phosphate may appear normal or elevated despite total body deficits
-
Small anion gap metabolic acidosis may occur secondary to lactic acidosis (from sepsis), starvation ketosis, or uremia - NOT from diabetic ketogenesis
-
Tintinalli's Emergency Medicine, p. 1486
-
Harrison's 22E, p. 3262
Management
1. Fluids (Most Critical)
- 1-3 L of 0.9% normal saline over the first 2-3 hours to stabilize hemodynamics
- For hypovolemic shock: infuse as rapidly as possible
- Isotonic crystalloid is recommended for the volume-depleted patient
- If serum Na+ >150 mEq/L: switch to 0.45% (half-normal) saline
- If serum Na+ is normal or low: continue 0.9% normal saline
- Add dextrose to IV fluids when plasma glucose falls to 200-250 mg/dL (to prevent hypoglycemia while continuing fluid/insulin therapy)
2. Insulin
- IV insulin bolus: 0.1 unit/kg
- Followed by continuous infusion: 0.1 unit/kg/h
- If glucose does not fall: double the infusion rate
- Reduce to 0.02-0.1 unit/kg/h when glucose reaches 200-250 mg/dL
3. Electrolytes
- Measure and monitor serum electrolytes closely
- Potassium levels more accurately reflect total body stores in HHS (less acidemia-driven shift compared to DKA)
- Replace K+, Mg2+, and phosphate as indicated
4. Treat the Precipitant
5. Thrombosis Prevention
6. Special Considerations
- Phenytoin is contraindicated for seizures in HHS - it is often ineffective AND impairs endogenous insulin release
- Use benzodiazepines for seizures instead
- In elderly patients with CHF or renal failure, consider hemodynamic monitoring to guide fluid administration
- Monitor closely for cerebral edema (isolated case reports in adults, particularly with glucose >700 mg/dL)
HHS vs. DKA - Key Differences
| Feature | DKA | HHS |
|---|---|---|
| Diabetes type | Usually Type 1 | Usually Type 2 |
| Age | Any age | Typically elderly |
| Prodrome | Hours to 1-2 days | Days to weeks |
| Ketosis | Prominent | Absent or minimal |
| Acidosis | Significant (pH <7.3) | Absent (pH >7.3) |
| Glucose | >250 mg/dL | >600 mg/dL |
| Osmolarity | Variable | >320 mOsm/kg |
| Fluid deficit | Moderate | Severe |
| CNS changes | Less prominent | Often prominent (coma, seizures) |
| Mortality | ~1-5% | Up to 15% |
| Kussmaul breathing | Present | Absent |
| Nausea/vomiting | Common | Absent |
Neurological Complications
Disposition
- Hourly fluid balance
- Serum glucose every 1-2 hours
- Electrolytes every 2-4 hours
- Close monitoring of mental status and osmolarity
- Harrison's Principles of Internal Medicine 22E (2025), p. 3262
- Rosen's Emergency Medicine, p. 2546-2547
- Tintinalli's Emergency Medicine, p. 1486