
pressure volume loops
python3 -c " import pdfplumber path = '/tmp/workspace/attachments/658a1d12-0333-4529-9948-d864a1582940/cardiac physiology kaplan.pdf' with pdfplumber.open(path) as pdf: print(f'Total pages: {len(pdf.pages)}') for i, page in enumerate(pdf.pages[:3]): print(f'--- PAGE {i+1} ---') print(page.extract_text()[:2000]) "
python3 -c " import pdfplumber path = '/tmp/workspace/attachments/658a1d12-0333-4529-9948-d864a1582940/cardiac physiology kaplan.pdf' with pdfplumber.open(path) as pdf: # Search for PV loop pages for i, page in enumerate(pdf.pages): text = page.extract_text() or '' if 'pressure-volume' in text.lower() or 'pressure volume' in text.lower() or 'P-V' in text or 'end-systolic' in text.lower(): print(f'=== PAGE {i+1} ===') print(text[:3000]) print() "
Pressure-Volume (P-V) Loops
The Basic Loop - Four Phases
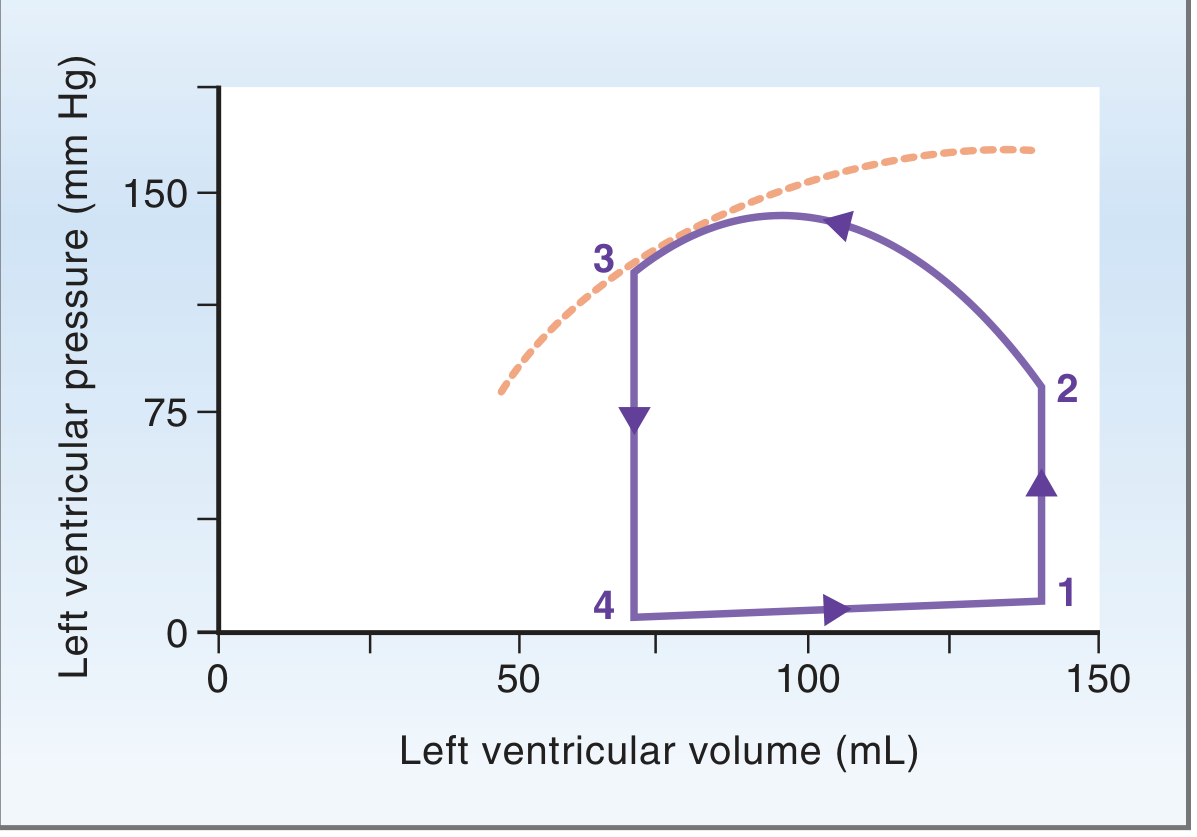
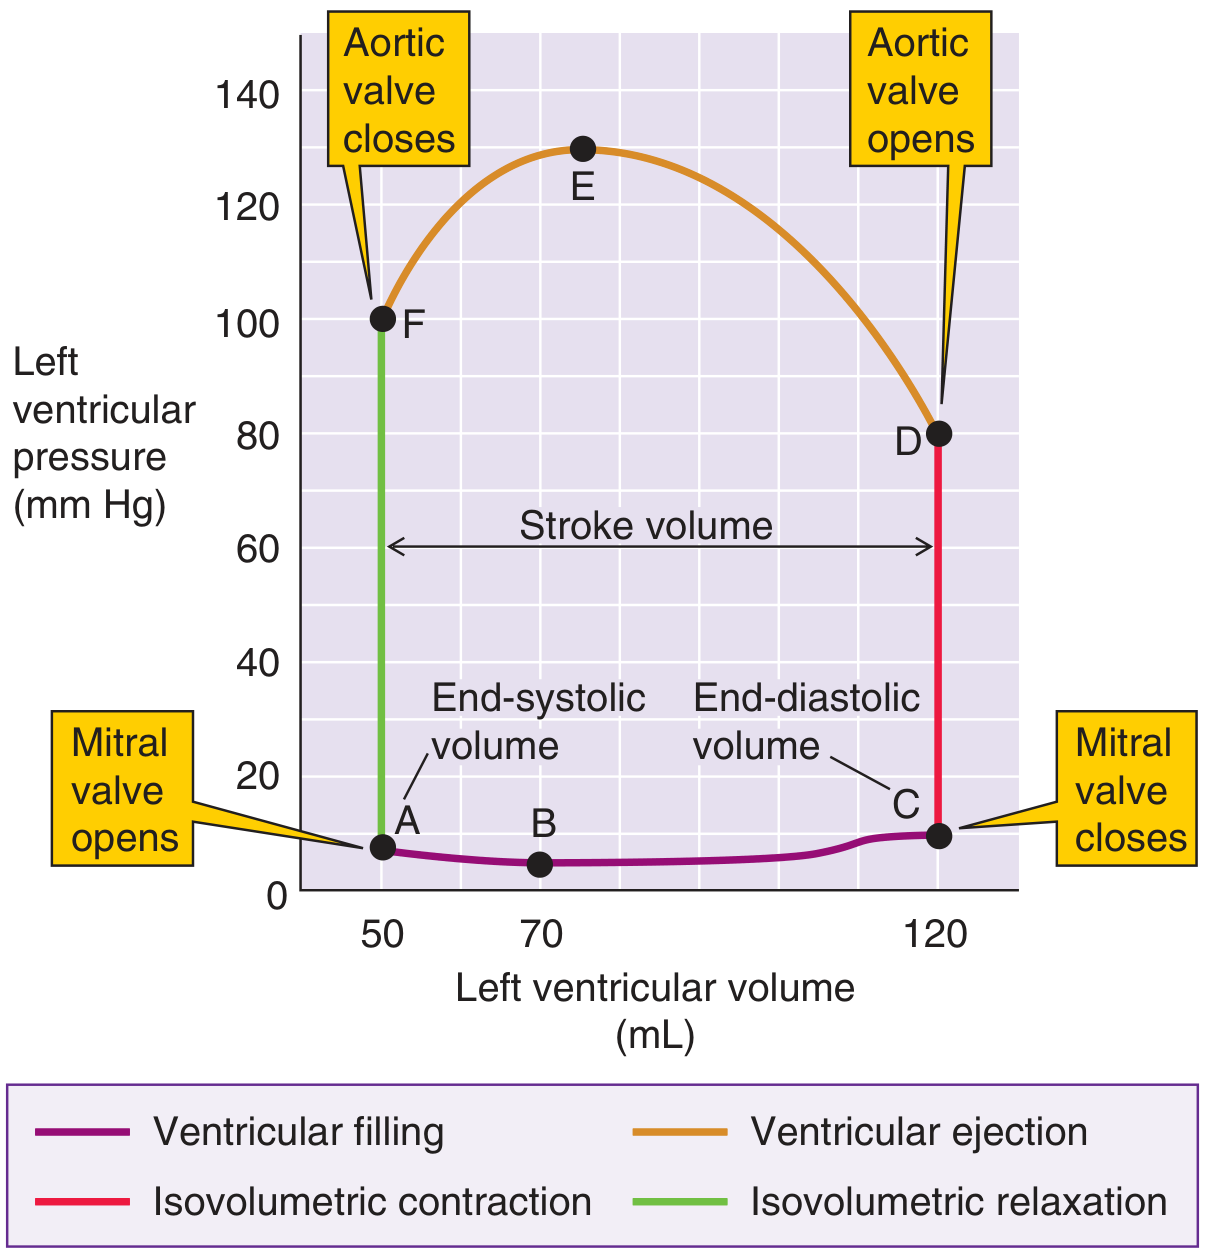
Phase 1: Ventricular Filling (Diastole) - bottom limb, left to right
- Mitral valve opens; LV fills passively from the LA
- Volume rises from ~50 mL (end-systolic volume, ESV) to ~120-140 mL (end-diastolic volume, EDV)
- Pressure rises only slightly (from ~5 to ~10 mmHg) because the ventricle is highly compliant during diastole
- This low-pressure, high-volume filling segment defines the end-diastolic pressure-volume relationship (EDPVR)
Phase 2: Isovolumetric Contraction - right vertical limb, upward
- Mitral valve closes (end of diastole); all valves are now closed
- LV pressure rises sharply from ~10 to ~80 mmHg with no change in volume
- Contraction continues until LV pressure exceeds aortic diastolic pressure, when the aortic valve opens
Phase 3: Ventricular Ejection - top limb, right to left
- Aortic valve opens; blood is ejected into the aorta
- Volume falls from EDV (~120 mL) to ESV (~50-70 mL) - the difference is stroke volume (SV)
- Pressure rises to its peak (~130 mmHg at point E) then falls as ejection decelerates
- The loop touches the end-systolic pressure-volume relationship (ESPVR) at the top-left corner - this is point 3 in the Costanzo diagram
Phase 4: Isovolumetric Relaxation - left vertical limb, downward
- Aortic valve closes; all valves are closed again
- Pressure falls precipitously from ~100 mmHg to ~7 mmHg with no change in volume
- When LV pressure falls below LA pressure, the mitral valve opens and the cycle repeats
Key Boundaries: ESPVR and EDPVR
| Curve | Full Name | What it represents |
|---|---|---|
| ESPVR | End-Systolic Pressure-Volume Relationship | Upper-left boundary; slope = E_es (end-systolic elastance) = index of contractility |
| EDPVR | End-Diastolic Pressure-Volume Relationship | Lower boundary; exponential curve reflecting LV compliance (stiffness during diastole) |
- The ESPVR is approximately linear; its slope (E_es) is the most load-independent index of myocardial contractility available in vivo
- The EDPVR is exponential; increased stiffness (lower compliance) shifts it upward and to the left
- The triangular area between ESPVR and EDPVR to the left of the loop represents potential energy remaining in the ventricle wall at end-systole
Stroke Work and Energetics
- The area enclosed by the P-V loop = stroke work (SW) - the external mechanical work done by the LV per beat (in mmHg·mL, convertible to joules)
- Total mechanical energy = SW (kinetic, the loop area) + potential energy (triangular area to the left) = pressure-volume area (PVA)
- Myocardial oxygen consumption (MVO₂) is linearly proportional to PVA: MVO₂ = α·PVA + β (Suga's model)
- The SW/PVA ratio is an index of mechanical efficiency
Effects of Loading and Contractility Changes
Increased Preload
- Loop shifts right - larger EDV, larger SV
- Peak pressure is maintained; the loop is wider
- ESPVR and afterload (aortic pressure) are unchanged
Increased Afterload
- Loop shifts upward - higher systolic pressure, but reduced SV (less ejection)
- EDV may increase slightly (Frank-Starling compensation)
- Loop becomes taller and narrower
Increased Contractility (positive inotrope)
- ESPVR rotates upward/left (steeper slope = higher E_es)
- SV increases at any given preload; the loop is taller and wider
- ESV decreases (more complete emptying)
Decreased Contractility (HFrEF)
- ESPVR rotates downward/right (shallower slope)
- LV dilates (compensatory increase in preload/EDV)
- SV may be preserved initially but at a much higher filling pressure
- The loop shifts right along a normal EDPVR
Decreased Compliance (HFpEF)
- EDPVR shifts upward - higher pressure for any given volume
- Loop height increases (more pressure required to achieve same EDV)
- EF may be preserved but filling pressures are elevated
LV-Arterial Coupling
- Optimal coupling (maximum efficiency): E_es / E_a ≈ 1
- In HFrEF: E_es/E_a < 1 (depressed contractility + vasoconstriction)
- In HFpEF: E_es/E_a > 1 (systolic stiffening predominates)
- EF is mathematically related to this ratio: EF/(1-EF) = E_es/E_a, so an EF of 50% implies ideal coupling
Indices of Contractility Derived from P-V Analysis
| Index | Method | Advantage | Limitation |
|---|---|---|---|
| E_es (ESPVR slope) | Slope of ESPVR across varying loads | Load-independent, gold standard | Requires multiple beats at different preloads (e.g., IVC occlusion) |
| SW-EDV relation (preload recruitable SW, M_sw) | Slope of SW vs. EDV | Highly linear, afterload-independent, size-independent | Integrates systolic + diastolic events |
| dP/dt_max | Peak rate of LV pressure rise | Sensitive to acute changes | Preload-dependent, requires invasive measurement |
| EF, FAC, FS | Ejection-phase indices | Noninvasive (TEE, echo) | Load-dependent, afterload sensitive |
Clinical Applications (from Kaplan Cardiac Physiology)
- Cardiac anesthesia monitoring: Conductance catheters or real-time TEE allow P-V framework application intraoperatively
- HFrEF vs HFpEF distinction: A depressed ESPVR slope (reduced E_es) signals HFrEF; an upward-shifted EDPVR signals HFpEF. Both can coexist
- Myocardial ischemia: Regional ischemia causes the P-V loop to tilt and collapse - aneurysmal systolic lengthening appears as a rightward expansion of the loop in the ischemic zone
- Pericardial disease: Tamponade shifts the EDPVR upward (parallel shift), restricting filling
- Volatile anesthetics: Cause dose-dependent depression of E_es and reduction of SW/PVA, worsening LV-arterial coupling at higher MAC concentrations
- Vasodilators in HFrEF: Reduce E_a, restore E_es/E_a toward unity, increase SV; effective because the ESPVR slope is shallow
- Vasodilators in HFpEF: Cause marked hypotension with minimal SV gain because the steep ESPVR means the ventricle is resistant to volume unloading
Diastolic Function Assessment with P-V Loops
- Isovolumic relaxation - quantified by the time constant τ (tau); increased τ = delayed relaxation (ischemia, hypertrophy)
- Early filling - assessed by the rate of EDPVR traversal; impaired relaxation or reduced compliance slows this
- Atrial systole - the "A" loop in LA P-V analysis; contributes 15-25% of LV stroke volume under normal conditions