
Short qrs comples with s depressed and t elevated above 2 boxes
hyperkalemia ECG tall peaked T waves short QRS
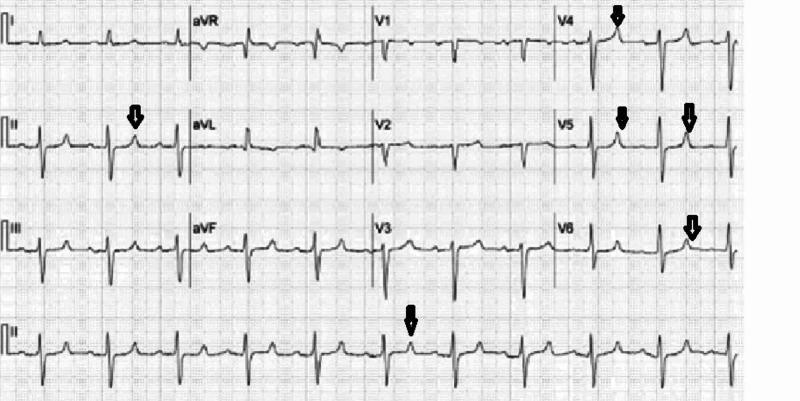
This diagnostic image is a standard 12-lead electrocardiogram (ECG) displayed on a traditional grid background. The tracing demonstrates a sinus rhythm with a key finding of tall, peaked T-waves, highlighted by black downward-pointing arrows in several leads. These hyperacute T-waves are most prominent in the precordial leads V3, V4, and V5, as well as limb lead II, exhibiting high amplitude and a symmetrical, narrow-based morphology (tent-shaped). The QRS complexes appear relatively narrow without significant widening, and the P-waves are visible, suggesting normal atrial depolarization. The ST-segments remain largely isoelectric. This visual presentation is a classic educational example of early ECG manifestations associated with hyperkalemia, which can progress to more severe conduction abnormalities. The image is highly relevant for medical students and clinicians in cardiology, nephrology, and emergency medicine for recognizing electrolyte-induced cardiac electrical disturbances.
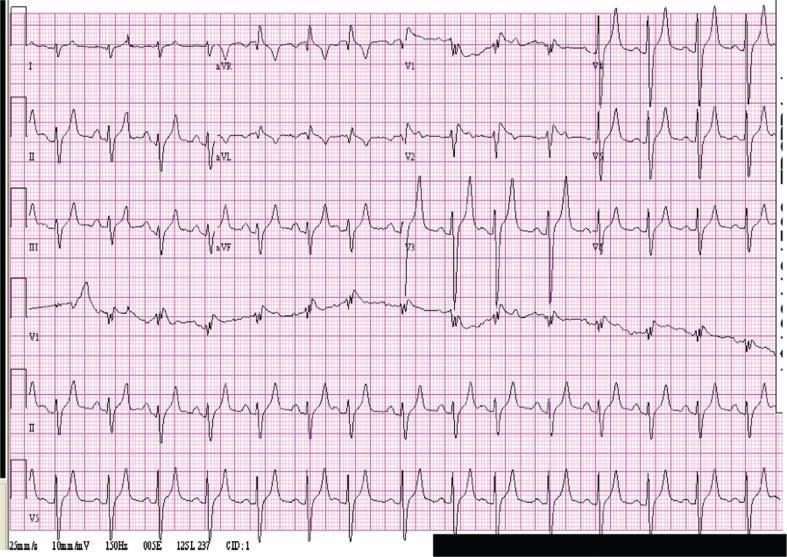
This diagnostic image is a 12-lead electrocardiogram (ECG) demonstrating classic features of severe hyperkalemia in a patient with a serum potassium level of 8.0 mEq/L. The tracing shows prominent, tall, and peaked T-waves, most notable in the precordial leads V2 through V5 and inferior leads II, III, and aVF. These T-waves exhibit a characteristic 'tent-like' morphology with a narrow base and sharp peaks. Additionally, the ECG reveals widening of the QRS complexes, which is particularly evident in leads V1 to V3, indicating delayed intraventricular conduction. There is also an apparent flattening or absence of P-waves, a common finding as hyperkalemia progresses toward a sinoventricular rhythm. This visual represents a critical electrolyte emergency requiring immediate clinical intervention to prevent cardiac arrest. It serves as a classic educational example for medical students and clinicians to recognize the progression of hyperkalemic cardiotoxicity.
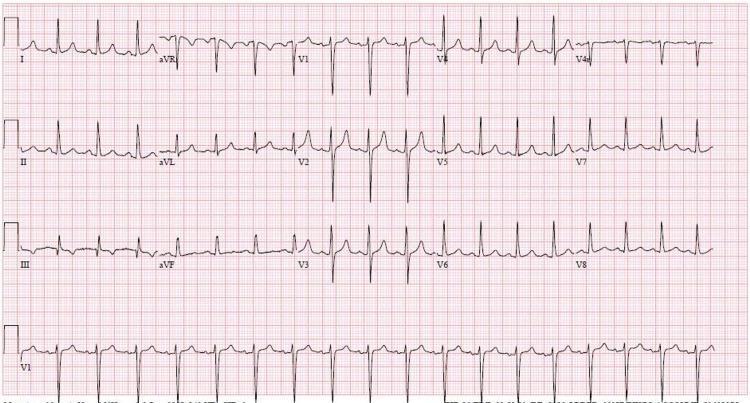
A 12-lead electrocardiogram (ECG) displayed on a standard red grid background. The tracing demonstrates sinus tachycardia, characterized by a heart rate exceeding 100 beats per minute with regular P-wave intervals preceding each QRS complex. A critical diagnostic feature is the presence of tall, 'peaked' or 'tented' T waves, particularly prominent in the precordial leads (V1-V8). These T waves exhibit high amplitude, a narrow base, and a symmetrical, sharp apex, which are classic electrographic manifestations of hyperkalemia. The QRS complexes appear relatively narrow, and the ST segment is essentially isoelectric. The limb leads (I, II, III, aVR, aVL, aVF) also show upright T waves, though they are less pronounced than those in the anterolateral distribution. This ECG is a key educational resource for identifying the cardiovascular effects of electrolyte imbalances, specifically severe hyperkalemia in the context of renal insufficiency and metabolic acidosis.
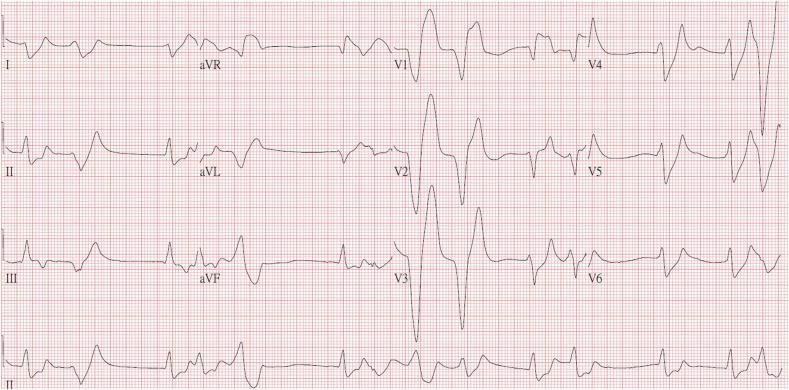
This diagnostic image is a 12-lead electrocardiogram (ECG) demonstrating classic features of severe hyperkalemia. The tracing shows a generalized wide-complex arrhythmia with significant widening of the QRS complexes across all leads. A hallmark finding is the presence of tall, narrow-based, 'peaked' T waves, most prominent in the precordial leads V2, V3, and V4. There is a noticeable absence of clearly defined P waves, suggesting a sinoventricular rhythm or atrial standstill, which is characteristic of high serum potassium levels. The QRS morphology in the precordial leads is highly distorted, showing increased amplitude and a sine-wave-like appearance in certain segments, particularly in V2 and V3. These visual findings correlate with severe metabolic derangement, such as a potassium level of 9.2 mmol/L, and represent a critical clinical state with high risk for progression to ventricular fibrillation or asystole. The image serves as a definitive educational example of the progressive ECG changes seen in life-threatening hyperkalemia.
ECG Pattern: Short QRS + Depressed ST + Tall T Wave (>2 small boxes / >0.5 mV)
Most Likely Diagnosis: Early/Mild Hyperkalemia
Why This Pattern Occurs
- Tall, peaked, symmetric ("tented") T waves - the earliest and most characteristic finding
- T wave amplitude > 2 small boxes (>0.5 mV), often tall and narrow-based
- The QRS is still narrow at this stage (widening only occurs with K+ >7.5 mEq/L)
- ST segment changes (depression) can accompany the repolarization abnormality
Progressive ECG Changes in Hyperkalemia
| K+ Level | ECG Finding |
|---|---|
| 5.5-6.5 mEq/L | Tall, peaked, tented T waves (your finding) |
| 6.5-7.5 mEq/L | Prolonged PR interval, P wave flattening/loss |
| >7.5 mEq/L | QRS widening |
| >9.0 mEq/L | Sine-wave pattern → VF/Asystole |
Key ECG Features of Hyperkalemic T Waves
- Narrow base (distinguishes from normal or LVH-related tall T waves)
- Symmetric (unlike the asymmetric T of ischemia)
- Tall amplitude (>0.5 mV precordial, >0.6 mV limb leads by some criteria)
- Tent-shaped or "peaked" morphology
- Most prominent in precordial leads V2-V5
Differential Diagnosis
- Hyperacute T waves of STEMI - seen within minutes of coronary occlusion; accompanied by ST elevation (not depression), territorial distribution (e.g., all inferior or all anterior leads), and clinical chest pain
- Early repolarization - benign variant, typically younger patients, notch at J-point, no ST depression
- Left ventricular hypertrophy - tall T in leads V1-V2 with deep S waves
Immediate Action
- Stat serum potassium (basic metabolic panel)
- 12-lead ECG (full assessment)
- If K+ confirmed elevated:
- IV Calcium gluconate (membrane stabilization - first line)
- Insulin + dextrose (shift K+ intracellularly)
- Sodium bicarbonate (if acidotic)
- Kayexalate / patiromer / SPS (eliminate K+)
- Dialysis (if severe/refractory)
ECG Image Reference