
Use of William en toine's law.
Antoine equation uses vapor pressure temperature chemical engineering
- (P) = vapour pressure
- (T) = temperature
- (A, B, C) = Antoine constants specific to the substance and unit system
- Estimating vapour pressure in distillation, evaporation, drying, and condensation.
- Calculating boiling point at atmospheric or reduced pressure.
- Performing vapour-liquid equilibrium calculations for chemical-process design.
- Choosing vacuum conditions for laboratory or industrial evaporation.
Use of William enthuwian's law in ECG.
Einthoven triangle ECG limb leads diagram
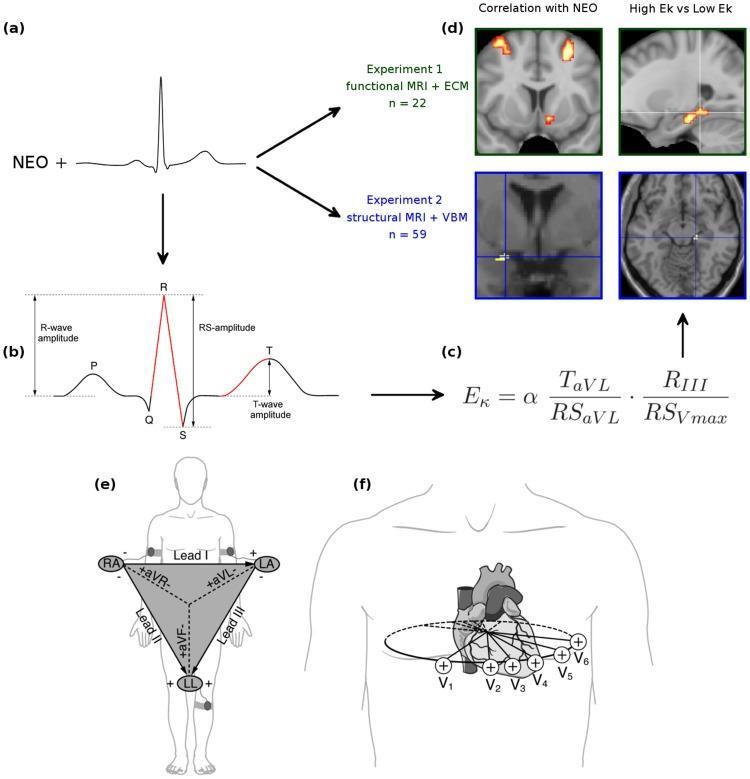
This composite educational infographic illustrates the methodology for correlating cardiac electrophysiology with neuroimaging. Panel (b) features a detailed ECG waveform diagram labeling the P-wave, QRS complex, and T-wave. It highlights measurement parameters including R-wave amplitude (baseline to peak), RS-amplitude (R-peak to S-nadir), and T-wave amplitude (plateau to peak). Panel (c) shows a mathematical formula for 'Ek', a cardiac amplitude signature derived from specific leads (aVL, III, and Vmax). Panels (e) and (f) depict standard 12-lead ECG electrode placement: the frontal plane limb leads (I, II, III, aVR, aVL, aVF) are arranged in Einthoven’s Triangle, while the horizontal plane precordial leads (V1-V6) are shown oriented across the chest wall. Panel (d) displays functional and structural neuroimaging results, specifically Eigenvector Centrality Maps and Voxel-Based Morphometry, showing significant activity and structural volume differences in the hippocampal subiculum correlated with the Ek cardiac index. The content integrates cardiology, neuroimaging (fMRI/MRI), and psychology to explore biomarkers for emotional personality.
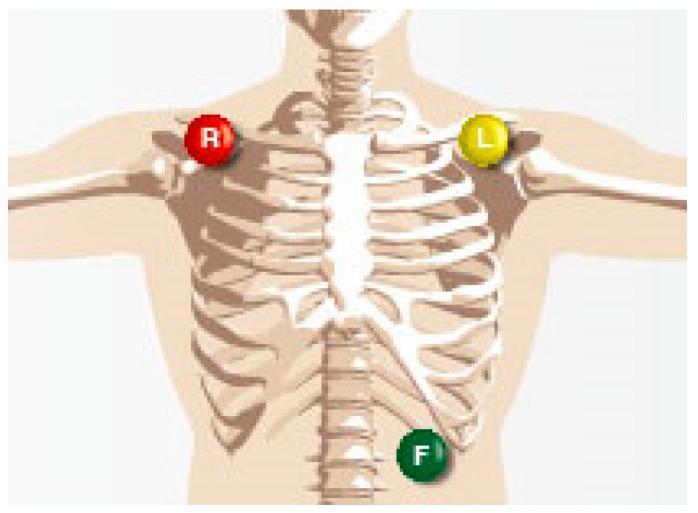
This anatomical diagram illustrates a standard 3-lead electrocardiogram (ECG) electrode placement configuration on a human torso. The visual focuses on the skeletal and surface anatomy to define precise lead locations. A red electrode, labeled 'R', is positioned on the right infraclavicular fossa near the right shoulder. A yellow electrode, labeled 'L', is placed in a mirroring position on the left infraclavicular fossa. A third green electrode, labeled 'F', is situated on the lower left abdomen, typically above the left iliac crest or inferior to the costal margin. This configuration represents the three primary limb leads (Leads I, II, and III) based on Einthoven's Triangle, used for monitoring cardiac electrical activity and heartbeat signals. The use of color-coding and alpha-labeling (Right, Left, Foot) serves as an educational guide for medical students and clinicians to ensure proper lead attachment in diagnostic and monitoring settings.
Einthoven law electrocardiography
Einthoven's law ECG limb leads equation clinical use
https://cvphysiology.com/arrhythmias/a013a
- Lead I: left arm minus right arm
- Lead II: left leg minus right arm
- Lead III: left leg minus left arm
Uses in ECG
-
Check the internal consistency of the three limb-lead recordings
At any instant, the algebraic voltage in Lead II should equal the sum of voltages in Leads I and III. The sign matters: a negative deflection must be treated as negative.Example: if Lead I is (+0.4) mV and Lead III is (+0.2) mV, Lead II should be (+0.6) mV. -
Identify technical problems
A marked failure of this relationship can suggest recording artifact, a poor electrode connection, or limb-electrode misplacement. It is a supplementary technical check, not a standalone diagnostic test. -
Understand the frontal-plane limb leads and cardiac vectors
It helps explain why Leads I, II, and III view cardiac electrical activity from different directions. This underlies assessment of the frontal QRS axis, though axis determination in practice uses the full limb-lead set, especially Leads I and aVF. -
Derive a missing bipolar limb-lead voltage conceptually
If two simultaneous bipolar limb-lead potentials are known, the third can be calculated. Modern ECG machines record all 12 leads, so this is mainly useful for teaching and for understanding ECG physics.
Explain me in detail about millivolt, ampere, ohm of ECG machine and its lead and how they are used and how they are placed about it, everything.
- Basic electricity: voltage (millivolt), current (ampere), resistance/impedance (ohm), and why ECG records voltage rather than heart current.
- How an ECG machine works: electrodes, lead wires, differential amplifier, filters, calibration, paper speed, and safety.
- Electrodes versus leads: the important difference between the stickers on the body and the electrical “views” of the heart.
- Limb leads: Leads I, II, III, aVR, aVL, and aVF, including Einthoven’s triangle and axes.
- Chest leads: V1 to V6, exact anatomical placement and what areas of the heart they view.
- Practical placement and errors: skin preparation, color conventions, reversed electrodes, artifact, and common mistakes.
- Reading the tracing: P wave, QRS complex, T wave, standard calibration, and basic measurements.
Explain ECG millivolts, amperes, and ohms with examples
electrocardiography electrode impedance
ECG standardization 10 mm 1 mV 25 mm second electrode impedance official guidance
First: what an ECG actually measures
1. Volt and millivolt (mV): the main ECG unit
Meaning
What voltage means in an ECG
Standard ECG calibration
| ECG height | Actual voltage |
|---|---|
| 1 mm, one small vertical square | 0.1 mV |
| 5 mm | 0.5 mV |
| 10 mm, two large vertical squares | 1 mV |
| 20 mm | 2 mV |
Example 1: QRS amplitude
- R wave = (+15) mm = (+1.5) mV
- S wave = (-3) mm = (-0.3) mV
- Net QRS amplitude = (1.5 - 0.3 = +1.2) mV
Why mV matters clinically
- Low-voltage QRS complexes, which can occur in conditions such as large pericardial effusion, obesity, COPD/emphysema, or hypothyroidism. Interpretation always needs clinical context.
- High QRS voltage, one possible ECG feature of ventricular hypertrophy.
- ST-segment elevation or depression, measured in millimetres or mV from the isoelectric baseline.
2. Ampere (A): electrical current
Meaning
- (I) = current in amperes
- (Q) = charge in coulombs
- (t) = time in seconds
What current means in the heart
- Sodium ((\text{Na}^+))
- Calcium ((\text{Ca}^{2+}))
- Potassium ((\text{K}^+))
- Chloride ((\text{Cl}^-))
Does an ECG machine send current into the patient?
- Pacemaker: deliberately delivers electrical impulses to stimulate the heart.
- Defibrillator: delivers a large, controlled electrical shock to terminate certain dangerous arrhythmias.
- Electrocautery/diathermy: intentionally passes high-frequency current through tissue.
- ECG: records the heart’s naturally occurring surface voltage signal.
Example 2: why current is not printed on the ECG
- direction of the heart’s electrical vector
- position of the heart in the chest
- tissue conductivity
- skin and electrode contact
- body size
- distance from heart to electrodes
- the particular lead being viewed
3. Ohm (Ω): resistance and impedance
Meaning
- (V) = voltage in volts
- (I) = current in amperes
- (R) = resistance in ohms
Simple numerical example
4. Resistance versus impedance in ECG
The electrode-skin interface
- baseline wander
- movement artifact
- 50/60-Hz mains interference
- intermittent or noisy trace
- distortion of small waves such as P waves
- unreliable ST-segment measurement
5. Example: why skin preparation improves an ECG
Practical steps
- Explain the procedure and ensure the patient is relaxed.
- Expose the required areas.
- Clean oil, sweat, and lotion from the skin.
- Dry the area.
- Clip excessive hair if it prevents adhesive contact. Do not shave more than needed.
- Apply fresh electrodes firmly to intact skin.
- Ask the patient to lie still, avoid talking, and relax the arms and legs.
Example 3: artifact from poor contact
- patient movement or shivering
- loose electrode
- dried-out electrode gel
- poor skin contact
- cable movement
- nearby electrical interference
6. How voltage, current, and resistance relate to ECG
| Quantity | Unit | Meaning in ECG |
|---|---|---|
| Voltage | volt, usually mV | The primary ECG measurement: electrical-potential difference detected between electrode sites |
| Current | ampere, mA, µA | Ionic current in heart cells generates the electrical field; the ECG does not normally display a current measurement |
| Resistance/impedance | ohm, kilo-ohm (kΩ) | Opposition at the skin-electrode interface; high or imbalanced values degrade tracing quality |
A useful analogy
- Voltage: water pressure difference
- Current: amount of water flowing per second
- Resistance: narrowing or blockage of the pipe
- ECG: mainly measures the “pressure difference” at different points on the body surface, not the amount of water flowing through the pipe.
7. Why an ECG machine needs a high input impedance
8. The 1 mV calibration mark
Example 4: altered gain
Key points to remember
- Millivolt (mV) is the central ECG amplitude unit.
- At normal calibration, 1 mV equals 10 mm vertically on ECG paper.
- Ampere measures current. Cardiac ionic currents cause electrical activity, but a routine ECG mainly records resulting surface voltage differences.
- Ohm (Ω) measures resistance. In ECG, skin-electrode impedance strongly affects signal quality.
- Good skin contact, correct electrode placement, patient stillness, and proper calibration are necessary for a reliable ECG.
- An ECG is a voltage-recording device, unlike a defibrillator or pacemaker, which intentionally deliver electrical energy.