
Symptoms of heartattack
heart attack myocardial infarction symptoms diagram
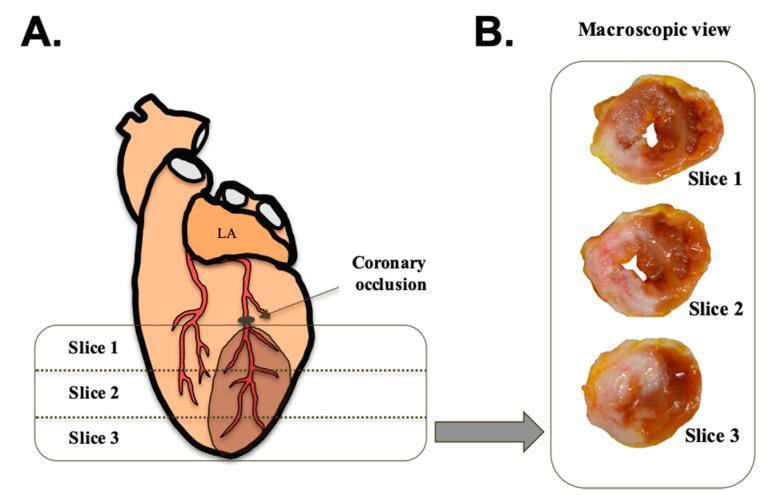
This medical figure illustrates the methodology and visual findings of an experimental myocardial infarction model. Panel A is an anatomical diagram showing a heart with a coronary occlusion placed on a coronary artery distal to the left atrium (LA). A shaded brown region extending inferiorly from the occlusion site represents the infarcted area. The diagram indicates the levels of three transverse ventricular sections labeled Slice 1, Slice 2, and Slice 3. Panel B displays corresponding macroscopic clinical photographs of these three cross-sectional heart slices stained with thioflavin-S under white light. The macroscopic view demonstrates the progression of tissue damage: Slice 1 (proximal) shows a localized area of pale, healthy tissue alongside darker necrotic regions; Slice 2 and Slice 3 (distal) exhibit increasingly larger areas of dark, necrotic tissue, indicating the transmural extent of the infarction throughout the left ventricle. This material is designed for cardiovascular pathology education, specifically illustrating the spatial relationship between arterial ligation and the resulting downstream myocardial necrosis.
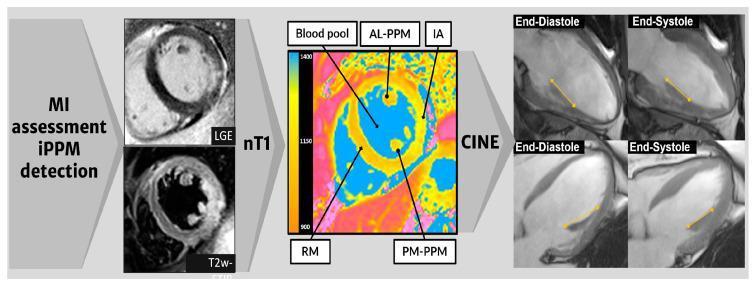
Educational diagram illustrating a Cardiac Magnetic Resonance (CMR) image analysis workflow for myocardial infarction (MI) assessment and infarcted papillary muscle (iPPM) detection. The figure is organized into three sequential sections from left to right. The first section displays short-axis views using Late Gadolinium Enhancement (LGE) and T2-weighted (T2w-) sequences to visualize myocardial tissue characterization. The central section features a native T1 (nT1) map with segmented regions of interest (ROIs) labeled: Blood Pool (BP), Anterolateral Papillary Muscle (AL-PPM), Posteromedial Papillary Muscle (PM-PPM), Infarcted Area (IA), and Remote Myocardium (RM). A color scale bar indicates nT1 values ranging from 900 to 1400 ms. The right section displays CINE long-axis sequences in two-chamber (upper) and four-chamber (lower) views, comparing the left ventricle at end-diastole and end-systole. Yellow calipers measure longitudinal strain, demonstrating ventricular contraction. This composite image serves to teach multimodal CMR techniques for evaluating ischemic heart disease and papillary muscle involvement.
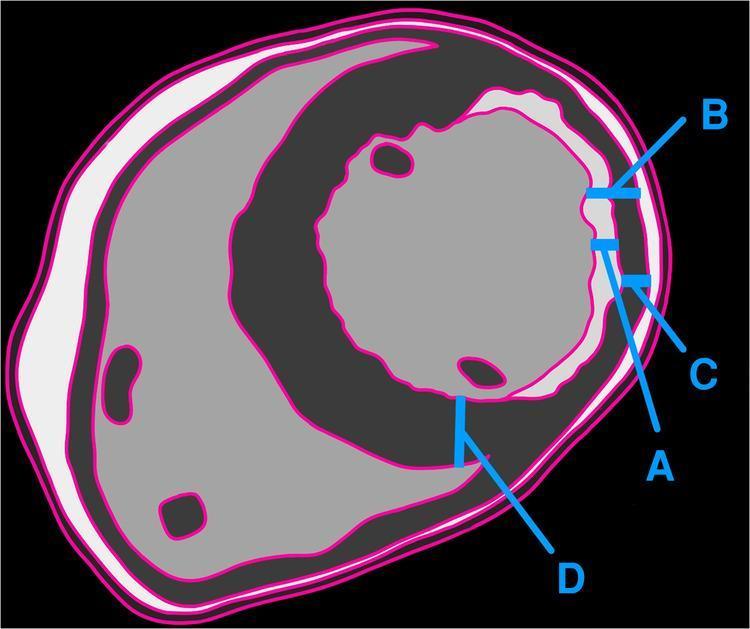
A cross-sectional anatomical diagram illustrating the quantification of myocardial viability and remodeling following chronic infarction. The image depicts a transverse slice of the heart with specialized labeling of myocardial layers. Segment A represents the area of late gadolinium enhancement (LGE) or fibrosis, appearing as a light grey/white subendocardial layer. Segment B shows the full transmural thickness of the remodeled, thinned myocardium. Segment C highlights the remaining non-enhancing, viable myocardium in the infarcted zone. Segment D serves as a control, representing the full thickness of adjacent healthy, non-remodeled myocardium. The diagram contrasts two methodologies for surgical candidacy: the traditional approach (C/B ratio) versus the authors' proposed approach (C/D ratio) for assessing transmurality. The use of different grey scales and blue calipers demonstrates the morphological changes associated with chronic myocardial thinning, providing a visual guide for risk stratification and determining viability prior to coronary artery bypass grafting (CABG).
Summary : This illustration explains myocardial infarction (heart attack), showing the anatomical location of a blocked artery and the resulting muscle damage in the heart. illustration: Scene Overview : • Main subject is a human heart, depicted in color with visible coronary arteries. • An inset magnifies a section of an artery, highlighting a blockage (occlusion) within the vessel. • The area of muscle damage on the heart is labeled. • Text labels include "Myocardial Infarction," "Block in Artery," "Muscle Damage," and "Heart Attack." • The color palette uses reds, yellows, and purples to differentiate blood vessels, muscle, and damaged areas. Technical Details : • No scale bar or magnification is provided. • The illustration is schematic, not a real photograph or scan. • Labels are overlaid directly on the image for clarity. Spatial Relationships : • The blocked artery is shown in close-up in the inset, with a clear connection to the affected region of the heart muscle. • The muscle damage is localized to a specific area of the heart, corresponding to the blocked artery. Analysis : • The figure visually links a blocked coronary artery to localized muscle damage in the heart, illustrating the pathophysiology of myocardial infarction (heart attack). • The inset clarifies the cause (arterial blockage) and its effect (muscle damage), supporting understanding of the condition.
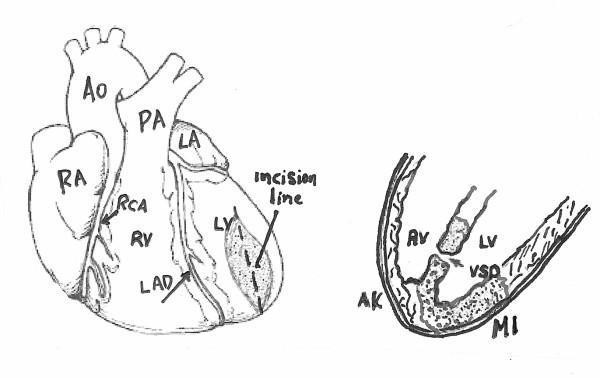
This medical illustration consists of two diagrams depicting cardiac anatomy and pathology associated with myocardial infarction and surgical intervention. The left panel shows an anterior view of the heart with major structures labeled: Right Atrium (RA), Right Ventricle (RV), Left Atrium (LA), Left Ventricle (LV), Aorta (Ao), and Pulmonary Artery (PA). The coronary vasculature is highlighted, specifically the Right Coronary Artery (RCA) and Left Anterior Descending (LAD) artery. An 'incision line' is indicated on the apex of the left ventricle over a shaded area representing infarcted tissue. The right panel is a cross-sectional diagram focusing on the ventricular chambers. It illustrates a Ventricular Septal Defect (VSD), which is a communication between the left and right ventricles. Also labeled are the Aortic Valve (AV), an area of Myocardial Infarction (MI) in the ventricular wall, and adjacent Akinetic (AK) tissue. The illustration serves to demonstrate the anatomical location for a ventriculotomy used to repair post-infarction ventricular septal rupture.
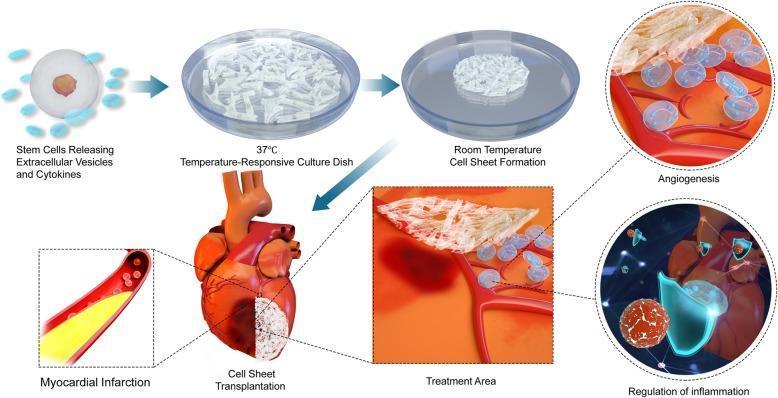
This pathophysiology diagram illustrates the process of cell sheet engineering for myocardial repair in ischemic heart disease. The multi-stage flowchart begins with stem cells releasing extracellular vesicles and cytokines. These cells are cultivated in a 37°C temperature-responsive culture dish, transitioning to room temperature to facilitate cell sheet formation. The resulting biological scaffold is then transplanted onto a heart with a white-shaded area representing myocardial infarction. Magnified 'Treatment Area' views detail the therapeutic mechanisms: Angiogenesis, showing the interaction between the fibrous cell sheet, transparent vesicles/cells, and the underlying vasculature; and Regulation of Inflammation, depicting immune cells and molecular signaling at the transplant site. This infographic summarizes stem cell-based regenerative therapy, focusing on paracrine signaling, tissue engineering, and vascularization strategies for treating damaged cardiac tissue.
Symptoms of a Heart Attack (Myocardial Infarction)
Classic (Typical) Symptoms
| Symptom | Description |
|---|---|
| Chest pain / pressure | The hallmark symptom - central, squeezing, crushing, or heavy pressure "like an elephant sitting on the chest." Can be dull, tight, or burning. |
| Radiation of pain | Spreads to the left arm, both arms, left shoulder, jaw, neck, or back |
| Shortness of breath | Dyspnea at rest or with minimal exertion |
| Diaphoresis | Cold, clammy sweating (more common in men) |
| Nausea and/or vomiting | Often accompanies the chest pain |
| Lightheadedness / dizziness | Feeling faint or pre-syncopal |
| Pallor | Becoming pale due to reduced cardiac output |
According to Park's Textbook of Preventive and Social Medicine: The core symptoms are pain or discomfort in the center of the chest; pain in the arms, left shoulder, elbows, jaw, or back; difficulty breathing; feeling sick or vomiting; feeling light-headed; cold sweats; and pallor.
Atypical ("Silent") Presentations - Very Common
- Dyspnea alone (without chest pain) - carries a 4x higher risk of sudden cardiac death
- Nausea and epigastric discomfort (can mimic indigestion or "stomach pain," especially in inferior MIs)
- Generalized weakness or fatigue
- Lightheadedness or sudden change in mental status
- Palpitations (ischemia causes arrhythmias)
- Jaw, neck, shoulder, or back pain without chest pain
- Stabbing or "sharp" pain - 22% of AMI patients in the Multicenter Chest Pain Study described their pain this way
Symptoms More Common in Women
- Shortness of breath
- Nausea and vomiting
- Back or jaw pain
- Pain unrelated to exertion
- Pain not relieved by rest or nitroglycerin
- Fatigue as the chief complaint
- Palpitations without chest pain
Who Is at Higher Risk of Atypical Presentation?
- Women
- Elderly patients
- Diabetics (autonomic neuropathy blunts pain perception)
- Racial minorities
- Patients with psychiatric illness or altered mental status
- Those using alcohol, cocaine, or multiple medications
Key Warning Signs - Act Immediately
- Pain or pressure in the center of the chest
- Pain spreading to arms, shoulder, jaw, or back
- Shortness of breath
- Cold sweats, nausea, or lightheadedness
- Sudden pallor or weakness
How to differentiate with acidity
Heart Attack vs. Acidity - How to Tell Them Apart
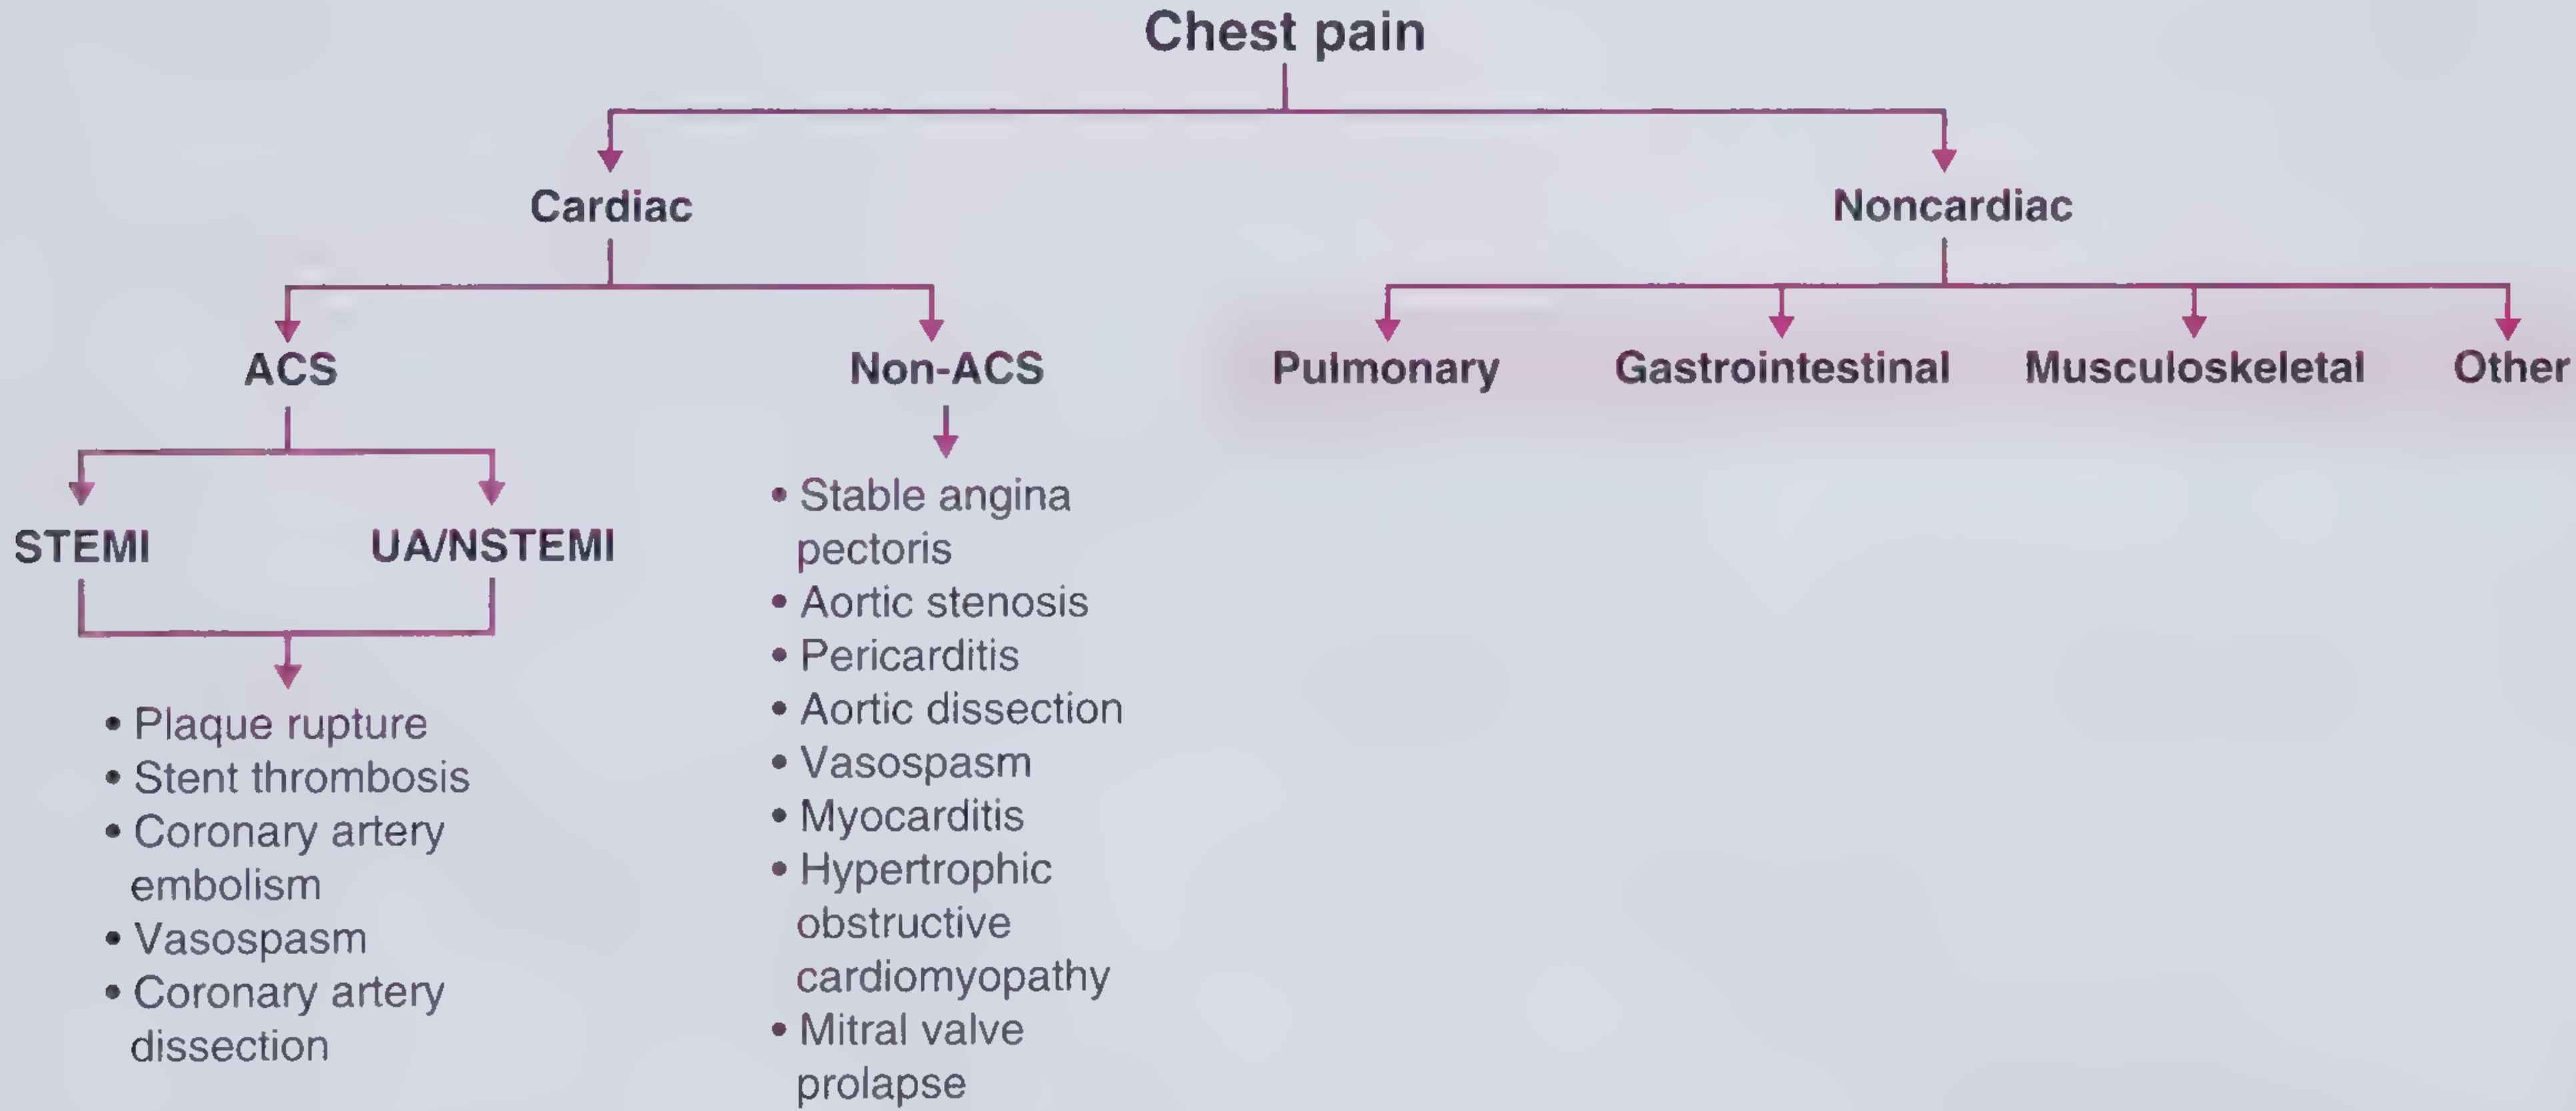
Why This Is Genuinely Difficult
Side-by-Side Comparison
| Feature | Heart Attack (MI) | Acidity / GERD |
|---|---|---|
| Pain character | Pressure, squeezing, crushing, heaviness | Burning, gnawing, sometimes sharp |
| Location | Central/retrosternal, diffuse | Central chest, epigastric (upper abdomen), behind breastbone |
| Radiation | Left arm, both arms, jaw, neck, back | Usually stays in chest/upper abdomen; rarely radiates |
| Onset trigger | Physical exertion, emotional stress, cold, sexual activity | Eating, lying down after meals, bending forward, spicy/fatty foods |
| Timing | Can occur at rest, sudden onset; waxing and waning | After meals; worsens when lying flat or bending; typically not at peak exertion |
| Night-time pattern | Can wake patient (unstable angina / ACS) | Often wakes patient around 1-3 AM (peak gastric acid secretion) |
| Duration | Minutes to hours; doesn't fully go away with antacids | Variable; tends to be more chronic/recurrent |
| Antacid response | Does NOT reliably relieve it (critical point!) | Often improves, though relief may be short-lived |
| Associated symptoms | Sweating (diaphoresis), shortness of breath, nausea, dizziness, pallor | Sour/bitter taste in mouth (water brash), burping, regurgitation, heartburn |
| Posture effect | Not affected by posture | Worse lying flat, better sitting up |
| Swallowing | Not related | Pain may be provoked by swallowing |
| Relief with activity | Worsens with exertion | Not related to exertion |
The Most Important Clinical Clues
- Diaphoresis (cold sweating) along with chest pain
- Pain radiating to the left arm or jaw
- Associated breathlessness
- Onset during physical exertion
- No relief with antacids
- Nausea/vomiting with inferior MI (mimics stomach upset - this is a trap!)
- Feeling of impending doom
- Clear relationship to meals or posture
- Burning quality, sour/acidic taste in the mouth
- Relief with antacids (though not 100% reliable)
- Pain worsened by lying down
- Chronic, recurrent history of similar episodes
- No sweating or breathlessness
The "Antacid Relief" Trap
When to Seek Emergency Care Immediately
- Chest pain or pressure lasting more than a few minutes
- Pain spreading to the arm, jaw, or back
- Sweating along with chest discomfort
- Shortness of breath
- First-ever episode of this type of pain
- Any chest pain with risk factors (age >40, diabetes, hypertension, smoking, family history)
How Doctors Confirm the Diagnosis
- ECG - ST elevation (STEMI) or ST/T wave changes strongly suggest MI
- Troponin blood test - rises within 3-6 hours of MI, the most specific marker of cardiac muscle damage
- Serial tests - troponin levels measured 3-6 hours apart to detect a "rise and fall" pattern
- Response to PPI/antacid - if troponins and ECG are normal, a trial of a proton pump inhibitor (PPI) helps diagnose GERD