
Oxygen dissociation curve with detailed explanation. Right shift and left shift of the curve causes...
Reading File
Now let me search for oxygen dissociation curve content in the medical library in parallel:
Finding Sources
Finding Sources
Excellent results. Now let me read the key sections in parallel - Guyton & Hall, Lippincott Biochemistry, and Fishman's Pulmonary:
Reading File
Reading File
Reading File
Excellent content. Let me now fetch the key images and also read the Guyton BPG section and the Mulholland factors table:
Loading Image
Reading File
Reading File
Now let me fetch the Guyton shift curve image and get the Lippincott 2,3-BPG and Bohr effect details:
Loading Image
Reading File
Now let me get the 2,3-BPG mechanism and fetal Hb content from Lippincott and the fetal ODC image:
Reading File
Finding Sources
I now have comprehensive content. Let me compile the full, detailed answer.
Oxygen Dissociation Curve (ODC) - Complete Explanation
What Is the ODC?
The oxygen dissociation curve (also called the oxygen-hemoglobin dissociation curve) describes the relationship between the partial pressure of oxygen (PO2) and the percentage saturation of hemoglobin with oxygen (or oxygen content of blood). It tells us how readily hemoglobin picks up and releases oxygen.
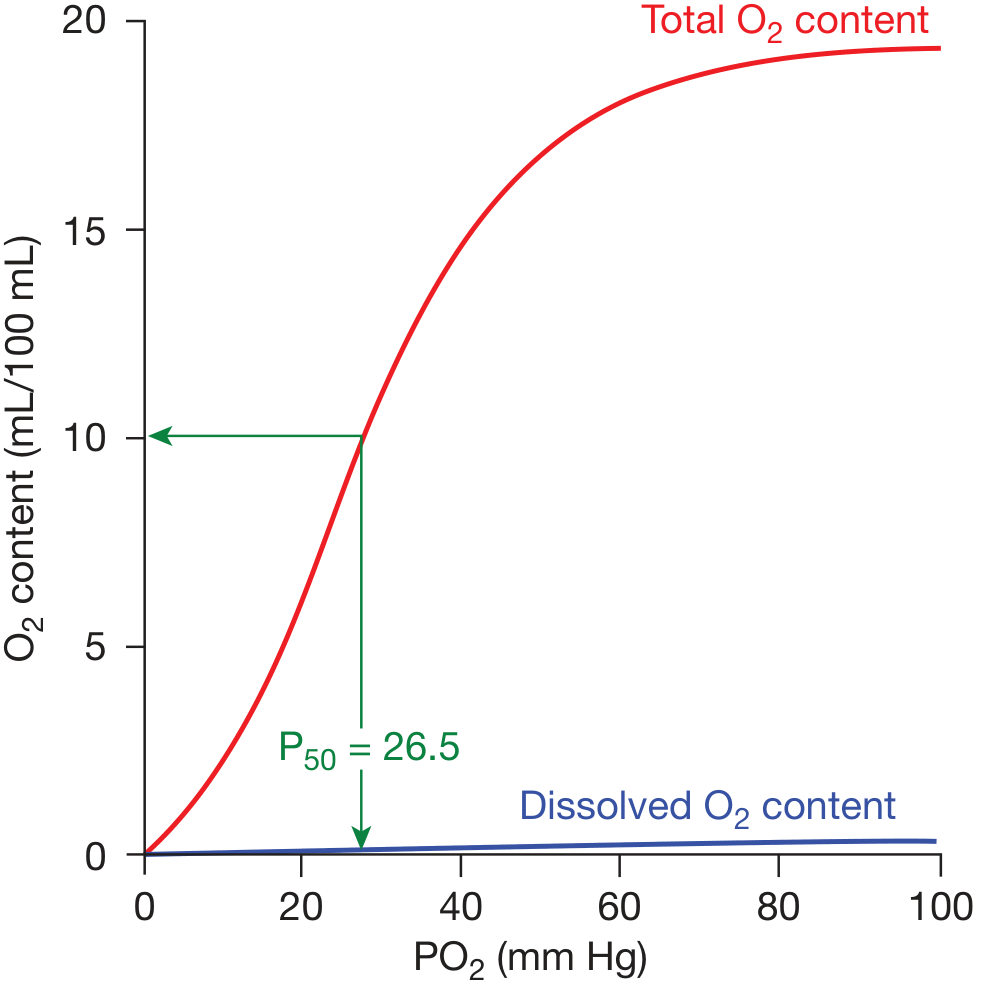
The standard ODC at pH 7.40, 37°C. The red line = total O2 content bound to hemoglobin; blue line = dissolved O2 (negligible). P50 = 26.5 mm Hg. - Fishman's Pulmonary Diseases and Disorders
Shape of the Curve: Why Sigmoidal?
The curve is S-shaped (sigmoidal), not hyperbolic. This is because hemoglobin has four subunits that bind O2 cooperatively:
- When the first O2 binds, it causes a conformational change in the hemoglobin tetramer, increasing the affinity of the remaining subunits.
- This cooperative binding means the affinity for the last O2 molecule bound is approximately 300 times greater than for the first.
- The net result: the curve is steep in the mid-range (20-60 mm Hg), which is physiologically ideal for O2 loading in the lungs and unloading in the tissues.
Compare this to myoglobin, which has a hyperbolic curve (single subunit, no cooperativity) and high O2 affinity throughout - myoglobin stores O2 in muscle but cannot release it efficiently to tissues the way hemoglobin does.
- Biochemistry, 8th ed. Lippincott Illustrated Reviews, p. 99-100
Key Reference Points
| Location | PO2 (mm Hg) | Hb Saturation |
|---|---|---|
| Alveoli (lungs) | ~100 | ~97-98% |
| Arterial blood | ~95-100 | ~97% |
| Mixed venous blood (rest) | ~40 | ~75% |
| Tissues (active) | ~20-40 | ~50-75% |
| P50 (normal) | 26.5 | 50% |
The P50 is the PO2 at which hemoglobin is 50% saturated. It is the single most important number for describing curve position:
- Normal P50 = 26.5 mm Hg
- Increased P50 = right shift (lower O2 affinity)
- Decreased P50 = left shift (higher O2 affinity)
Physiological Significance of the Sigmoidal Shape
Upper flat portion (60-100 mm Hg): Loading zone in the lungs.
- Even if alveolar PO2 drops from 100 to 60 mm Hg (e.g., with lung disease or altitude), hemoglobin remains ~89% saturated. This "safety buffer" protects against hypoxemia.
Steep middle portion (20-60 mm Hg): Unloading zone in tissues.
- Small drops in tissue PO2 cause large amounts of O2 to be released. This efficient delivery is what makes the sigmoidal shape so physiologically important.
- Fishman's Pulmonary Diseases and Disorders; Guyton and Hall Medical Physiology, p. 526
Factors Shifting the Curve
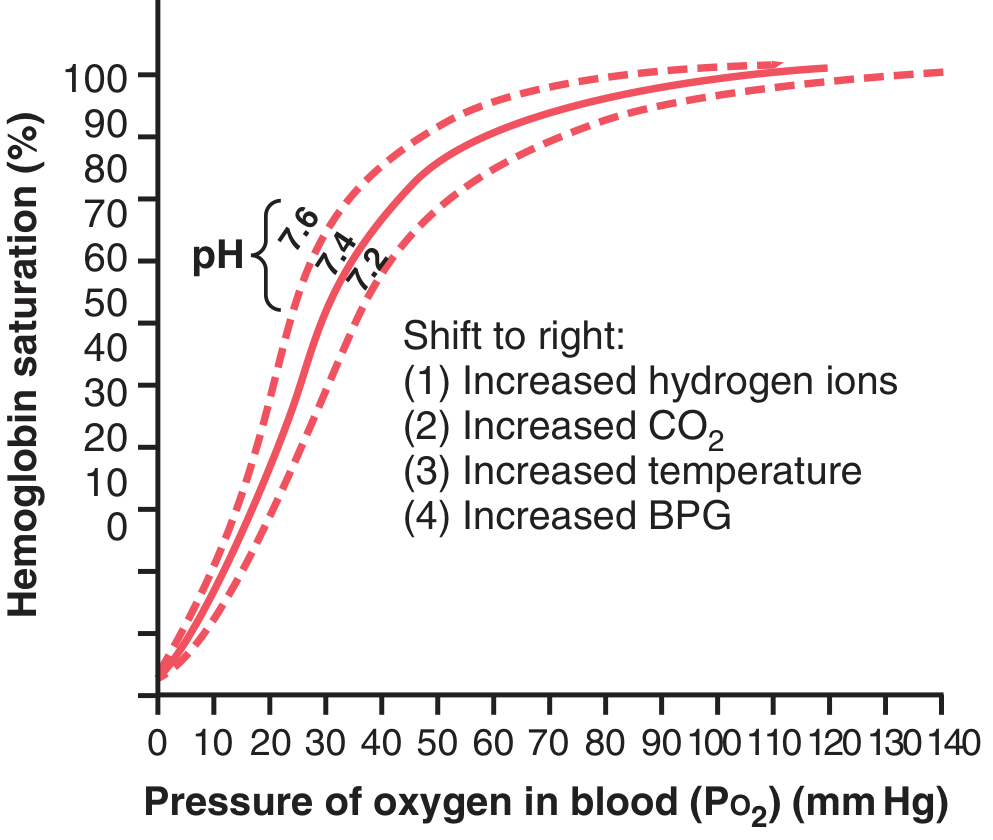
Guyton & Hall Textbook of Medical Physiology, Fig. 41.10 - Three curves showing pH 7.6 (left shift), 7.4 (normal), 7.2 (right shift), with factors causing right shift labelled.
RIGHT SHIFT of the ODC
Meaning: Decreased O2 affinity of hemoglobin → O2 is more easily released to tissues.
P50 increases (>26.5 mm Hg).
Causes (mnemonic: CADET, face RIGHT! - CO2, Acid/H+, DPG/2,3-BPG, Exercise, Temperature):
| Factor | Mechanism |
|---|---|
| ↑ CO2 (hypercapnia) | Bohr effect - CO2 forms carbamino compounds with Hb; also lowers pH |
| ↓ pH / ↑ H+ (acidosis) | Bohr effect - H+ stabilizes deoxy (T) form of Hb |
| ↑ 2,3-BPG (2,3-diphosphoglycerate) | Binds to beta chains of deoxy-Hb, stabilizes T form |
| ↑ Temperature | Weakens Hb-O2 bonds; occurs in febrile states, exercising muscle |
| Exercise | Combines all above: ↑CO2, ↑H+, ↑temperature, ↑2,3-BPG |
| Hypoxia (chronic) | ↑2,3-BPG production in RBCs as an adaptive response |
| Anemia | ↑2,3-BPG |
| High altitude (acclimatization) | ↑2,3-BPG (initially; acute hypoxia causes left shift via alkalosis) |
Clinical effect: At any given PO2, hemoglobin releases MORE O2 to tissues. This is beneficial during exercise or hypoxia, ensuring tissues get what they need.
- Guyton & Hall Medical Physiology, pp. 525-526
- Mulholland & Greenfield's Surgery, Table 10.6
LEFT SHIFT of the ODC
Meaning: Increased O2 affinity of hemoglobin → O2 is held more tightly, less released to tissues.
P50 decreases (<26.5 mm Hg).
Causes:
| Factor | Clinical Example / Mechanism |
|---|---|
| ↑ pH / ↓ H+ (alkalosis) | Stabilizes oxy (R) form of Hb |
| ↓ CO2 (hypocapnia) | e.g., hyperventilation |
| ↓ Temperature | Hypothermia; cold stored blood |
| ↓ 2,3-BPG | Stored (banked) blood - 2,3-BPG depletes within hours of storage |
| Fetal hemoglobin (HbF) | Gamma chains replace beta chains; gamma chains have lower affinity for 2,3-BPG → higher O2 affinity → left-shifted curve → allows HbF to take O2 from maternal HbA across placenta |
| Carbon monoxide (CO) poisoning | CO binds Hb with 200x affinity of O2; residual subunits bind O2 more tightly (carboxyhemoglobin left-shifts the remaining ODC) |
| Methemoglobin | Fe3+ cannot bind O2; remaining Fe2+ subunits have increased affinity |
| Hereditary high-affinity Hb variants | e.g., Hb Chesapeake, Hb Yakima, Hb Rainier - gamma/beta substitutions |
Clinical effect: At any given PO2, hemoglobin releases LESS O2 to tissues. Despite apparently normal SpO2, tissue hypoxia can occur (e.g., CO poisoning, stored blood transfusion).
- Quick Compendium of Clinical Pathology, 5th ed.
- Lippincott Biochemistry 8th ed., p. 104
- Mulholland & Greenfield's Surgery, Table 10.6
The Bohr Effect (Detail)
The Bohr effect specifically describes the pH/CO2 component of the ODC shift. In metabolically active tissues:
- Cells produce CO2, which diffuses into blood
- Carbonic anhydrase converts CO2 + H2O → H2CO3 → HCO3- + H+
- H+ lowers local pH → RIGHT shift → more O2 released to active tissues
- In the lungs, CO2 is exhaled → pH rises → LEFT shift → Hb picks up more O2
This elegant feedback loop means hemoglobin automatically delivers more O2 exactly where metabolism is highest.
Schematically: HbO2 + H+ ⇌ HbH + O2
- Lippincott Biochemistry 8th ed., pp. 103-104
The 2,3-BPG Effect
2,3-BPG (also written 2,3-DPG) is the most abundant organic phosphate in RBCs:
- Synthesized from 1,3-bisphosphoglycerate in glycolysis (the Rapoport-Luebering shunt)
- Binds exclusively to the central cavity formed by the two beta chains of deoxyhemoglobin
- Stabilizes the T (tense, deoxy) conformation → reduces O2 affinity → right shifts the curve
When 2,3-BPG levels increase:
- Chronic hypoxia (altitude, lung disease, anemia)
- Compensates by releasing O2 more easily at the same PO2
When 2,3-BPG is absent/low:
-
Stored blood: 2,3-BPG depletes within hours of storage → left-shifted ODC → paradoxical: blood transfused into a patient may not release O2 efficiently
-
Fetal Hb (HbF): Gamma chains cannot bind 2,3-BPG as well → HbF effectively has no 2,3-BPG effect → higher O2 affinity than adult HbA → left-shifted curve by ~6 mm Hg in P50 → allows O2 transfer from mother to fetus
-
Lippincott Biochemistry 8th ed., pp. 107-108
Quick Summary Table
| Parameter | Right Shift | Left Shift |
|---|---|---|
| O2 affinity | Decreased | Increased |
| P50 | >26.5 mm Hg | <26.5 mm Hg |
| O2 release to tissues | Enhanced | Reduced |
| pH | ↓ (acidosis) | ↑ (alkalosis) |
| CO2 | ↑ | ↓ |
| Temperature | ↑ | ↓ |
| 2,3-BPG | ↑ | ↓ |
| Special states | Exercise, fever, hypoxia, anemia | HbF, CO poisoning, stored blood, hypothermia |
Sources:
- Guyton & Hall Textbook of Medical Physiology, pp. 524-526
- Lippincott Illustrated Reviews: Biochemistry 8th ed., pp. 99-108
- Fishman's Pulmonary Diseases and Disorders
- Mulholland & Greenfield's Surgery 7e, Table 10.6
- Quick Compendium of Clinical Pathology 5th ed.
This is a shared conversation. Sign in to Orris to start your own chat.