
Buffer systems of body
body buffer systems acid base balance bicarbonate phosphate protein
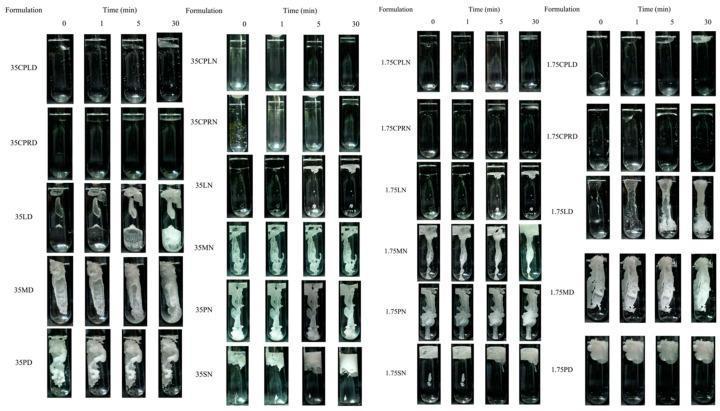
This Comparison Chart illustrates the in vitro matrix formation behavior of various fatty acid-based in situ forming systems in phosphate buffer (pH 7.4). The image consists of four panels of test tubes, comparing different formulations across time intervals of 0, 1, 5, and 30 minutes. The primary focus is the visual transition from a transparent liquid state to an opaque, solid-like matrix via the antisolvent process. Formulations are categorized by fatty acid concentration (e.g., '35' vs '1.75' series) and solvent type (DMSO 'D' vs NMP 'N'). Key observations include: 1) Low-molecular-weight fatty acids (CPL, CPR) remain largely transparent, indicating minimal matrix formation. 2) High-molecular-weight fatty acids (MYR 'M', PAL 'P', STR 'S') exhibit rapid phase inversion, appearing as dense, opaque white structures. 3) LAU 'L' shows intermediate behavior dependent on solvent type. 4) The '35' series shows significantly higher opacity and structural integrity compared to the '1.75' series at the 30-minute mark. This educational material demonstrates pharmaceutical principles of drug delivery system solidification and the influence of molecular weight and solvent on formulation kinetics.
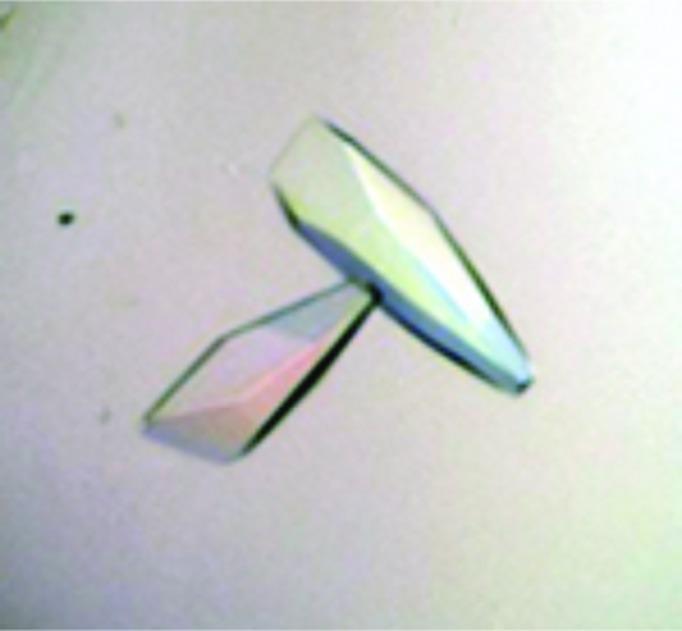
Micrograph showing protein crystals of a truncated N-terminal cytoplasmic domain of the human Electrogenic Sodium Bicarbonate Cotransporter 1 (NtNBCe1-A). The image illustrates two wedge-shaped or truncated crystals formed through hanging-drop vapor diffusion for X-ray crystallography studies. The crystals exhibit a variety of sizes, with approximate dimensions of 0.01 x 0.01 x 0.03 mm. Under a polarization filter, the crystals display characteristic birefringence, appearing translucent with iridescent color gradients including shades of pink, green, and blue. One crystal is elongated and tapers to a point, while the second is shorter with a wider, diamond-like base. The smooth, well-defined facets and high clarity are indicative of the crystalline quality required for high-resolution structural biology and physiological research into bicarbonate transport mechanisms.
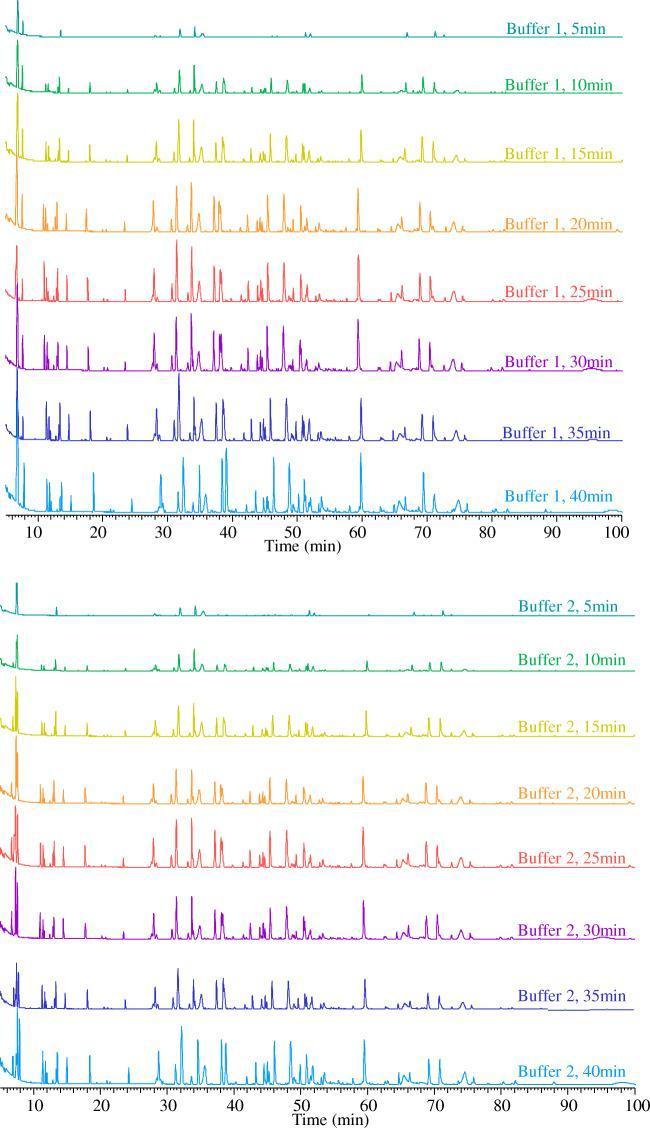
This image presents two sets of stacked base peak chromatograms (BPCs) derived from a peptide mapping time-course study of the monoclonal antibody trastuzumab. The visualization compares protein digestion kinetics using two different experimental conditions: Buffer 1 (pH 6.5) and Buffer 2 (pH 7.2). Each panel displays a vertical stack of chromatograms representing digestion time points from 5 to 40 minutes at 5-minute intervals. The horizontal axis represents the retention time (RT) in minutes, ranging from 5 to 100 minutes. Key observations for educational analysis include: - Digestion Progression: At the 5-minute mark, few peaks are visible. As time increases, the number, height, and complexity of peaks grow, indicating the progressive breakdown of the antibody into smaller peptides. - Peak Stabilization: The elution profiles stabilize significantly after 30 minutes, suggesting the achievement of complete or near-complete digestion. - Buffer Comparison: Buffer 2 (higher pH) demonstrates different peak intensities and elution patterns compared to Buffer 1, illustrating how pH environmental factors influence enzymatic cleavage and peptide yield in diagnostic and pharmaceutical research.
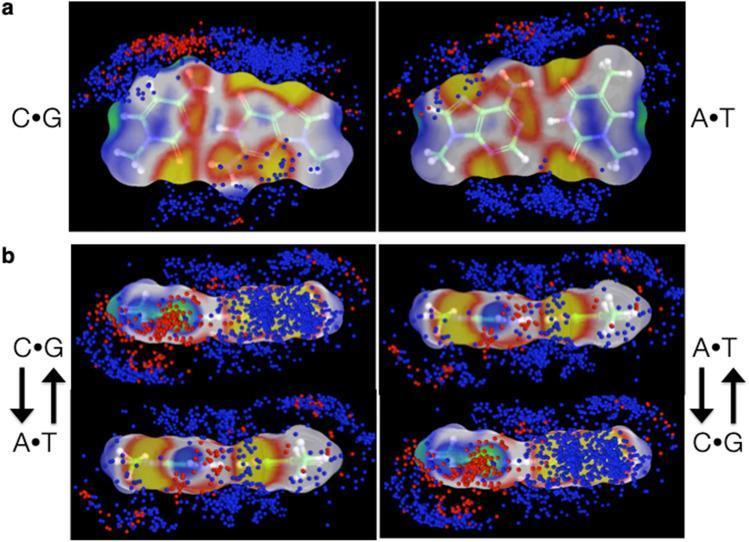
Molecular visualization of the local ionic environment and electrostatic potential surfaces of DNA base pairs in high-resolution protein-DNA complexes. Panel (a) illustrates top-down views of C·G (left) and A·T (right) base pairs, showing cationic protein atoms (blue) and anionic atoms (red) within 4 Å of the DNA. The surfaces are color-coded by electrostatic potential: yellow indicates high negative potential, green indicates high positive potential, and white/blue/red represent intermediate ranges. Cationic atoms cluster primarily near negative (yellow) potential regions, particularly along the major-groove edges of the C·G pair. Panel (b) provides side-profile (major-groove) views of successive base-pair steps: CA·TG (left) and AC·GT (right). Arrows indicate the 5′-to-3′ sugar-phosphate linkages. The visualization highlights the sequence-dependent 'intercalation' of charged amino acid atoms between base-pair planes. In CA·TG steps, cationic atoms fill the central space between base pairs, whereas in AC·GT steps, they are distributed more toward the exterior edges. This molecular modeling demonstrates how sequence-specific electrostatic signatures guide protein-DNA recognition and binding interactions at the atomic level.