
Perimetry Pg ophthalmology question Easy explain but in every point Reference kanski ak khurana
Reading File
Finding Sources
Finding Sources
Reading File
Reading File
Reading File
Finding Sources
Reading File
Finding Sources
Perimetry - Complete Point-wise Notes (Kanski / AK Khurana)
1. Definition
Perimetry is the systematic measurement of the differential light sensitivity of the visual field — i.e., mapping the extent and sensitivity of vision at various points away from fixation - Kanski's Clinical Ophthalmology, p. 24.
2. The "Hill of Vision" Concept
- The visual field is represented as a three-dimensional "hill of increasing sensitivity."
- Normal extent: ~50° superiorly, 60° nasally, 70° inferiorly, 90° temporally.
- Visual acuity is sharpest at the very top (the fovea) and declines progressively towards the periphery - nasal slope is steeper than temporal.
- The blind spot is a "bottomless pit" located temporally, between 10° and 20°, slightly below the horizontal (corresponds to the optic disc, which has no photoreceptors).
3. Key Terminology
- Isopter: a line joining points of equal sensitivity; on a 2D plot it encloses an area seen by a stimulus of given strength (like contour lines on a map).
- Scotoma: an area of reduced ("relative") or absent ("absolute") vision surrounded by a seeing area.
- Luminance: intensity/brightness of the stimulus, measured in apostilbs (asb) - inversely related to sensitivity.
- Decibel (dB): the clinical unit used instead of plain log units; 10 dB = 1 log unit. A higher dB = higher retinal sensitivity (lower stimulus intensity needed). Blind spot sensitivity = 0 dB.
- Threshold: the stimulus luminance seen on 50% of presentations at a given point. Highest at fovea, decreases with age (~1 dB per decade after age 20).
- Differential light sensitivity: how much a target's luminance must exceed the background to be perceived.
- Background luminance: affects rods vs cones differently; e.g., in retinitis pigmentosa fields are much worse under low (scotopic) background light.
4. Types of Perimetry (by stimulus movement)
| Type | Principle |
|---|---|
| Kinetic (dynamic) | Stimulus of constant intensity moved from a non-seeing to a seeing area at standard speed; point of perception plotted to build an isopter. Classic tool: Goldmann perimeter. Now much less used. |
| Static | Stimulus location is fixed; intensity is increased/decreased until threshold is reached ("staircasing"). Basis of modern automated perimetry. |
5. Methods/Instruments (by technique)
- Confrontation test: bedside screening, examiner's field used as reference - crude but quick.
- Amsler grid: tests the central 20° of field; principally used to screen/monitor macular disease (metamorphopsia, central scotoma); patients at risk of macular neovascularization are given a grid for home self-monitoring.
- Tangent (Bjerrum) screen: older manual method for central 30°.
- Goldmann perimeter: manual, kinetic - projected onto a bowl; formerly the gold standard, now largely superseded.
- Manual perimetry: stimulus presented and response recorded by a perimetrist - labour intensive, now rare.
- Automated static perimetry: modern standard - Humphrey Field Analyzer (HFA), Octopus, Medmont, Henson, Dicon. Use a photopic background (HFA uses 31.5 asb).
6. Testing Algorithms/Strategies
- Threshold perimetry: detailed mapping of the hill of vision at multiple points, compared to age-matched normative data; stimulus decreased in larger steps (e.g., 4 dB) then increased in smaller steps (e.g., 2 dB) to "fine-tune" the threshold. Used for monitoring glaucoma.
- Suprathreshold perimetry: stimuli presented above expected normal threshold for age, just to confirm they are seen - fast, used for screening.
- Fast/adaptive algorithms:
- SITA (Swedish Interactive Thresholding Algorithm) on the HFA - uses a database of normal/glaucomatous fields, adjusts estimates using patient responses in real time. Available as SITA-Standard and SITA-Fast.
- TOP/G-TOP (Tendency-Oriented Perimetry) on the Octopus - estimates thresholds using information from neighbouring points, presenting each stimulus only once (vs 4-6 times conventionally) - much faster.
7. Testing Patterns
- 24-2: tests to 24° temporally, 30° nasally - the standard glaucoma pattern.
- 30-2: alternative wider central pattern.
- 10-2: tests central 10° radius only - used in advanced glaucoma where damage threatens/splits fixation.
- Full field (e.g., FF-120): tests central + peripheral points - reserved for neurological/neuro-ophthalmic field defects (e.g., hemianopias, quadrantanopias) rather than glaucoma.
8. Reliability Indices (quality-control of a test)
- Fixation losses: patient not maintaining fixation during testing.
- False positives: patient responds when no stimulus was presented (trigger-happy responses) - reduces confidence in the field (can even mimic a "cloverleaf" supra-normal field).
- False negatives: patient fails to respond to a stimulus clearly brighter than an already-established threshold at that point - often reflects fatigue or inattention.
- High false-positive/negative rates make a field unreliable, and clinical correlation is essential — "visual field results should always be used in conjunction with the clinical findings."
9. Global (Summary) Indices
- MD (Mean Deviation): overall average deviation of the patient's field from the age-matched normal - reflects generalized loss/depression.
- PSD (Pattern Standard Deviation): measures the irregularity/localized loss within the field - useful for detecting focal glaucomatous defects even when MD is near normal.
- GHT (Glaucoma Hemifield Test): compares corresponding zones in superior vs inferior hemifields - useful since glaucoma is often asymmetric across the horizontal midline.
- VFI (Visual Field Index): percentage-based index of overall field function, weighted towards central points, used for tracking progression.
10. Newer/Special Techniques
- Microperimetry (e.g., MAIA perimeter): measures retinal sensitivity and fixation behaviour with fundus tracking (scanning laser ophthalmoscope) - correlates precisely structural macular pathology with function; more sensitive than standard automated perimetry (SAP) for subtle defects; useful in macular disease and central glaucomatous change.
- SWAP (Short-Wavelength Automated Perimetry, "blue-on-yellow") and FDT (Frequency Doubling Technology): designed to detect glaucomatous damage earlier than standard white-on-white perimetry by targeting specific ganglion cell subpopulations.
11. Clinical Applications
- Glaucoma: the mainstay for diagnosis and monitoring progression - central 30° (24-2/30-2) most important; 10-2 for advanced disease.
- Neuro-ophthalmology: localizing lesions along the visual pathway (e.g., bitemporal hemianopia in chiasmal lesions, homonymous hemianopia in retrochiasmal lesions) - requires wider/peripheral testing patterns.
- Retinal disease: Amsler grid and microperimetry for macular pathology (AMD, central serous chorioretinopathy, etc.).
- Medico-legal/occupational assessment: e.g., fitness to drive, disability certification.
12. Practical Tip (Kanski)
Visual field interpretation is never done in isolation - always correlate perimetry results with clinical examination (disc appearance, OCT, fundus findings) because artefacts (ptosis, lens rim, poor fixation, media opacity, learning effect) can mimic real field defects.
I checked for very recent evidence updates on this topic; since perimetry technique/definitions are foundational and stable, a fresh systematic-review/meta-analysis search is unlikely to change the core teaching, but let me know if you'd like me to pull recent comparative studies (e.g., SITA Faster vs SITA Standard, or AI-based perimetry) for exam updates - happy to do a quick PubMed check on that specific angle if useful.
Explaining HFA by pointing
Finding Sources
Finding Sources
Reading File
Reading File
Reading File
Searching Images
Humphrey Field Analyzer visual field printout grayscale glaucoma
Loading Image
Humphrey Field Analyzer (HFA) Printout - Explained "By Pointing" (Kanski Fig. 1.20)
Here is the actual HFA single-field printout from Kanski's Clinical Ophthalmology, labelled A-H. I'll go through it exactly as labelled, point by point.
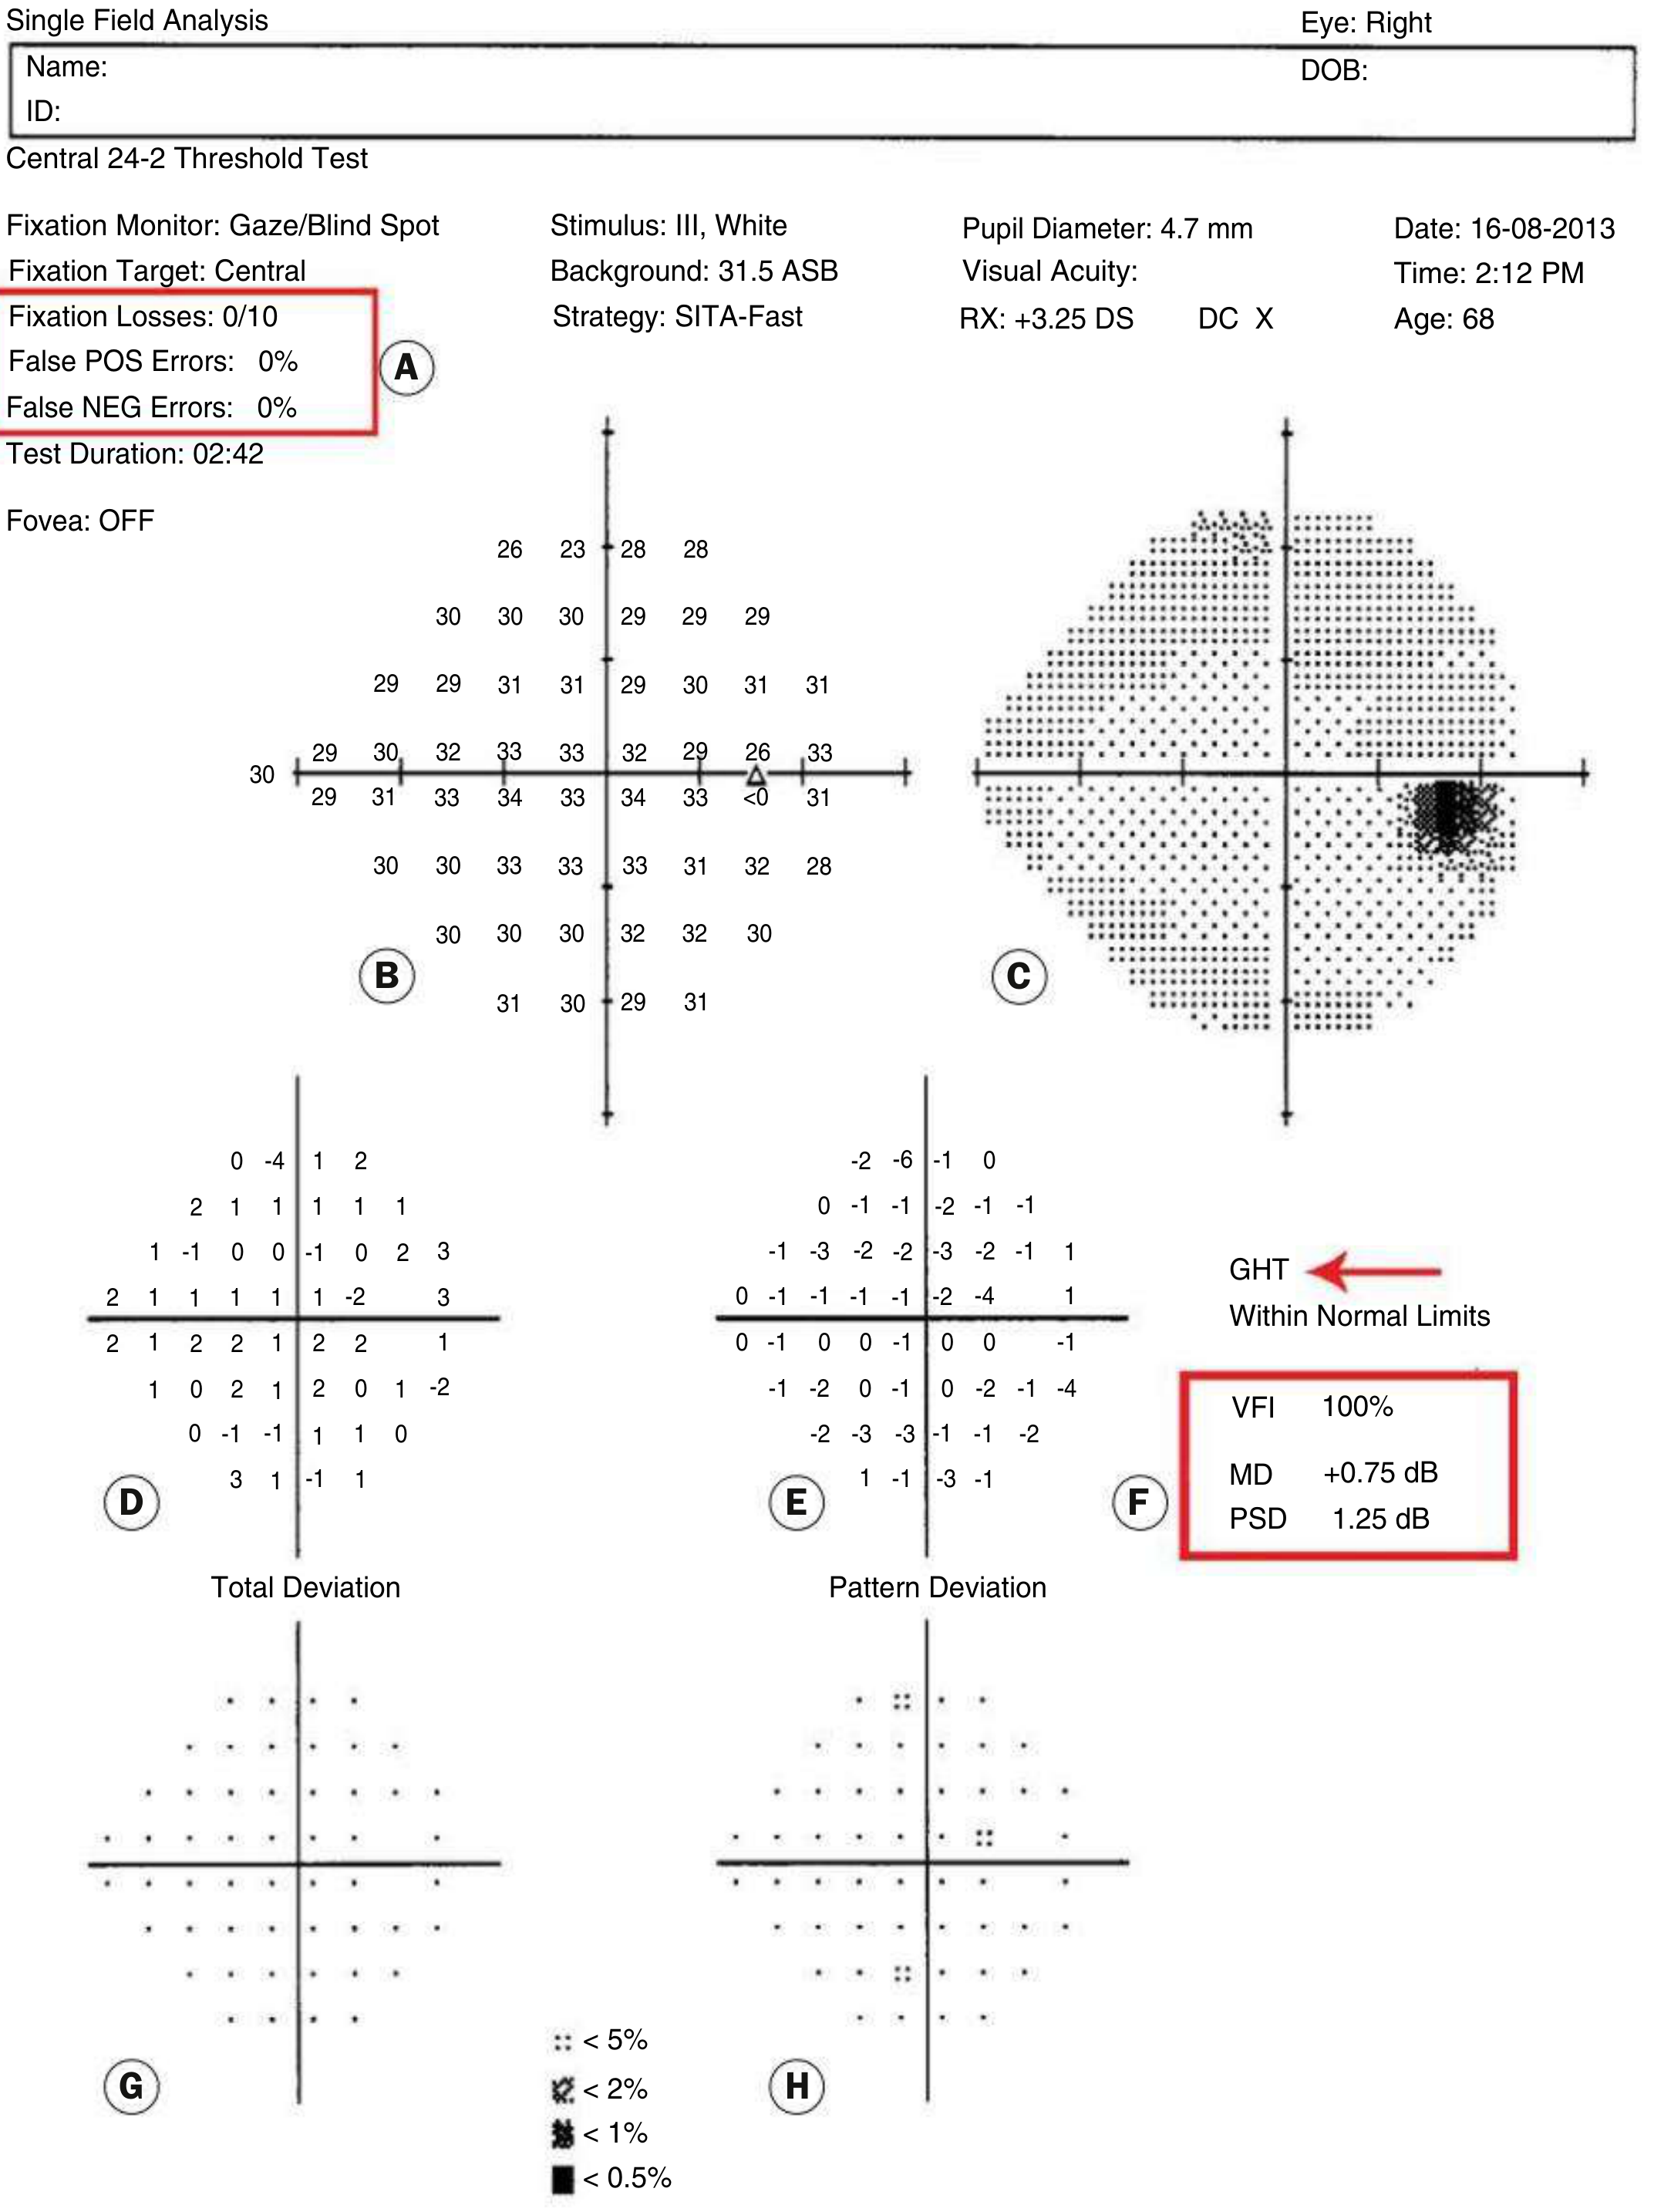
Header (top of sheet, before A-H)
- Eye tested (Right/Left), Name, DOB, ID.
- Test pattern: e.g. "Central 24-2 Threshold Test" - tells you the field size/point pattern used.
- Fixation monitor/target: how steadiness of gaze was checked (Gaze/Blind Spot method).
- Stimulus: size (Goldmann III), colour (white), Background: 31.5 asb (photopic).
- Strategy: SITA-Fast/SITA-Standard/Full Threshold - the algorithm used.
- Pupil diameter, visual acuity, refractive correction (RX), date, time, age - all affect field results and must be checked first.
Point A - Reliability Indices
- Fixation Losses (e.g. 0/10): steadiness of gaze - assessed by presenting stimuli to the blind spot.
- False POS Errors (%): patient responds when nothing was shown - a high value gives an abnormally pale grey scale.
- False NEG Errors (%): patient fails to respond to a stimulus brighter than an already-established threshold - a high value gives a clover-leaf shaped grey scale.
- Rule: if these indices are poor, everything below (B-H) becomes unreliable and should be interpreted cautiously - Kanski's Clinical Ophthalmology, p. 28-29.
Point B - Numerical (Threshold Sensitivity) Display
- Raw sensitivity value in dB measured/estimated at each tested point.
- Higher number = higher retinal sensitivity (better function) at that point.
- In full-threshold strategies, if a point is rechecked, the second value appears in brackets.
Point C - Grey Scale
- Graphical translation of the numbers in B - the simplest map to read at a glance.
- Darker = lower sensitivity (worse). Each shade change = a 5 dB step.
- The physiologic blind spot normally shows as a dark patch just below the horizontal meridian, temporally (seen as the solid black cluster in the image).
- Quick screening tool, but never rely on it alone - always cross-check with the numeric/deviation plots.
Point D - Total Deviation
- Compares the patient's measured threshold at each point with the age-corrected normal value for that point.
- Negative = worse than normal for age; positive = better than normal.
- Reflects both generalized loss (e.g. from cataract) and localized/focal loss together.
Point E - Pattern Deviation
- Total deviation values, but corrected for any generalized depression of the whole field (e.g. media opacity, small pupil, learning effect).
- What's left highlights true localized (focal) defects - the value most useful for diagnosing glaucomatous field loss specifically.
Point F - Global (Summary) Indices
- VFI (Visual Field Index): overall field function as a %, normal = 100%. Used to track progression.
- MD (Mean Deviation): average of the total deviation values - overall sensitivity of the whole field. Normal is close to 0 dB; more negative = worse.
- PSD (Pattern Standard Deviation): measures the irregularity/localized loss within the field independent of generalized depression - rises early with focal glaucomatous defects even before MD changes much.
- GHT (Glaucoma Hemifield Test): compares mirror-image zones of the superior vs inferior hemifield (glaucoma is often asymmetric across the horizontal midline) - reported as "Within Normal Limits," "Borderline," "Outside Normal Limits," etc.
- These summary values are mainly used to monitor progression, not for initial diagnosis.
Points G and H - Probability Plots
- G = Total Deviation probability plot, H = Pattern Deviation probability plot.
- Each symbol shows the likelihood that the deviation at that point would be seen in the normal population: P < 5%, < 2%, < 1%, < 0.5% - darker/denser symbols = statistically more significant defect.
- This is the plot most often scanned first clinically, since it flags points that are truly abnormal (not just numerically low).
Reading Order (practical tip)
- Check header (correct eye, refraction, pupil) →
- Check A (reliability) - if unreliable, stop and repeat test →
- Look at G/H probability plots for significant clusters →
- Confirm with E (pattern deviation, for focal defects) and C (grey scale) →
- Check F (MD, PSD, GHT, VFI) to gauge overall severity and for serial comparison over time.
This entire sequence (A-H) is standard across every HFA printout, whether SITA-Fast, SITA-Standard, or Full Threshold, and the same logic (reliability → probability plots → deviation plots → global indices) is what is tested in viva/PG exams when a printout is shown - Kanski's Clinical Ophthalmology, p. 28-29.
This is a shared conversation. Sign in to Orris to start your own chat.