
Ecg
Asking for Preferences
What would you like to know about ECG?
An ECG records the heart's electrical activity from 12 different angles using 10 electrodes. A standard reading follows a systematic approach: rate, rhythm, axis, intervals (PR, QRS, QT), and then waveform morphology (P, QRS, T waves). Normal values are: HR 60-100 bpm, PR interval 120-200 ms, QRS <120 ms, QTc <440 ms in men / <460 ms in women.
Searching sources...
Reading File
Finding Sources
Searching the Web
how to read ECG basic principles systematic approach 2024
Finding Sources
Finding Sources
Reading File
Finding Sources
Finding Sources
Reading File
Reading File
Loading Image
Finding Sources
Reading File
Loading Image
Reading File
Reading File
I now have comprehensive material from Goldman-Cecil Medicine and Costanzo Physiology to deliver a thorough answer. Let me compile the full response.
ECG - Basic Principles & How to Read One
What is an ECG?
An electrocardiogram (ECG or EKG) records tiny electrical potential differences on the body's surface that reflect the sequence of depolarization and repolarization through the myocardium. Because the atria and ventricles depolarize at different times, and in specific sequences, potential differences are established between heart regions, which electrodes placed on the skin can detect.
(Costanzo Physiology 7th Ed.; Goldman-Cecil Medicine)
The ECG Paper
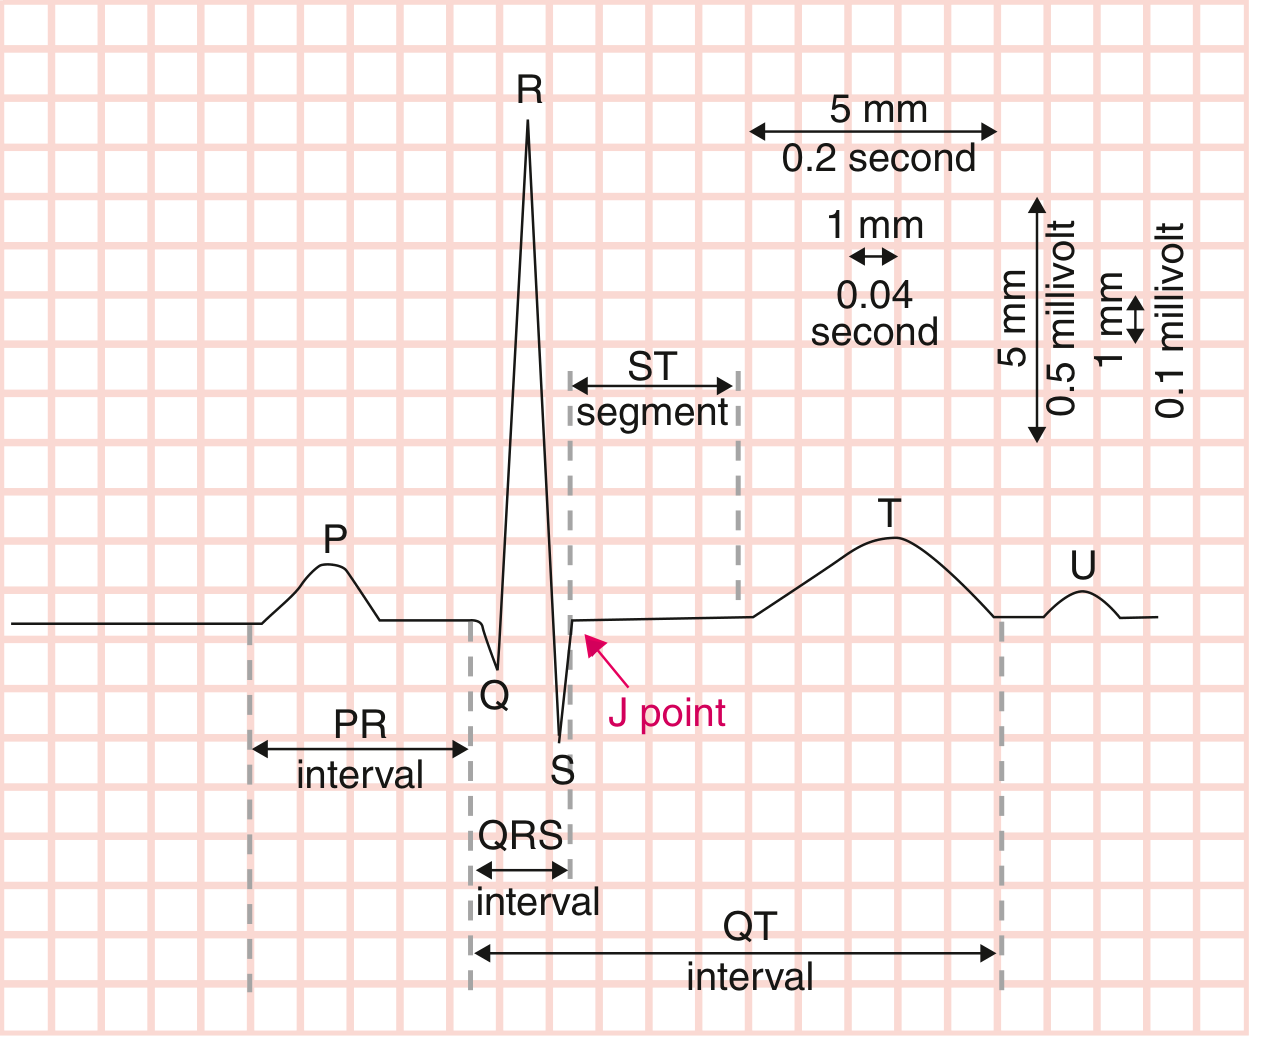
Standard ECG paper has a grid where:
- Horizontal axis = time: each small box (1 mm) = 0.04 sec (40 ms); each large box (5 mm) = 0.2 sec (200 ms)
- Vertical axis = voltage: 1 mm = 0.1 mV; standard calibration is 10 mm = 1 mV
- A standard 12-lead ECG records 10 seconds total, with groups of leads (I, II, III / aVR, aVL, aVF / V1-V3 / V4-V6) each displaying 2.5 seconds, plus a single rhythm strip for the full 10 seconds at the bottom.
(Goldman-Cecil Medicine, p. 421-422)
The Waveforms - What Each One Means

| Wave / Segment | Electrical Event |
|---|---|
| P wave | Atrial depolarization (SA node fires → atria contract) |
| PR interval | Conduction delay through AV node + His-Purkinje (atria → ventricles) |
| QRS complex | Ventricular depolarization (ventricles about to contract) |
| ST segment | Plateau phase of ventricular action potential (isoelectric) |
| T wave | Ventricular repolarization (electrical recovery) |
| QT interval | Total ventricular activity: depolarization + repolarization |
| U wave | Occasionally seen; cause debated (possibly Purkinje repolarization) |
| J point | Junction between end of QRS and start of ST segment |
Note: Atrial repolarization occurs during the QRS complex and is buried/invisible on the normal ECG because ventricular mass far exceeds atrial mass.
(Goldman-Cecil Medicine, p. 421; Guyton & Hall Medical Physiology)
Normal Interval Values
| Parameter | Normal Range |
|---|---|
| Heart rate | 50-100 beats/min |
| P wave duration | < 120 ms (< 3 small boxes) |
| PR interval | 90-200 ms (2.5-5 small boxes) |
| QRS duration | 75-110 ms (< 3 small boxes) |
| QTc (males) | 390-450 ms |
| QTc (females) | 390-460 ms |
| QRS axis | -30° to +90° |
(Goldman-Cecil Medicine, Table 42-1)
The 12 Leads - What They Look At
A standard ECG uses 10 electrodes to generate 12 vantage points (leads):
Limb leads (frontal plane):
- Bipolar: I (left arm - right arm), II (left leg - right arm), III (left leg - left arm)
- Augmented unipolar: aVR, aVL, aVF
Precordial leads (horizontal plane):
- V1-V6, placed across the chest wall
By convention, when a depolarization wave moves toward a lead electrode, the deflection is positive (upward); when moving away, it is negative (downward).
Systematic Approach to Reading an ECG
Follow this order every time:
1. Rate
- Regular rhythm: HR = 300 ÷ (number of large boxes between R waves)
- Irregular rhythm: Count QRS complexes in the 10-second strip × 6
- Formula: HR = 60,000 ÷ RR interval (in ms)
2. Rhythm
- Is it regular or irregular?
- Is there a P wave before every QRS?
- Is the P wave upright in leads I and II? (confirms sinus origin)
3. P Wave
- Duration < 120 ms
- Morphology: smooth, rounded, upright in I, II, aVF
- Biphasic in V1 is normal
4. PR Interval
- 120-200 ms (3-5 small boxes)
- Prolonged PR = first-degree AV block
- Short PR = pre-excitation (e.g., WPW)
5. QRS Complex
- Duration < 120 ms
- Wide QRS (≥ 120 ms) = bundle branch block or ventricular origin
- Check for Q waves (pathological if > 40 ms wide or > 25% of R wave height)
6. Axis
- Normal axis: -30° to +90°
- Quick check: if QRS is positive (upright) in both I and aVF → normal axis
- Positive I, negative aVF → left axis deviation
- Negative I, positive aVF → right axis deviation
7. ST Segment & T Wave
- ST should be isoelectric (flat at baseline)
- ST elevation → consider MI, pericarditis, Brugada
- ST depression → ischemia, digoxin effect, reciprocal change
- T wave normally positive in I, II, V3-V6; inverted in aVR
8. QT Interval
- Measure in leads II, V5, V6; use longest value
- Correct with Bazett's formula: QTc = QT / √(RR interval in seconds)
- Prolonged QTc → risk of torsades de pointes
Key Physiology to Remember
- The QRS is larger than the P wave because ventricular muscle mass far exceeds atrial mass.
- The QRS duration equals the P wave duration despite the size difference because the His-Purkinje system conducts so much faster than the atrial conduction system - this is why ventricular depolarization happens just as quickly.
- Depolarization waves (P, QRS) move toward a lead = positive deflection. Repolarization waves (T) are positive in most leads because ventricular repolarization occurs in the opposite direction to depolarization (epicardium repolarizes first).
(Costanzo Physiology 7th Ed.; Guyton & Hall Medical Physiology)
Would you like to go deeper into any specific part - arrhythmia recognition, bundle branch blocks, ST changes, or axis calculation?
This is a shared conversation. Sign in to Orris to start your own chat.