
Test for ovulation
ovulation test LH surge urine test
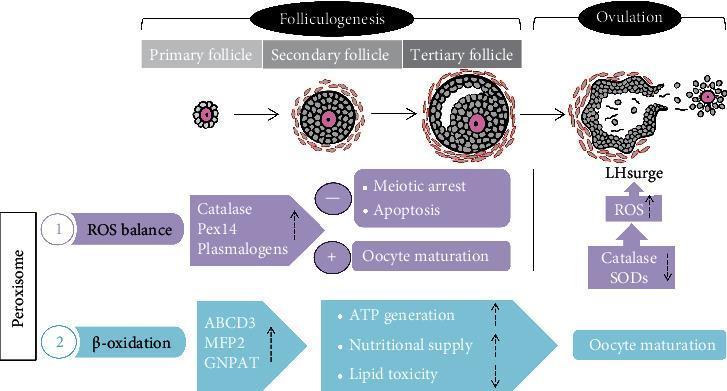
This pathophysiology diagram illustrates peroxisomal regulation during folliculogenesis and ovulation. The top sequence depicts morphological follicle progression from a primary follicle through a secondary follicle to a tertiary follicle (showing antrum formation), culminating in a preovulatory follicle and LH surge-triggered ovulation. The diagram outlines two primary peroxisomal pathways: 1) ROS balance, where upregulation of Catalase, Pex14, and plasmalogens promotes oocyte maturation while inhibiting meiotic arrest and apoptosis; and 2) β-oxidation, where upregulation of ABCD3, MFP2, and GNPAT increases ATP generation and nutritional supply while decreasing lipid toxicity to support oocyte maturation. During the ovulation phase, the schematic shows a shift characterized by the downregulation of Catalase and SODs, leading to an increase in Reactive Oxygen Species (ROS) levels. Key educational concepts include the role of peroxisomes in metabolic support, antioxidant defense, and the transition of oxidative states required for successful oocyte release.
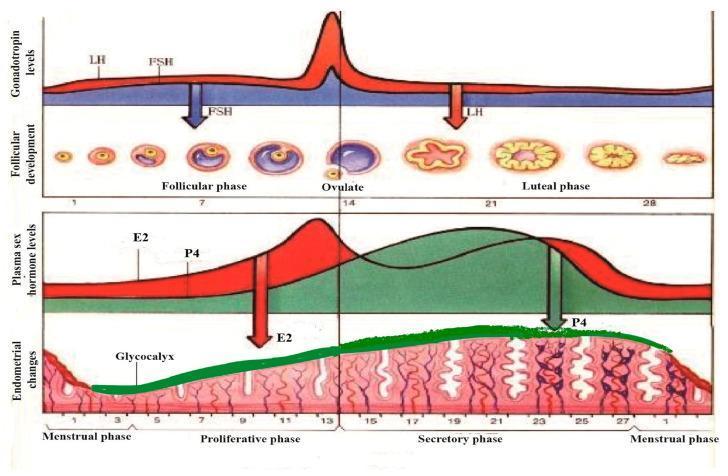
A multi-panel pathophysiology diagram illustrating the synchronous physiological changes during a standard 28-day human menstrual cycle. The top panel graphs gonadotropin levels, showing a sharp surge in Luteinizing Hormone (LH) and a moderate rise in Follicle-Stimulating Hormone (FSH) at day 14, correlating with the follicular phase, ovulation, and luteal phase stages. The corresponding follicular development shows the maturation of a primary follicle into a Graafian follicle, ovulation, and the formation of the corpus luteum and corpus albicans. The middle panel tracks plasma sex hormone levels, highlighting the mid-cycle peak of Estradiol (E2) and the post-ovulatory rise of Progesterone (P4). The bottom panel depicts endometrial morphology, transitioning from the menstrual phase to the proliferative and secretory phases. A green-shaded layer highlights the glycocalyx development, which thickens and becomes most prominent during the secretory phase under the influence of P4, before thinning during menstruation. The diagram demonstrates the hormonal regulation of the ovary and uterine lining for medical educational purposes.
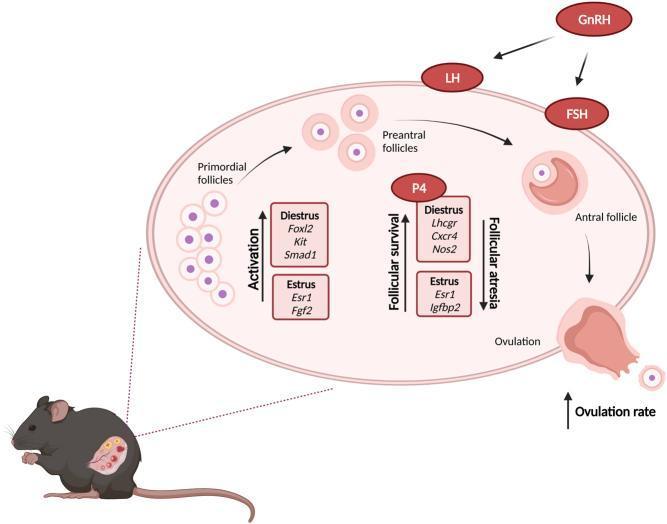
This pathophysiology diagram illustrates the sequential stages of ovarian follicular development and the regulatory factors influencing the ovulation rate, using a murine model for context. The process initiates with primordial follicles, which undergo 'Activation' to become preantral follicles. These then mature into antral follicles, eventually culminating in ovulation. The Hypothalamic-Pituitary-Gonadal (HPG) axis is shown influencing the cycle through GnRH, which regulates LH and FSH, along with Progesterone (P4) involvement. Key regulatory pathways highlighted include 'Follicular survival,' which leads toward ovulation, and an opposing pathway for 'Follicular atresia.' The diagram maps specific molecular markers to the Diestrus and Estrus stages of the cycle. During Diestrus, follicular activation and survival are associated with Foxl2, Kit, Smad1, Lhcgr, Cxcr4, and Nos2. During Estrus, these processes involve Esr1, Fgf2, and Igfbp2. The educational focus is on the complex interplay between endocrine signaling and local gene expression that determines follicular fate and overall ovulation rate.
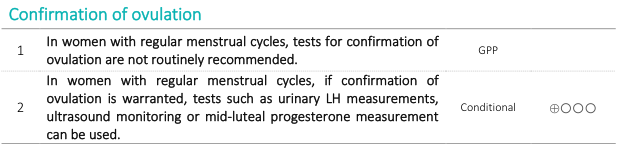
<table> <tr> <td colspan="3"><span style="color:#00b6c4"><b>Confirmation of ovulation</b></span></td> </tr> <tr> <td>1</td> <td>In women with regular menstrual cycles, tests for confirmation of ovulation are not routinely recommended.</td> <td>GPP</td> </tr> <tr> <td>2</td> <td>In women with regular menstrual cycles, if confirmation of ovulation is warranted, tests such as urinary LH measurements, ultrasound monitoring or mid-luteal progesterone measurement can be used.</td> <td>Conditional<br>⊕◯◯◯</td> </tr> </table>
Tests for Ovulation
Why test for ovulation?
1. Urinary LH (Ovulation Predictor Kits) - Most Widely Used
- Home dipstick ELISA kits detect urinary LH using a threshold of 35-50 mIU/mL
- Most are accurate, inexpensive, and convenient
- Positive predictive value: 92% | Negative predictive value: 95%
- Because the surge may last less than 12 hours, twice-daily testing increases detection rates
- The two highest-probability conception days are the day of and day before the LH surge - so detecting the surge may already be "late" for optimal timing
- False positives in ~7% of cycles (may reflect premature unsustained LH surges)
- Not reliable in women with irregular cycles
- A positive result does not guarantee ovulation will actually occur - it only predicts it
- Measurement does not confirm ovulation or explain anovulation causes
2. Midluteal Serum Progesterone - Best for Confirmation
- A level >3 ng/mL (10 nmol/L) confirms corpus luteum formation and is taken as evidence of ovulation
- Tietz puts the cutoff even higher: >300 ng/dL (9.5 nmol/L) indicates ovulation has taken place
- In practice, ovulatory levels are often considerably higher than 3 ng/mL
Progesterone confirms corpus luteum formation - it does NOT confirm that the oocyte was physically released. Luteinized unruptured follicle syndrome (LUF) can give a normal progesterone rise without actual oocyte release. Also, progesterone is secreted in frequent pulses, so a single low midluteal value is not definitively diagnostic of anovulation.
3. Basal Body Temperature (BBT)
- Use a BBT thermometer to record oral or rectal temperature every morning before arising, eating, or drinking
- Ovulation is assumed after 3 consecutive days of elevated temperature
- A biphasic pattern (low follicular / high luteal) characterizes ovulatory cycles
- Only retrospective - the rise begins 1-2 days after ovulation, so it cannot predict the fertile window
- Frequent false negatives
- Affected by smoking, irregular sleep patterns, illness
- Not useful for timing intercourse prospectively
4. Transvaginal Ultrasound (US) - Gold Standard for Real-Time Monitoring
- Pre-ovulatory follicle reaches 17-19 mm (spontaneous cycles) or 19-25 mm (clomiphene-induced cycles)
- Ovulation = sudden decrease in follicle size + appearance of free fluid in the cul-de-sac
- 10% of cycles in normally fertile women show apparent ovulation on hormonal tests but no visible follicle rupture on daily US
- Rises to 25% in women with unexplained infertility
- Only US can detect this - hormone tests will appear normal
5. Cervical Mucus Assessment
Summary Comparison Table
| Test | Predicts or Confirms? | Timing | Key Threshold | Limitation |
|---|---|---|---|---|
| Urinary LH kit | Predicts (24-48 h before) | Mid-cycle | 35-50 mIU/mL | No confirmation of actual ovulation; unreliable with irregular cycles |
| Serum progesterone | Confirms (retrospective) | Day 21-23 or 7 days post-LH | >3 ng/mL (>300 ng/dL) | Does not confirm oocyte release; pulsatile secretion complicates interpretation |
| Basal body temperature | Confirms (retrospective) | Rise 1-2 days after ovulation | 0.5-1°F rise | Retrospective only; frequent false negatives |
| Transvaginal ultrasound | Confirms (real-time) | Follicular monitoring | Follicle 17-19 mm then collapse | Expensive; can detect LUF |
| Cervical mucus | Predicts (2-3 days before) | Peri-ovulatory | Clear, slippery mucus | Subjective; affected by infections, medications |