
Explain me 10 common heart diseases with ECC changes and ECG images of those diseases
Reading File
Finding Sources
Searching Images
ECG electrocardiogram myocardial infarction ST elevation
Finding Sources
Searching Images
atrial fibrillation ECG irregularly irregular rhythm absent P waves
Searching Images
ventricular tachycardia ECG wide QRS complex monomorphic
Searching Images
heart block complete third degree ECG AV dissociation
Searching Images
left ventricular hypertrophy ECG voltage criteria Sokolow
Searching Images
Wolff-Parkinson-White syndrome ECG delta wave short PR interval
Searching Images
pulmonary embolism ECG S1Q3T3 right heart strain sinus tachycardia
Searching Images
pericarditis ECG diffuse saddle-shaped ST elevation PR depression
Searching Images
hypertrophic cardiomyopathy ECG deep Q waves lateral leads ST changes
Searching Images
Brugada syndrome ECG coved ST elevation V1 V2 right bundle branch pattern
Here is a comprehensive guide to 10 common heart diseases with their ECG changes and images.
10 Common Heart Diseases: ECG Changes & Images
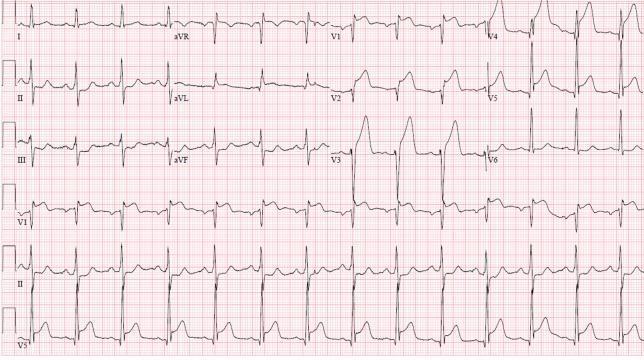
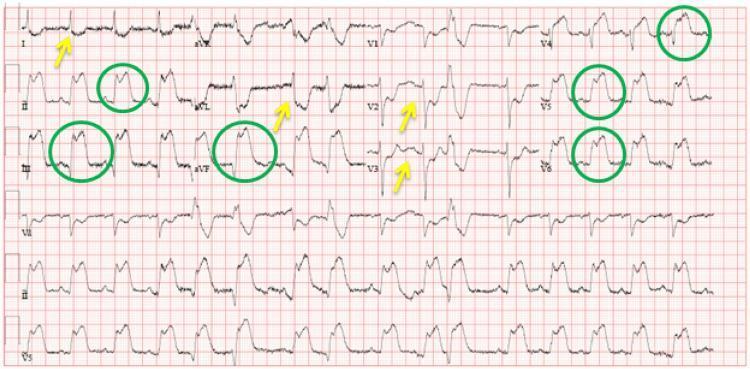
1. ST-Elevation Myocardial Infarction (STEMI)
Overview: Acute occlusion of a coronary artery causing transmural myocardial ischemia/necrosis.
ECG Changes:
- Hyperacute T waves (earliest sign — peaked, broad, symmetric)
- ST-segment elevation ≥1 mm in ≥2 contiguous limb leads, or ≥2 mm in ≥2 contiguous precordial leads (convex/tombstone morphology)
- Reciprocal ST depression in opposing leads
- Pathological Q waves (>40 ms wide, >1/4 QRS amplitude) — develop over hours
- T-wave inversion (later stage)
- Localization by leads:
- Anterior (LAD): V1–V4
- Inferior (RCA): II, III, aVF
- Lateral (LCx): I, aVL, V5–V6
ECG Images:
Anterior STEMI (LAD occlusion):
Inferolateral STEMI:
2. Atrial Fibrillation (AFib)
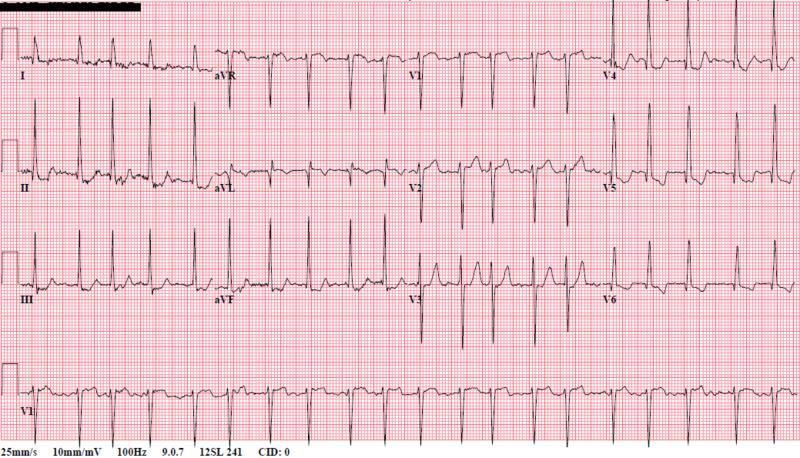
Overview: Disorganized atrial electrical activity causing an irregularly irregular ventricular rhythm. Most common sustained cardiac arrhythmia.
ECG Changes:
- Absent P waves — replaced by chaotic fibrillatory baseline (most visible in V1)
- Irregularly irregular R-R intervals (hallmark finding)
- Narrow QRS complexes (unless aberrant conduction/bundle branch block)
- Ventricular rate may be slow, normal, or rapid (RVR >100 bpm)
- No organized atrial activity
ECG Image:
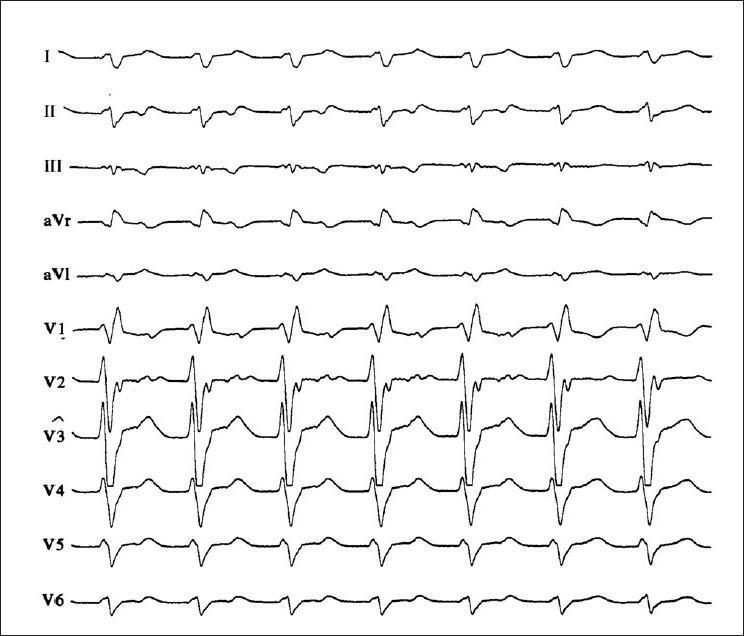
3. Ventricular Tachycardia (VT)
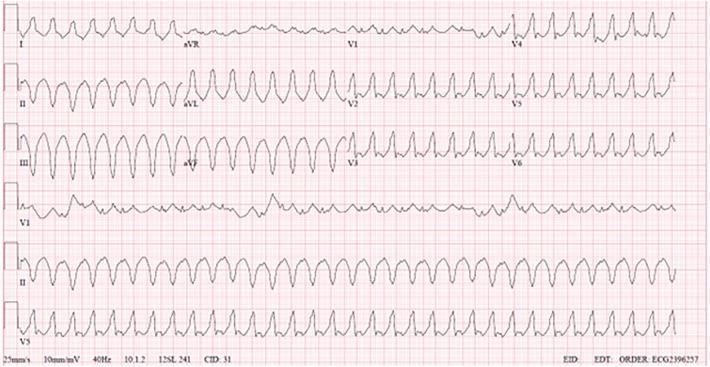
Overview: Potentially life-threatening arrhythmia originating in the ventricles, often associated with structural heart disease (ischemic cardiomyopathy, scar tissue).
ECG Changes:
- Wide QRS complexes (>120 ms) — hallmark
- Regular, rapid rate (100–250 bpm)
- AV dissociation (P waves independent of QRS) — highly specific for VT
- Fusion beats and capture beats (pathognomonic when seen)
- Concordance in precordial leads (all positive or all negative)
- Northwest axis (extreme right axis deviation)
- No visible P waves preceding QRS
ECG Images:
4. Complete (Third-Degree) Heart Block
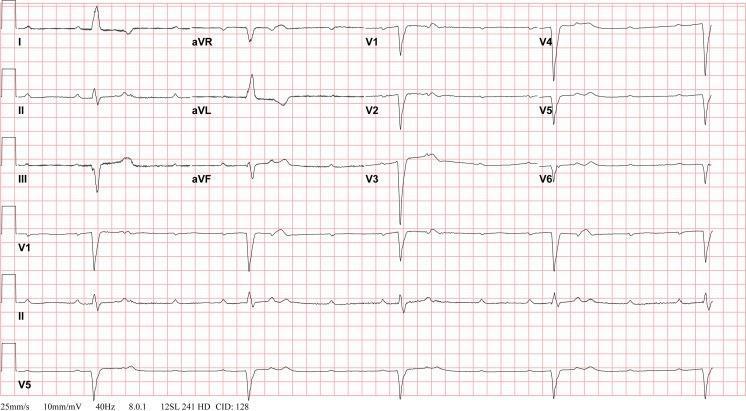
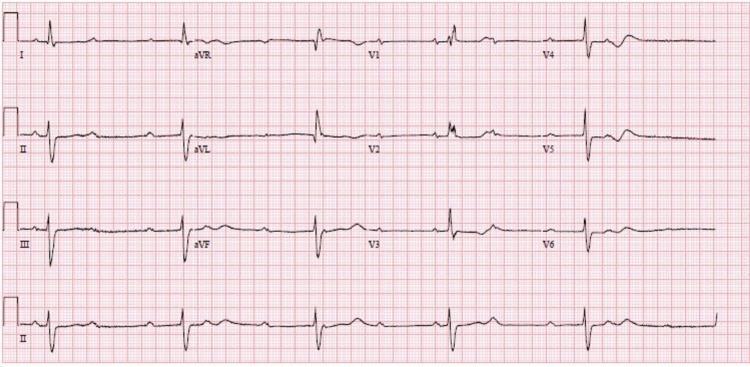
Overview: Total failure of conduction through the AV node. Atria and ventricles beat independently. A medical emergency often requiring pacemaker implantation.
ECG Changes:
- Complete AV dissociation — P waves and QRS complexes march independently
- Atrial rate faster than ventricular rate
- No fixed PR interval — P waves "march through" QRS and T waves
- Escape rhythm: Narrow QRS if junctional origin (~40–60 bpm); Wide QRS if ventricular origin (~20–40 bpm)
- Regular R-R intervals and regular P-P intervals (each independent)
ECG Images:
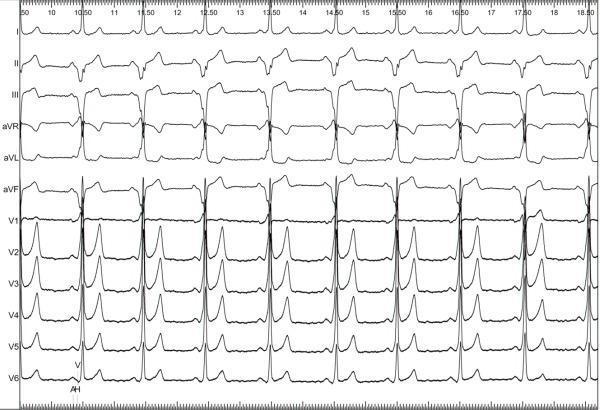
5. Wolff-Parkinson-White (WPW) Syndrome
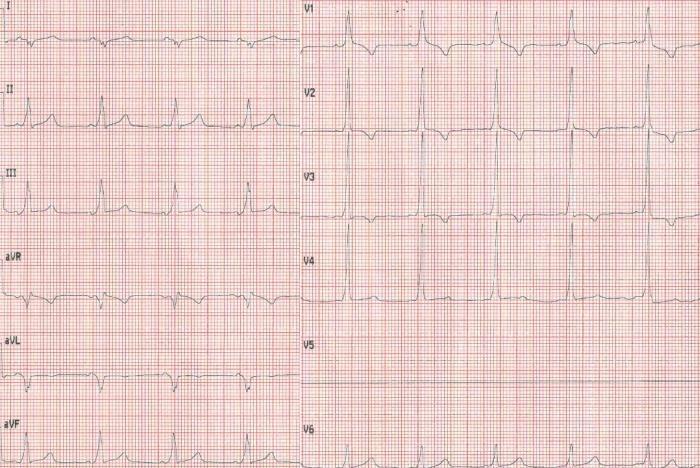
Overview: Pre-excitation syndrome caused by an accessory pathway (Bundle of Kent) that bypasses the AV node, allowing early ventricular activation. Risk of life-threatening tachyarrhythmia.
ECG Changes (Classic Triad):
- Short PR interval (<120 ms)
- Delta wave — slurred upstroke at the start of QRS (slow initial ventricular depolarization via accessory pathway)
- Widened QRS (>120 ms total due to delta wave + normal conduction fusion)
- Secondary ST-T wave changes (discordant to delta wave direction)
- Pseudo-infarction Q waves in inferior leads (negative delta waves mimicking Q waves)
- Pathway localization possible from delta wave polarity
ECG Images:
6. Acute Pericarditis
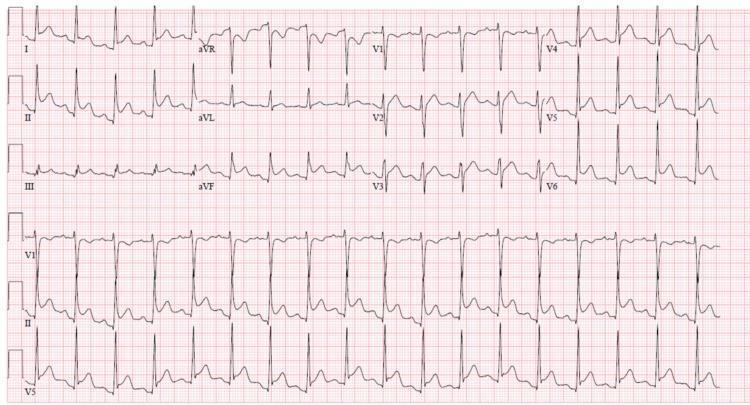
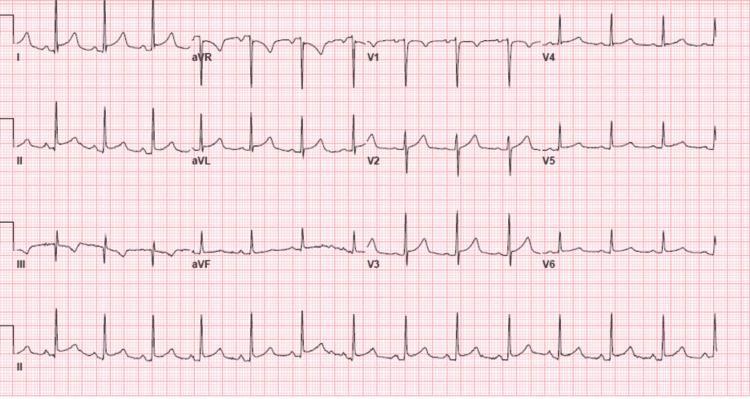
Overview: Inflammation of the pericardium — most commonly viral. ECG evolves through 4 stages over days to weeks.
ECG Changes (Stage I — acute):
- Diffuse, concave ("saddle-shaped") ST elevation in almost all leads (I, II, aVF, V2–V6) — not confined to one vascular territory
- PR-segment depression in the same leads (atrial injury) — most visible in lead II
- Reciprocal ST depression and PR elevation in aVR (highly specific)
- Spodick's sign — downsloping TP segment
- Later stages: ST normalizes → T-wave inversion → resolution
Key Differentiator from STEMI:
- Pericarditis: saddle-shaped, diffuse, no reciprocal ST depression (except aVR), PR depression
- STEMI: convex ST elevation, localized, reciprocal depression in opposing leads
ECG Images:
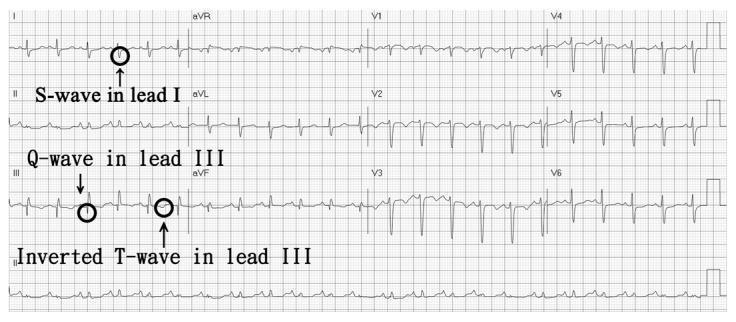
7. Pulmonary Embolism (PE)
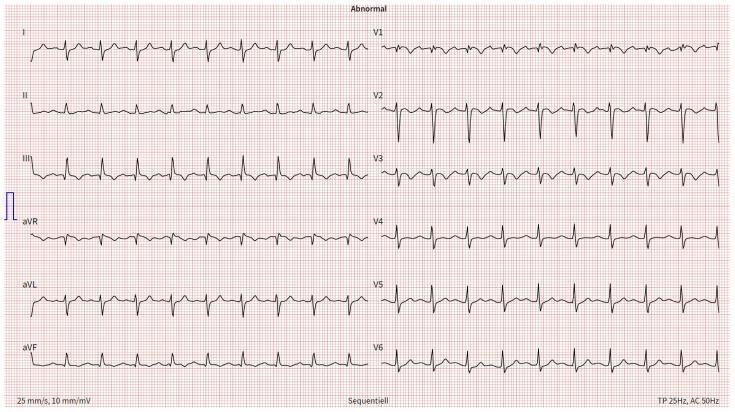
Overview: Obstruction of pulmonary vasculature causing acute right ventricular pressure overload. ECG changes reflect right heart strain.
ECG Changes:
- Sinus tachycardia — most common finding (>75% of cases)
- S1Q3T3 pattern (McGinn-White sign): prominent S wave in lead I + Q wave in lead III + inverted T wave in lead III
- T-wave inversions in V1–V4 (right ventricular strain)
- Incomplete or complete RBBB (right ventricular overload)
- Right axis deviation
- P pulmonale (peaked P waves in II — right atrial strain)
- Atrial fibrillation may occur
- ECG may be completely normal in up to 25% of cases
ECG Images:
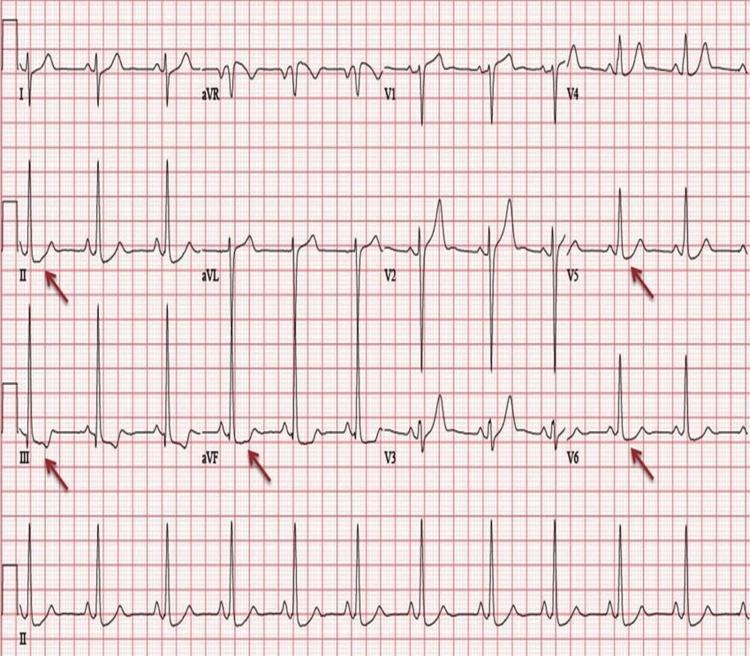
8. Left Ventricular Hypertrophy (LVH)
Overview: Thickening of the LV myocardium due to chronic pressure overload (hypertension, aortic stenosis) or volume overload. Increases risk of heart failure, AF, and sudden death.
ECG Changes:
- Voltage criteria:
- Sokolow-Lyon: S in V1 + R in V5 or V6 ≥35 mm
- Cornell: R in aVL + S in V3 >28 mm (men) or >20 mm (women)
- R in aVL ≥12 mm
- LVH strain pattern: ST depression + T-wave inversion in lateral leads (I, aVL, V5–V6) — discordant to QRS
- Left axis deviation
- Prolonged QRS duration (but usually <120 ms)
- Left atrial enlargement (broad, notched P wave — "P mitrale")
ECG Image:
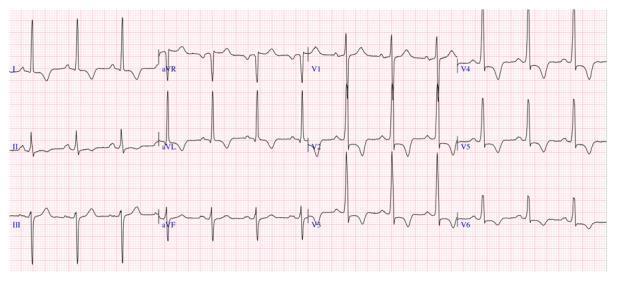
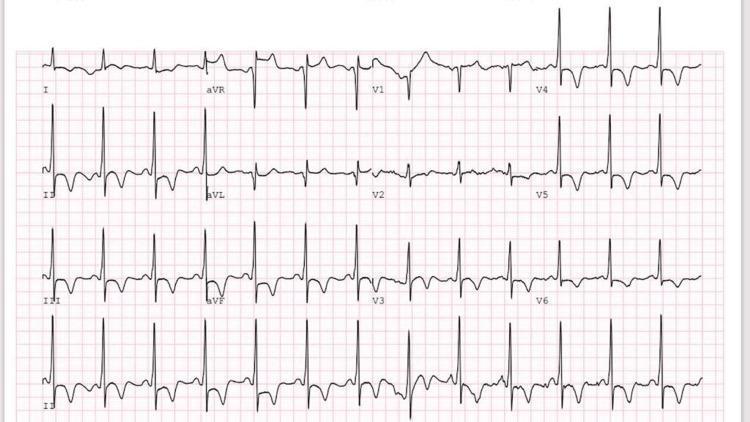
9. Hypertrophic Cardiomyopathy (HCM)
Overview: Genetic condition (most commonly sarcomere mutations) causing asymmetric septal hypertrophy. Leading cause of sudden cardiac death in young athletes.
ECG Changes:
- LVH voltage criteria (tall R waves V4–V6, deep S waves V1–V2)
- Deep, narrow Q waves in lateral leads (I, aVL, V5–V6) — due to septal hypertrophy (initial septal depolarization away from lateral leads); can mimic inferior MI
- Giant T-wave inversions (especially in apical variant / Yamaguchi): deeply inverted T waves V3–V6, often >10 mm
- ST-segment depression in lateral leads (strain pattern)
- Left axis deviation
- ECG abnormal in ~90% of HCM patients
ECG Images:
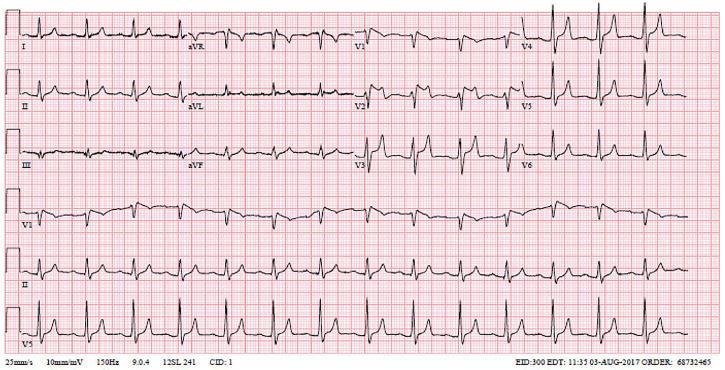
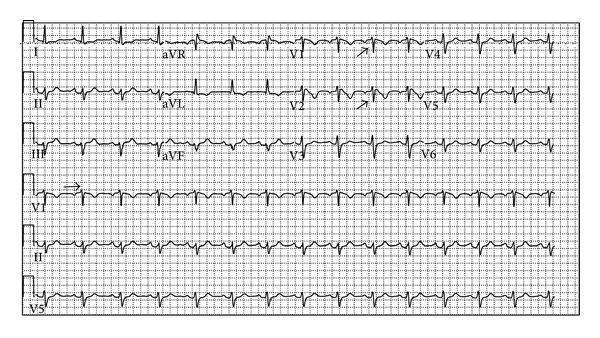
10. Brugada Syndrome
Overview: Inherited sodium channelopathy (SCN5A mutation in ~30%) causing risk of ventricular fibrillation and sudden cardiac death, often in young males during rest or sleep. ECG pattern may be intermittent.
ECG Changes (Type 1 — Diagnostic):
- Coved-type ST elevation ≥2 mm in V1 (±V2) with a high take-off, descending slope merging into an inverted T wave without isoelectric interval
- Pseudo-RBBB pattern in V1–V2
- Changes most visible when leads placed at higher intercostal spaces (2nd–3rd ICS)
- Types 2 & 3: "saddle-back" or minimal ST elevation — not diagnostic alone
- Unmask with fever, sodium channel blockers (ajmaline, flecainide challenge)
ECG Images:
Quick Reference Summary Table
| Disease | Key ECG Features |
|---|---|
| STEMI | Convex ST elevation + reciprocal depression + Q waves (territory-specific) |
| Atrial Fibrillation | Absent P waves + irregularly irregular rhythm |
| Ventricular Tachycardia | Wide QRS tachycardia + AV dissociation + concordance |
| Complete Heart Block | AV dissociation + slow escape rhythm + P waves independent |
| WPW Syndrome | Short PR + delta wave + wide QRS triad |
| Pericarditis | Diffuse saddle ST elevation + PR depression + Spodick's sign |
| Pulmonary Embolism | Sinus tachycardia + S1Q3T3 + RV strain (T inv V1–V4) |
| LVH | High voltage (Sokolow ≥35 mm) + lateral strain pattern |
| Hypertrophic CMP | Giant T inversions + deep Q waves laterally + LVH voltage |
| Brugada Syndrome | Coved ST elevation ≥2 mm in V1–V2 + pseudo-RBBB |
Note: ECG interpretation always requires clinical correlation. A "normal" ECG does not exclude serious heart disease (e.g., PE can be normal in 25% of cases). When findings are ambiguous, serial ECGs and additional testing (echocardiogram, troponins, CT-PA, cardiac MRI) are essential.The guide covers all 10 diseases with clinical ECG images sourced from peer-reviewed medical literature. Here's a recap of what was covered:
- STEMI — Convex ST elevation localized to coronary territory + reciprocal changes
- Atrial Fibrillation — No P waves + irregularly irregular rhythm
- Ventricular Tachycardia — Wide QRS tachycardia + AV dissociation
- Complete Heart Block — AV dissociation with independent atrial/ventricular rhythms
- WPW Syndrome — Short PR + delta wave + widened QRS triad
- Acute Pericarditis — Diffuse saddle-shaped ST elevation + PR depression (vs STEMI key differentiator)
- Pulmonary Embolism — Sinus tachycardia + S1Q3T3 + right ventricular strain pattern
- LVH — High voltage + lateral strain pattern (ST depression + T inversion)
- Hypertrophic CMP — Giant T-wave inversions + deep lateral Q waves
- Brugada Syndrome — Coved ST elevation ≥2 mm in V1–V2 with inverted T wave
Each section includes the specific waveform changes, lead localization, and clinical significance to help distinguish one condition from another on a 12-lead ECG.
This is a shared conversation. Sign in to Orris to start your own chat.