Give ime ECG in deeatils
Reading File
Finding Sources
Searching the Web
ECG electrocardiogram detailed explanation waves intervals clinical interpretation
Reading File
Finding Sources
Finding Sources
Reading File
Reading File
Reading File
Loading Image
Loading Image
Finding Sources
Finding Sources
Reading File
Reading File
Loading Image
Loading Image
Finding Sources
Now I have comprehensive material. Let me compile a thorough, well-illustrated response.
Electrocardiogram (ECG) - A Detailed Guide
What is an ECG?
The electrocardiogram (ECG, also abbreviated EKG) is a recording of the electrical activity of the heart, captured by electrodes placed on the skin surface. When a cardiac impulse passes through the heart, electrical current spreads into adjacent tissues and all the way to the body surface. Electrodes placed at different locations detect these tiny potential differences (fractions of a millivolt to several millivolts) and plot them over time as a continuous waveform.
"The ECG is a recording of the small extracellular signals produced by the movement of action potentials through cardiac myocytes." - Medical Physiology (Boron & Boulpaep)
ECG Paper and Scale
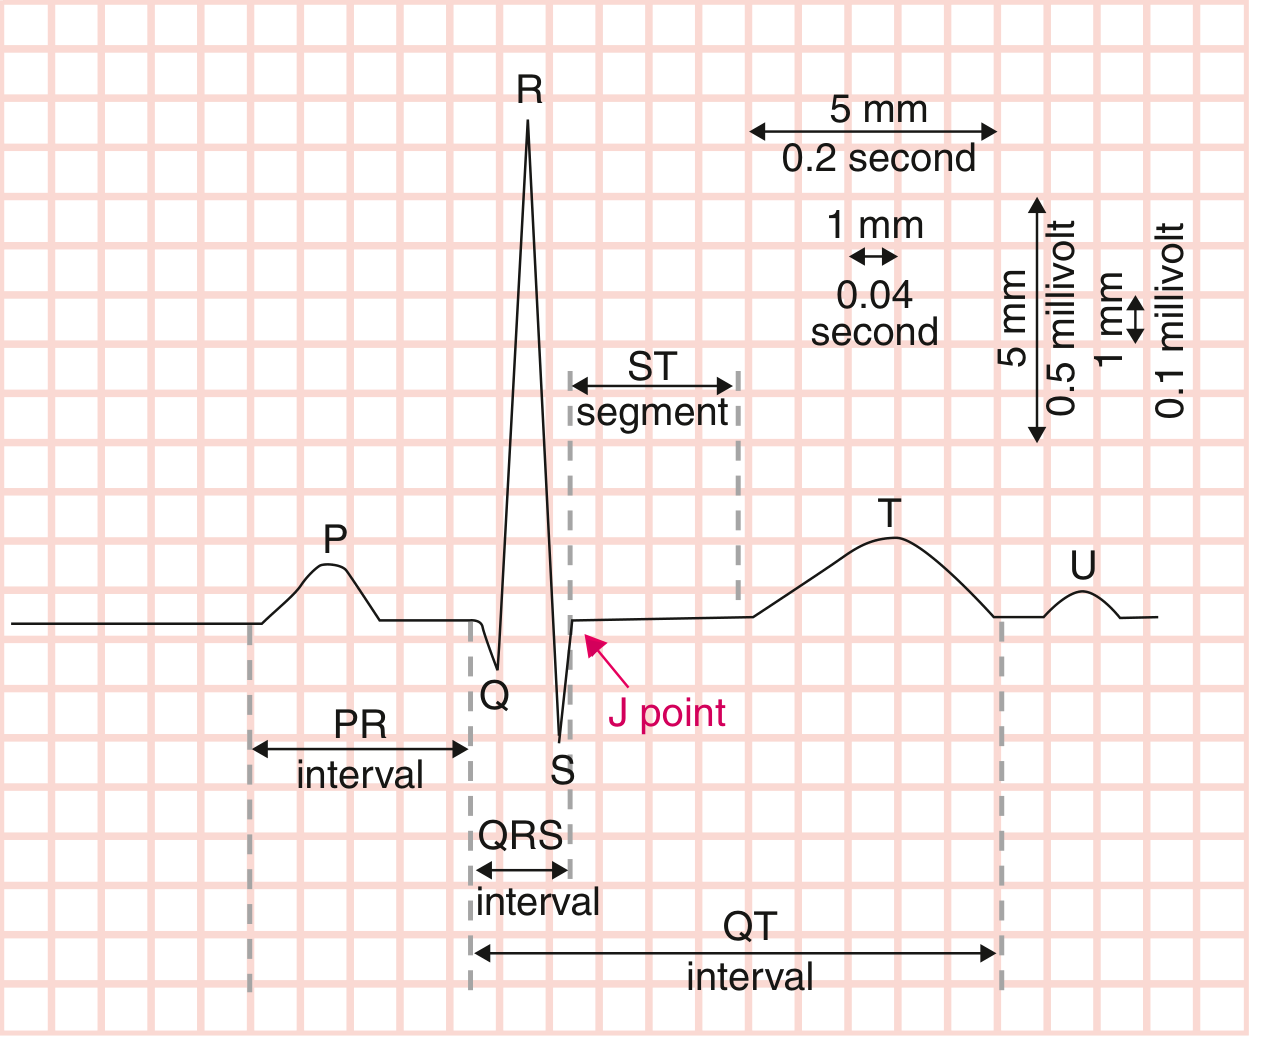
Standard ECG paper uses a grid system:
| Measurement | Meaning |
|---|---|
| Horizontal axis | Time |
| 1 small box (1 mm) | 0.04 seconds (40 ms) |
| 1 large box (5 mm) | 0.2 seconds (200 ms) |
| Vertical axis | Voltage (amplitude) |
| 1 small box (1 mm) | 0.1 mV |
| 1 large box (5 mm) | 0.5 mV |
| Standard calibration | 10 mm = 1 mV |
Recording speed is typically 25 mm/sec.
The Cardiac Conduction System and Its ECG Correlates
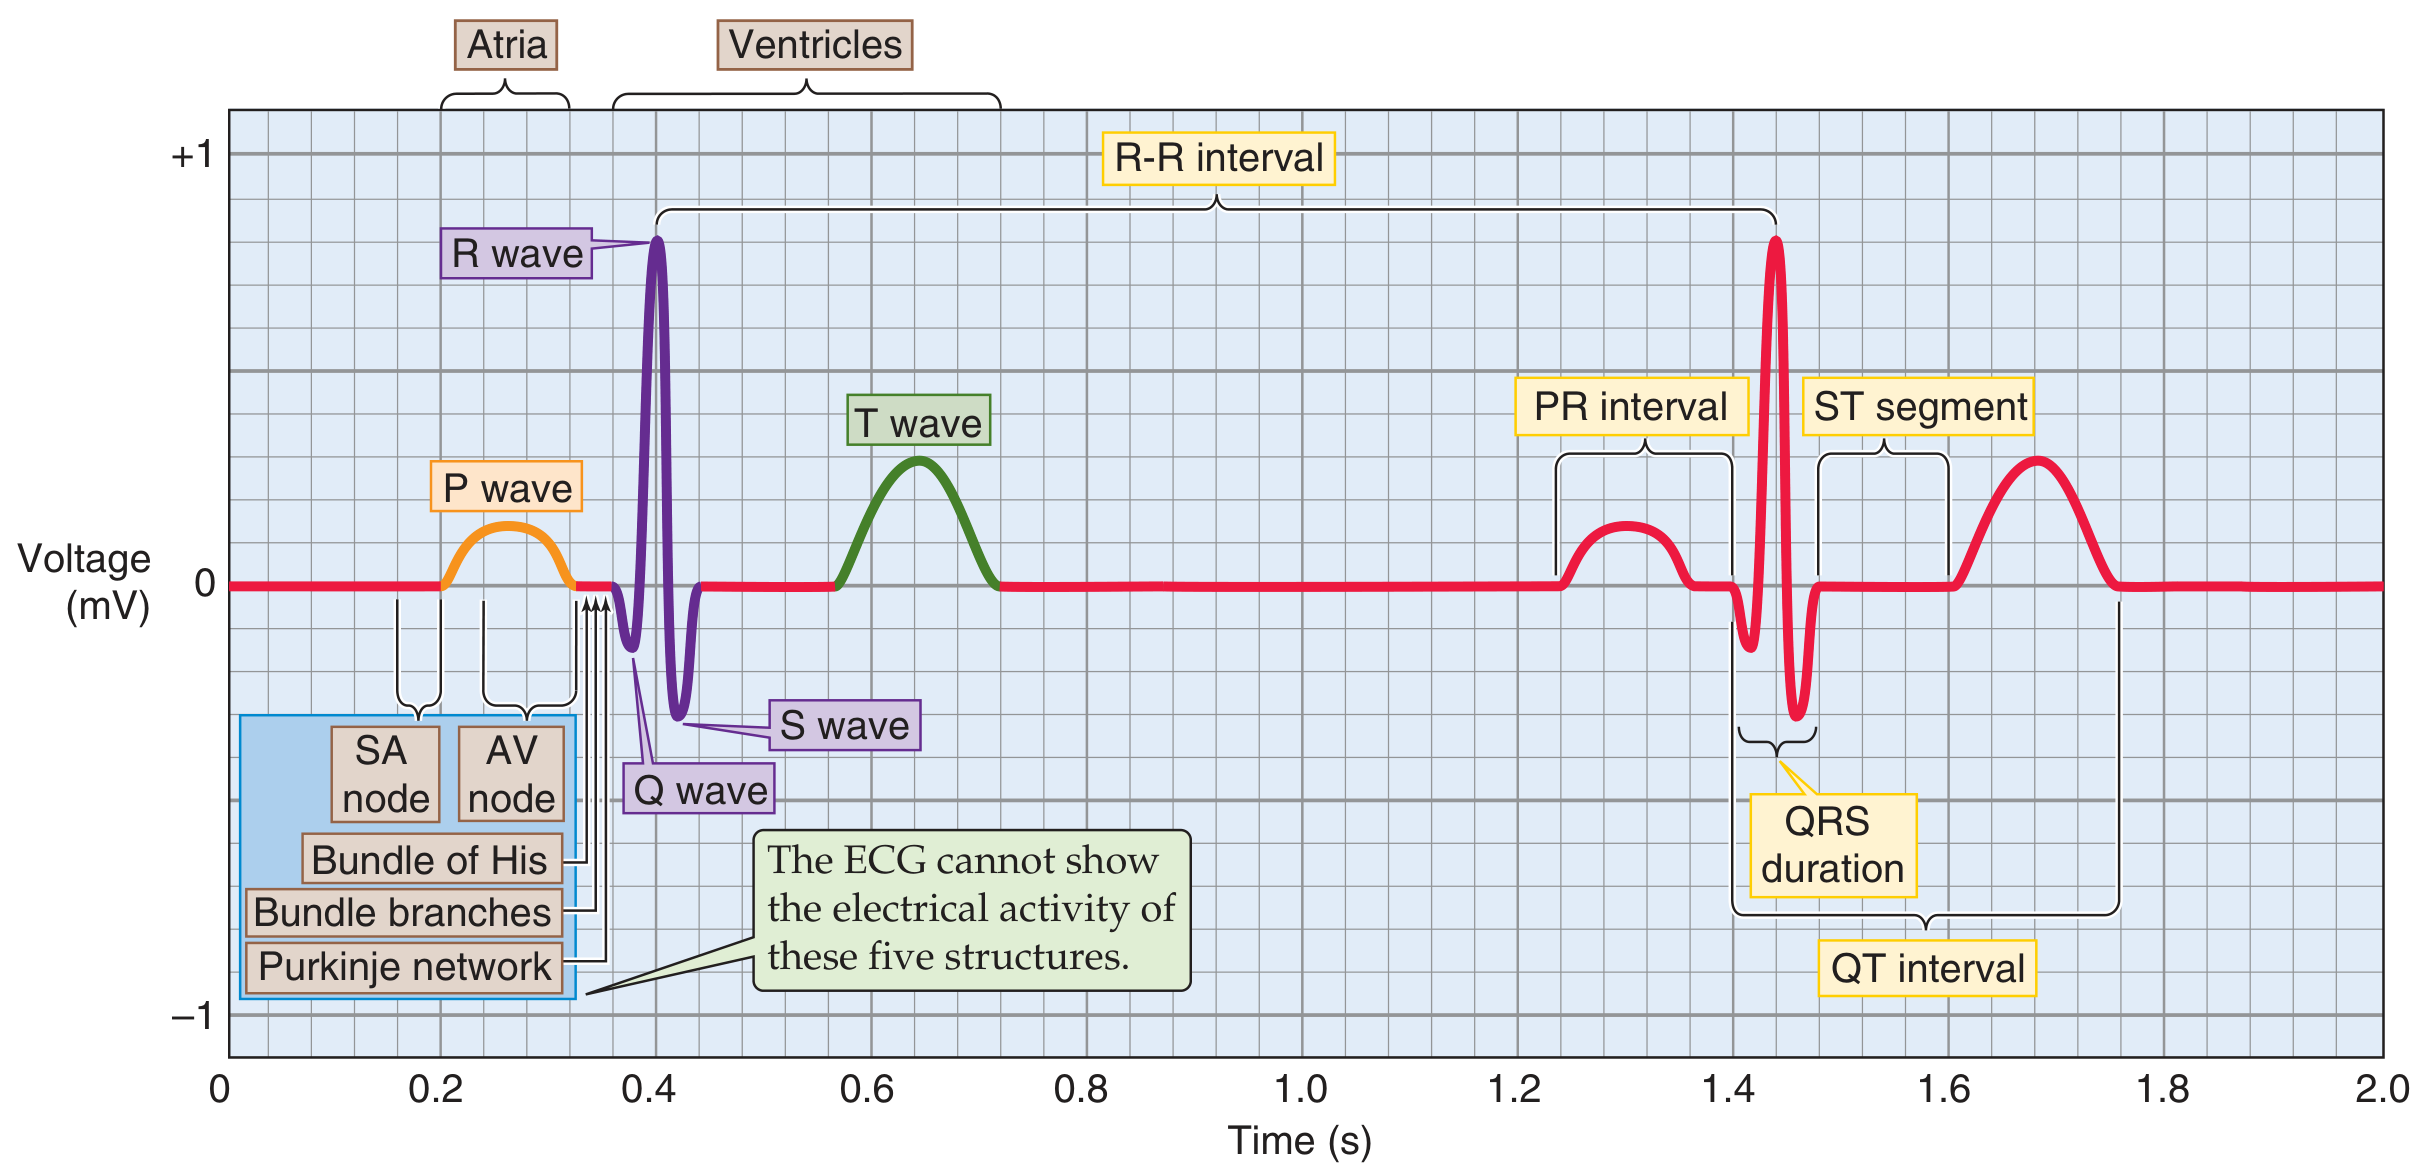
The cardiac conduction system generates the ECG in a precise sequence:
- SA node fires - not visible on ECG (too small)
- Depolarization spreads through both atria -> P wave
- Signal slows at the AV node (safety valve, prevents too-fast ventricular rates) -> PR segment (isoelectric pause)
- Signal travels through Bundle of His -> left and right bundle branches -> Purkinje fibers -> ventricular muscle -> QRS complex
- Ventricles recover (repolarize) -> T wave
"The ECG cannot show the electrical activity of the SA node, AV node, Bundle of His, bundle branches, or Purkinje network." - Medical Physiology
The ECG Waveforms in Detail

1. P Wave
- Represents: Atrial depolarization (right + left atria)
- Duration: 80-100 ms (< 0.10 sec, up to 2.5 small boxes)
- Amplitude: < 0.25 mV (2.5 mm)
- Shape: Smooth, rounded, upright in leads I, II, aVF
- Clinical significance: Widened P wave = delayed atrial conduction (e.g., left atrial enlargement). Peaked P wave = right atrial enlargement (P pulmonale). Absent P wave = atrial fibrillation, junctional rhythm.
- Note: Atrial repolarization is "buried" underneath the QRS complex and not visible on normal ECG.
2. PR Interval
- Definition: Time from the onset of P wave to the onset of QRS complex (includes the P wave + PR segment)
- Normal range: 120-200 ms (3-5 small boxes)
- Represents: Total conduction time through atrial muscle, AV node, and His-Purkinje system
- The PR segment (flat part after P wave, before QRS) corresponds specifically to AV nodal delay
- Prolonged PR (>200 ms): First-degree AV block (slow AV conduction, as from parasympathetic stimulation)
- Short PR (<120 ms): Pre-excitation syndromes (e.g., WPW) where an accessory pathway bypasses the AV node
3. QRS Complex
- Represents: Ventricular depolarization
- Duration: 60-100 ms (normal < 0.10 sec)
- Components:
- Q wave: First downward deflection (small, septal depolarization, left to right)
- R wave: First upward deflection (main ventricular depolarization, moving toward positive electrode)
- S wave: Downward deflection after R wave
- Despite ventricles being much larger than atria, QRS duration is similar to P wave duration - because the Purkinje system has very fast conduction velocity
- Widened QRS (>120 ms): Bundle branch block, ventricular ectopy, hyperkalemia, drug toxicity
- Pathological Q waves (wide >40 ms, deep >25% of R wave): Prior myocardial infarction (scar tissue)
4. ST Segment
- Definition: Isoelectric segment from the end of QRS (J point) to the start of T wave
- Normal: Flat, at the isoelectric baseline (TP segment)
- J point: Junction between QRS and ST segment
- ST elevation (>1 mm in limb leads, >2 mm in precordial leads): STEMI (acute MI), pericarditis, early repolarization, Brugada syndrome
- ST depression: Ischemia (NSTEMI/unstable angina), digoxin effect, posterior MI
5. T Wave
- Represents: Ventricular repolarization
- Shape: Asymmetric (slow rise, rapid fall), normally upright in I, II, V4-V6
- Duration: ~160 ms
- Inverted T waves: Ischemia, ventricular hypertrophy, bundle branch block, myocarditis
- Peaked T waves: Hyperkalemia (earliest ECG change), hyperacute STEMI
6. QT Interval
- Definition: From onset of QRS to end of T wave (ventricular depolarization + repolarization)
- Normal: 350-440 ms; varies with heart rate
- Must use corrected QT (QTc) to account for rate: Bazett's formula = QT / √(RR interval)
- Normal QTc: < 440 ms (men), < 460 ms (women)
- Prolonged QTc: Risk of torsades de pointes (dangerous polymorphic VT) - caused by drugs (e.g., amiodarone, quinidine, sotalol, haloperidol), electrolyte imbalances (hypokalaemia, hypomagnesaemia), congenital long QT syndrome
- Short QTc: Hypercalcaemia, digoxin effect
7. U Wave
- Represents: Possibly repolarization of papillary muscles (debated)
- Appearance: Small, low-amplitude wave after T wave, same direction as T wave
- Prominent U waves: Hypokalaemia (classic), bradycardia
- Inverted U waves: May indicate ischemia or hypertension
Cardiac Cycle Correlation
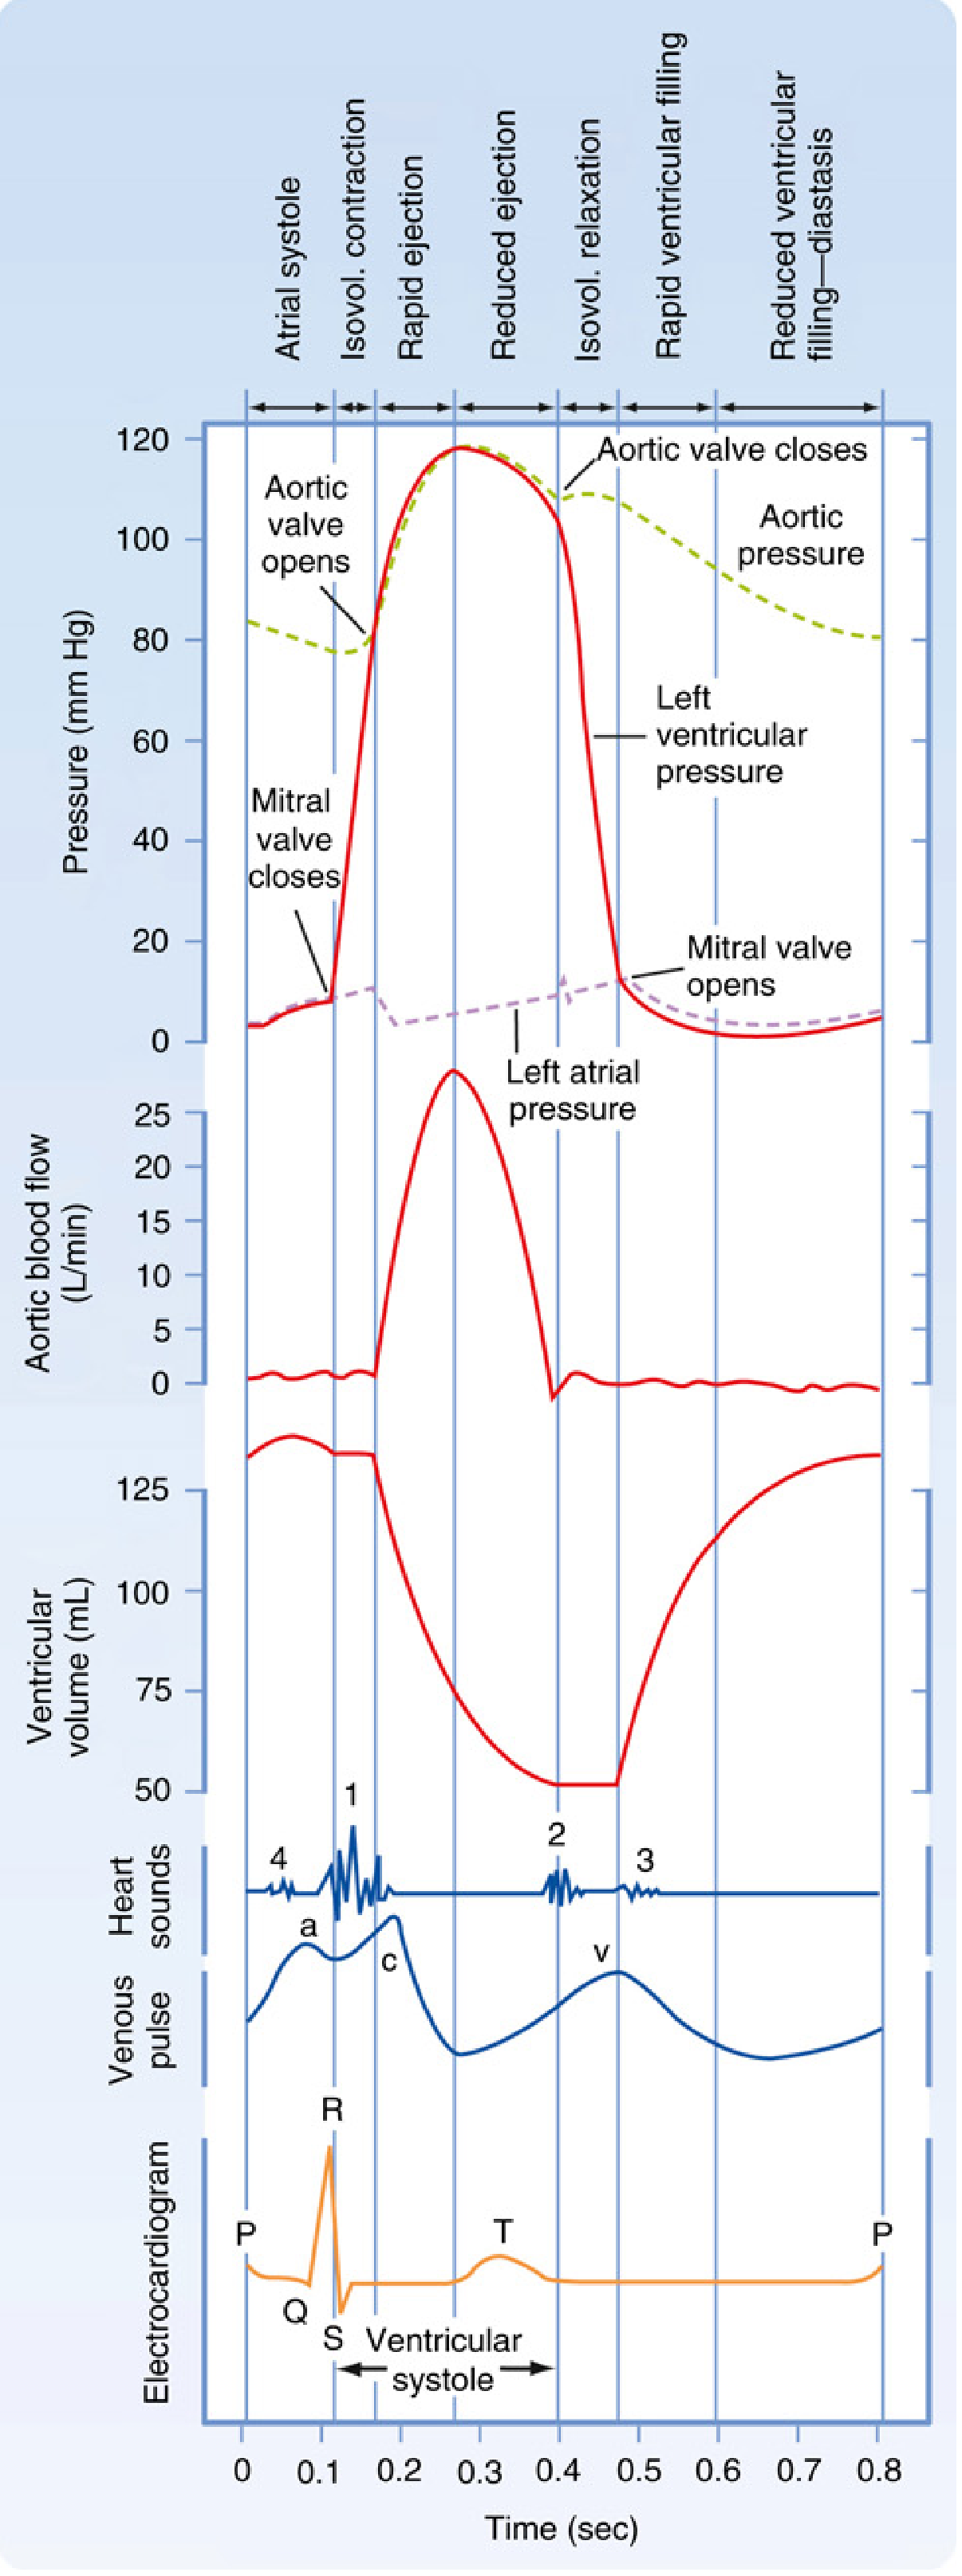
The ECG waveforms directly correspond to mechanical cardiac events:
| ECG Event | Mechanical Event |
|---|---|
| P wave onset | Atrial systole begins (SA node fires) |
| End of R wave | AV valves close (S1 heart sound) |
| QRS complex | Isovolumic contraction begins |
| QRS - T wave (ST) | Ventricular ejection (rapid then reduced) |
| T wave | Ventricular repolarization, isovolumic relaxation |
| After T wave | Ventricular filling (diastole) |
The 12-Lead ECG
A standard 12-lead ECG uses 10 electrodes to generate 12 views (leads) of the heart:
Limb Leads (Frontal Plane)
| Lead | View |
|---|---|
| I | Left arm (+) vs right arm (-); lateral |
| II | Left leg (+) vs right arm (-); inferior |
| III | Left leg (+) vs left arm (-); inferior |
| aVR | Right arm (+); cavity/global |
| aVL | Left arm (+); high lateral |
| aVF | Left foot (+); inferior |
Precordial Leads (Horizontal/Transverse Plane)
| Lead | Position | View |
|---|---|---|
| V1 | 4th intercostal space, right sternal border | Septal |
| V2 | 4th intercostal space, left sternal border | Septal |
| V3 | Between V2 and V4 | Anterior |
| V4 | 5th intercostal space, midclavicular line | Anterior |
| V5 | Anterior axillary line | Lateral |
| V6 | Midaxillary line | Lateral |
"Each lead is an axis in one of the two planes, onto which the heart projects its electrical activity... Each lead looks at the heart from a unique angle and plane." - Medical Physiology
How to Calculate Heart Rate from ECG
Method 1 (Regular rhythm):
- Count large boxes between two R waves (R-R interval)
- Rate = 300 / number of large boxes
- 1 box = 300 bpm, 2 boxes = 150, 3 = 100, 4 = 75, 5 = 60, 6 = 50
Method 2 (Irregular rhythm, e.g., AF):
- Count QRS complexes in a 10-second strip and multiply by 6
Normal sinus rate: 60-100 bpm
Cardiac Axis
The mean QRS axis represents the average direction of ventricular depolarization in the frontal plane.
| Axis | Degrees | Significance |
|---|---|---|
| Normal | -30° to +90° | Normal |
| Left axis deviation (LAD) | < -30° | Left ventricular hypertrophy, left anterior fascicular block, inferior MI |
| Right axis deviation (RAD) | > +90° | Right ventricular hypertrophy, left posterior fascicular block, lateral MI, pulmonary embolism |
| Extreme/Northwest axis | -90° to ±180° | Ventricular tachycardia, severe RVH |
Quick method: If QRS is positive in Lead I and Lead II -> normal axis. Positive I, negative II = LAD. Negative I, positive II = RAD.
Systematic Approach to Reading an ECG (Harrison's 14-Point Checklist)
Per Harrison's Principles of Internal Medicine 22e, a systematic review must include:
- Standardization / calibration / lead placement / artifacts
- Rhythm (sinus vs. non-sinus)
- Heart rate
- PR interval / AV conduction
- QRS interval (duration)
- QT / QTc interval
- Mean QRS electrical axis
- P waves (morphology, regularity)
- QRS voltages (hypertrophy criteria)
- Precordial R-wave progression (V1 to V6)
- Abnormal Q waves (infarction)
- ST segments (elevation/depression)
- T waves (inversion, peaking)
- U waves
"Many mistakes in ECG interpretation are errors of omission. Therefore, a systematic approach is essential." - Harrison's Principles of Internal Medicine 22e
Common ECG Abnormalities - Quick Summary
| Finding | Possible Diagnoses |
|---|---|
| ST elevation | STEMI, pericarditis, Brugada, early repolarization |
| ST depression | NSTEMI, ischemia, digoxin effect, posterior MI |
| Wide QRS (>120 ms) | LBBB, RBBB, hyperkalemia, ventricular ectopy |
| Prolonged PR | 1st degree AV block, digoxin |
| Short PR + delta wave | WPW syndrome |
| Peaked T waves | Hyperkalemia (earliest sign), hyperacute MI |
| Inverted T waves | Ischemia, RVH/LVH, LBBB/RBBB, PE ("S1Q3T3") |
| Long QTc | Drugs, hypokalemia, congenital LQTS |
| No P waves + irregular QRS | Atrial fibrillation |
| Saw-tooth baseline ~300/min, regular QRS | Atrial flutter |
| Osborn (J) waves | Hypothermia, hypercalcemia |
| Low voltage | Pericardial effusion, hypothyroidism, obesity, COPD |
| Electrical alternans | Cardiac tamponade |
Depolarization vs. Repolarization on ECG
A key conceptual distinction:
- Depolarization waves (P wave, QRS complex): The recording is positive when the wavefront moves toward the positive electrode
- Repolarization waves (T wave): The recording is positive when repolarization moves away from the positive electrode - which in the normal heart actually moves in the same direction as depolarization (toward the epicardium), so the T wave is normally upright like the QRS
This explains why T waves are normally in the same direction as QRS, and why T-wave inversions in certain leads can indicate pathology.
Sources:
- Guyton and Hall Textbook of Medical Physiology - Fundamentals of Electrocardiography
- Costanzo Physiology, 7th Edition - Electrocardiogram chapter
- Medical Physiology (Boron & Boulpaep) - ECG components and leads
- Goldman-Cecil Medicine - Electrocardiographic waves and standards
- Miller's Anesthesia, 10e - Electrical events and the ECG
- Harrison's Principles of Internal Medicine 22e - Clinical interpretation of the ECG
Abnormalities in ECG
Finding Sources
Finding Sources
Searching the Web
ECG abnormalities complete guide LBBB RBBB ST changes arrhythmias hypertrophy criteria
Reading File
Finding Sources
Finding Sources
Reading File
Reading File
Finding Sources
Loading Image
Reading File
Reading File
Loading Image
Loading Image
Loading Image
Finding Sources
Finding Sources
Finding Sources
Loading Image
Reading File
Loading Image
Loading Image
Now I have comprehensive textbook material and clinical images. Let me compile the full detailed answer on ECG abnormalities.
ECG Abnormalities - A Detailed Guide
ECG abnormalities fall into six major categories: (1) Conduction defects, (2) Ischemia and infarction, (3) Chamber enlargement and hypertrophy, (4) Arrhythmias, (5) Electrolyte and metabolic disturbances, and (6) Miscellaneous/drug effects.
CATEGORY 1: CONDUCTION ABNORMALITIES
A. AV Blocks
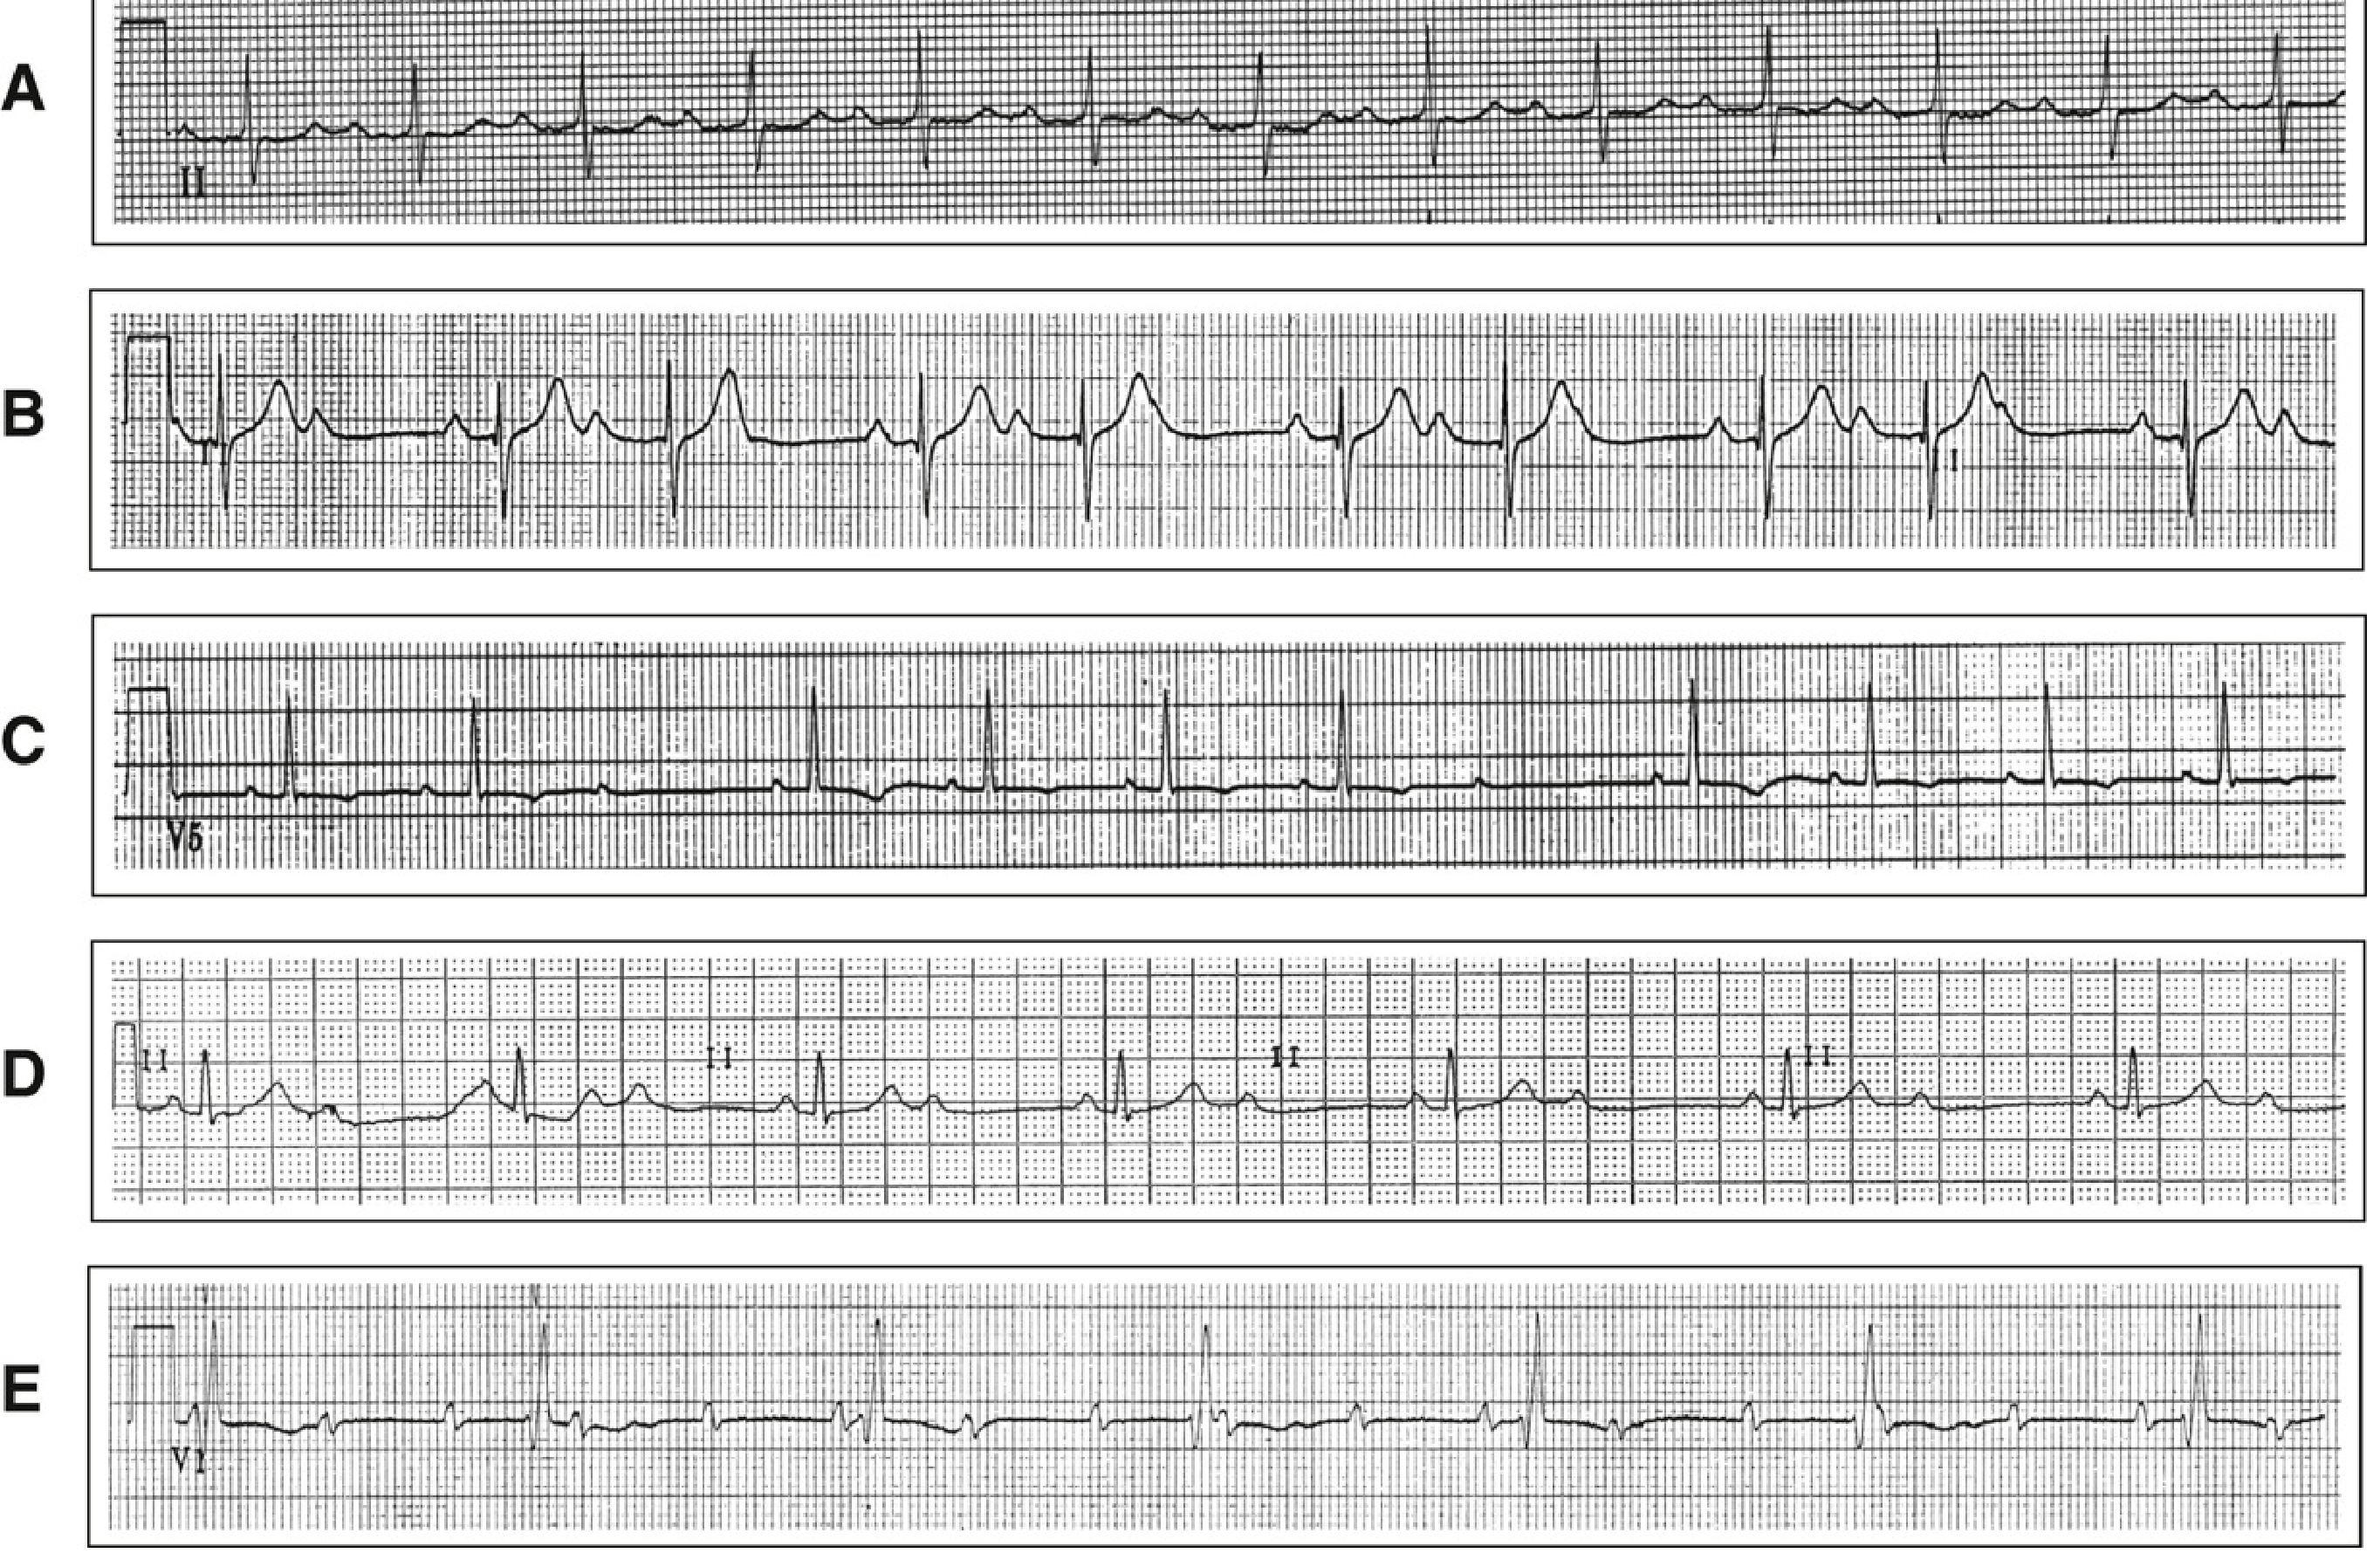
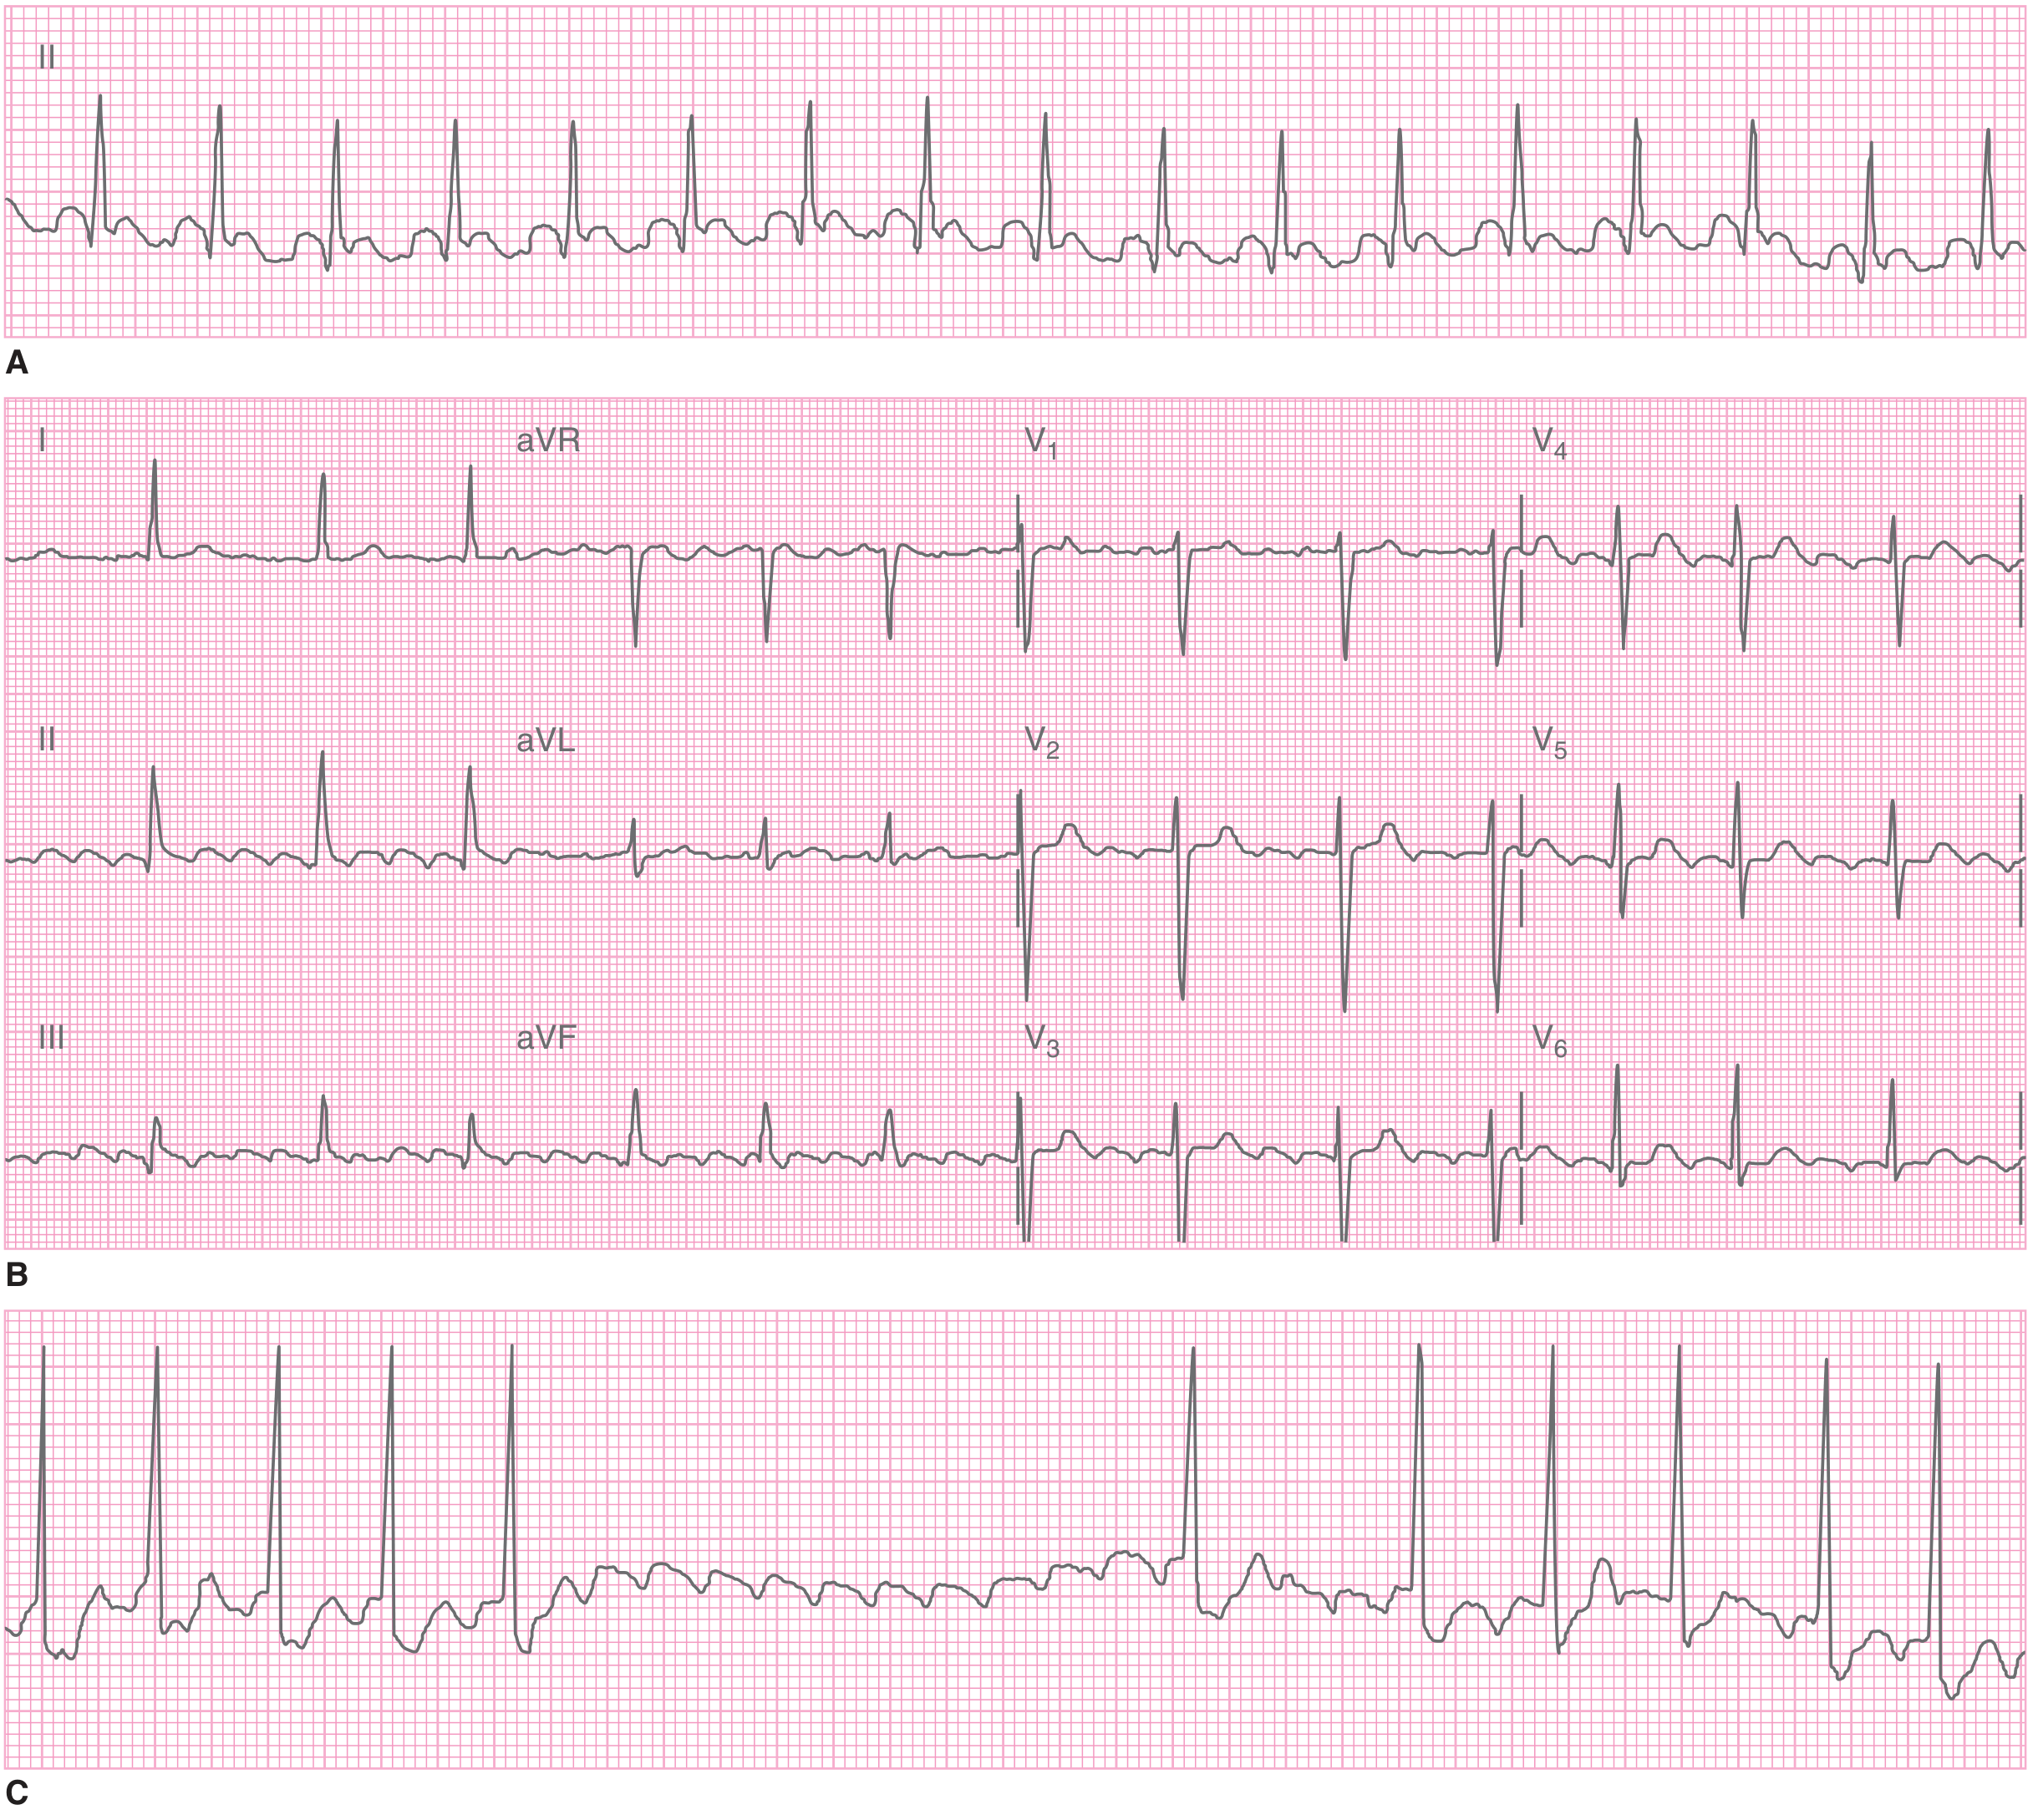
1st Degree AV Block (Panel A above)
- ECG: PR interval > 200 ms on every beat; all P waves conduct
- Mechanism: Slowed conduction through the AV node (no dropped beats)
- Causes: Vagal tone, beta-blockers, digoxin, inferior MI, myocarditis, normal variant in athletes
- Clinical: Usually benign; no treatment needed
2nd Degree AV Block - Mobitz Type I (Wenckebach) (Panel B above)
- ECG:
- Progressive PR prolongation with each beat
- Progressive shortening of the RR interval
- Then a dropped QRS (P wave with no QRS)
- "Group beating" pattern
- Mechanism: Block within the AV node itself
- Causes: Inferior MI, increased vagal tone, medications
- Clinical: Usually benign; progression to complete block uncommon
2nd Degree AV Block - Mobitz Type II (Panel C above)
- ECG:
- PR interval constant (does not lengthen)
- Sudden, unexpected dropped QRS without warning
- Often accompanied by bundle branch block
- Mechanism: Block below the AV node (infranodal - His-Purkinje system)
- Causes: Anterior MI, fibrosis of conduction system
- Clinical: Serious - high risk of progression to complete heart block; often requires pacemaker
2:1 AV Block (Panel D above)
- ECG: Alternate P waves fail to conduct; every other QRS is dropped
- Distinction: Narrow QRS suggests Mobitz I (nodal), wide QRS + bundle branch block suggests Mobitz II (infranodal)
3rd Degree (Complete) AV Block (Panel E above)
- ECG:
- Complete dissociation between P waves and QRS complexes
- P waves fire at their own rate (faster)
- QRS complexes fire at their own (escape) rate (slower)
- "P waves march through" the QRS complexes
- Escape rhythm: junctional (narrow QRS, 40-60 bpm) or ventricular (wide QRS, 20-40 bpm)
- Causes: Inferior MI (often reversible), anterior MI (often permanent), Lyme disease, congenital, drug toxicity
- Clinical: Requires urgent pacing
B. Bundle Branch Blocks
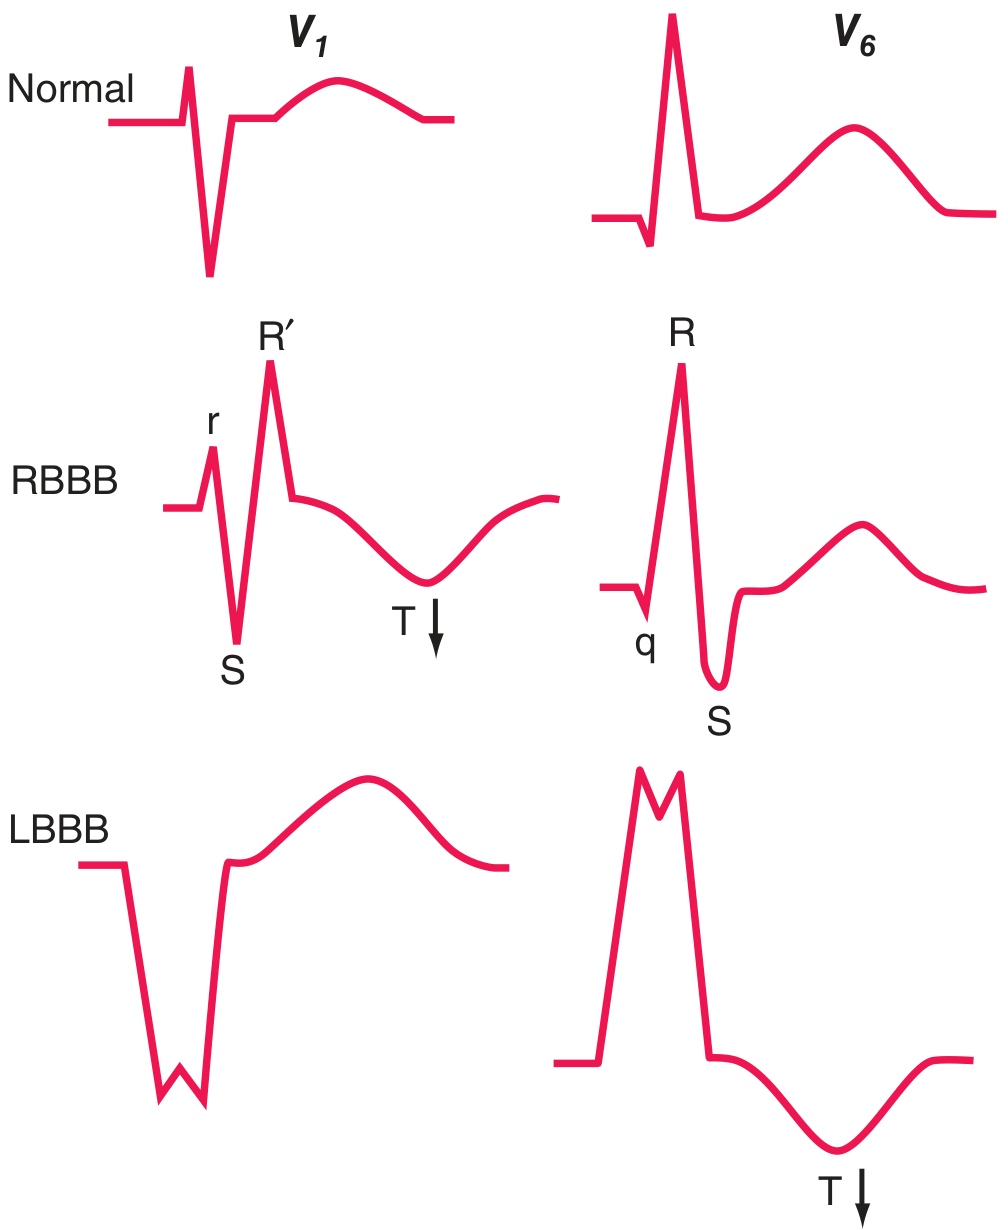
The key principle: the QRS vector is oriented in the direction of the region where depolarization is delayed. T waves are typically discordant (opposite direction) to the last QRS deflection in bundle branch blocks.
Right Bundle Branch Block (RBBB)
| Feature | Finding |
|---|---|
| QRS duration | ≥ 120 ms |
| V1 pattern | rSR' (M-shaped, "rabbit ears") or rsR' |
| V6 pattern | Wide, slurred S wave (qRS) |
| Lead I | Wide terminal S wave |
| T waves | Inverted in V1-V2 (secondary change, normal) |
| Axis | Usually normal |
- Causes: Congenital (ASD), pulmonary embolism, RVH, ischemic heart disease, or normal variant
- Right bundle block more commonly seen without underlying organic disease than LBBB
Left Bundle Branch Block (LBBB)
| Feature | Finding |
|---|---|
| QRS duration | ≥ 120 ms |
| V1 pattern | QS or rS (deep, wide, often notched) |
| V6 pattern | Broad, monophasic R wave (notched "M" shape), no q wave |
| Lead I, aVL | Wide, notched R wave |
| T waves | Inverted in V5-V6 (secondary, discordant with QRS) |
| Septal q waves | Absent (hallmark - septal depolarization reversed) |
- Causes: Always consider organic disease - coronary artery disease, hypertensive heart disease, aortic valve disease, cardiomyopathy
- New LBBB in context of chest pain was formerly considered a "STEMI equivalent"
- LBBB makes it very difficult to diagnose ischemia on ECG (use Sgarbossa criteria for MI in LBBB)
Fascicular Blocks (Hemiblocks)
| Block | Axis | QRS Duration | Key Feature |
|---|---|---|---|
| Left anterior fascicular block (LAFB) | -45° to -90° (LAD) | < 120 ms | qR in aVL, rS in inferior leads |
| Left posterior fascicular block (LPFB) | +90° to +180° (RAD) | < 120 ms | rS in I/aVL, qR in inferior leads (rare) |
Bifascicular block = RBBB + LAFB (most common combination) or RBBB + LPFB.
CATEGORY 2: ISCHEMIA AND INFARCTION
Ischemic ST Changes
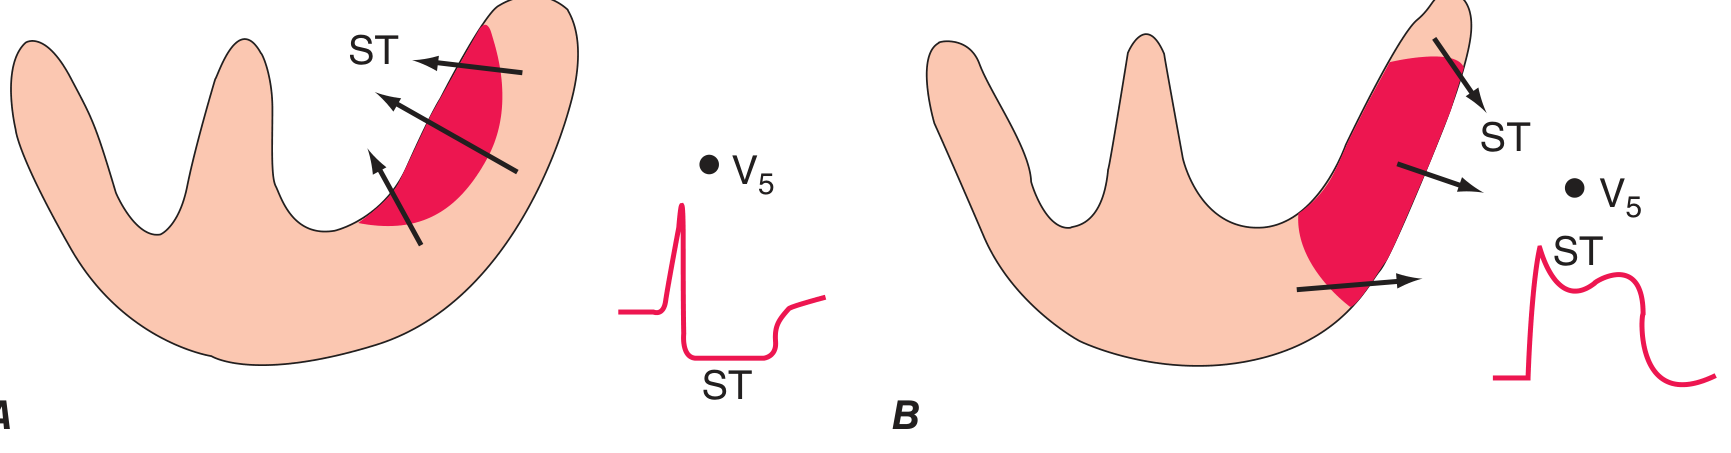
The "current of injury" explains ST changes:
- A (subendocardial ischemia): ST vector points inward toward the cavity -> overlying leads show ST depression
- B (transmural/epicardial ischemia): ST vector points outward -> overlying leads show ST elevation
STEMI - Regional Distribution
| Territory | Culprit Artery | Leads with ST Elevation | Reciprocal Changes |
|---|---|---|---|
| Anterior | LAD | V1-V4 | II, III, aVF |
| Lateral | LCX | I, aVL, V5-V6 | II, III, aVF |
| Inferior | RCA (85%), LCX (15%) | II, III, aVF | I, aVL |
| Posterior | RCA / LCX | (no direct elevation) | ST depression V1-V3 + tall R in V1 |
| Right ventricular | Proximal RCA | V4R (right-sided leads) | - |
| Anterolateral | LAD or LCX | V1-V6, I, aVL | II, III, aVF |
ECG Evolution of STEMI (Temporal Changes)
| Stage | Time | ECG Finding |
|---|---|---|
| Hyperacute | Minutes | Tall, peaked T waves (earliest sign) |
| Acute | Hours | ST elevation (convex upward) + reciprocal ST depression |
| Early evolving | Hours-days | ST elevation + T-wave inversion in same leads, Q waves begin |
| Established | Days-weeks | Pathological Q waves, T-wave inversions, ST returning to baseline |
| Chronic/old | Weeks-months | Q waves persist; T waves may normalize |
Pathological Q Waves
- Width > 40 ms (1 small box) AND depth > 25% of R wave amplitude
- Indicate myocardial necrosis (scar)
- Small q waves in lateral leads (I, aVL, V5-V6) are normal (septal depolarization)
Wellens Sign
- Deep, symmetric T-wave inversions in V1-V4 (or biphasic T in V2-V3)
- Suggests critical LAD stenosis (proximal)
- Associated with severe anterior wall ischemia without infarction
De Winter T Waves
- ST depression at J point + tall, symmetric upright T waves in precordial leads
- STEMI equivalent - proximal LAD occlusion; no ST elevation present
CATEGORY 3: CHAMBER ENLARGEMENT AND HYPERTROPHY
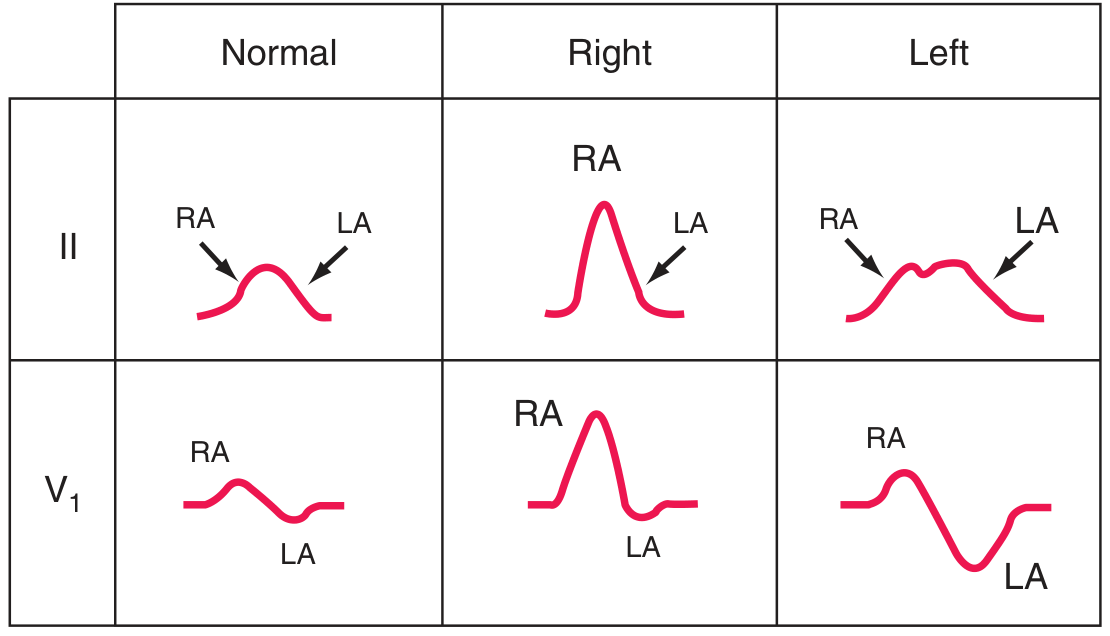
Atrial Abnormalities
| Condition | ECG Finding |
|---|---|
| Right atrial enlargement (P pulmonale) | Tall, peaked P wave > 2.5 mm in lead II; prominent positive P in V1 |
| Left atrial enlargement (P mitrale) | Broad, notched ("M-shaped") P wave ≥ 120 ms in lead II; biphasic P in V1 with prominent negative (terminal) component |
Ventricular Hypertrophy
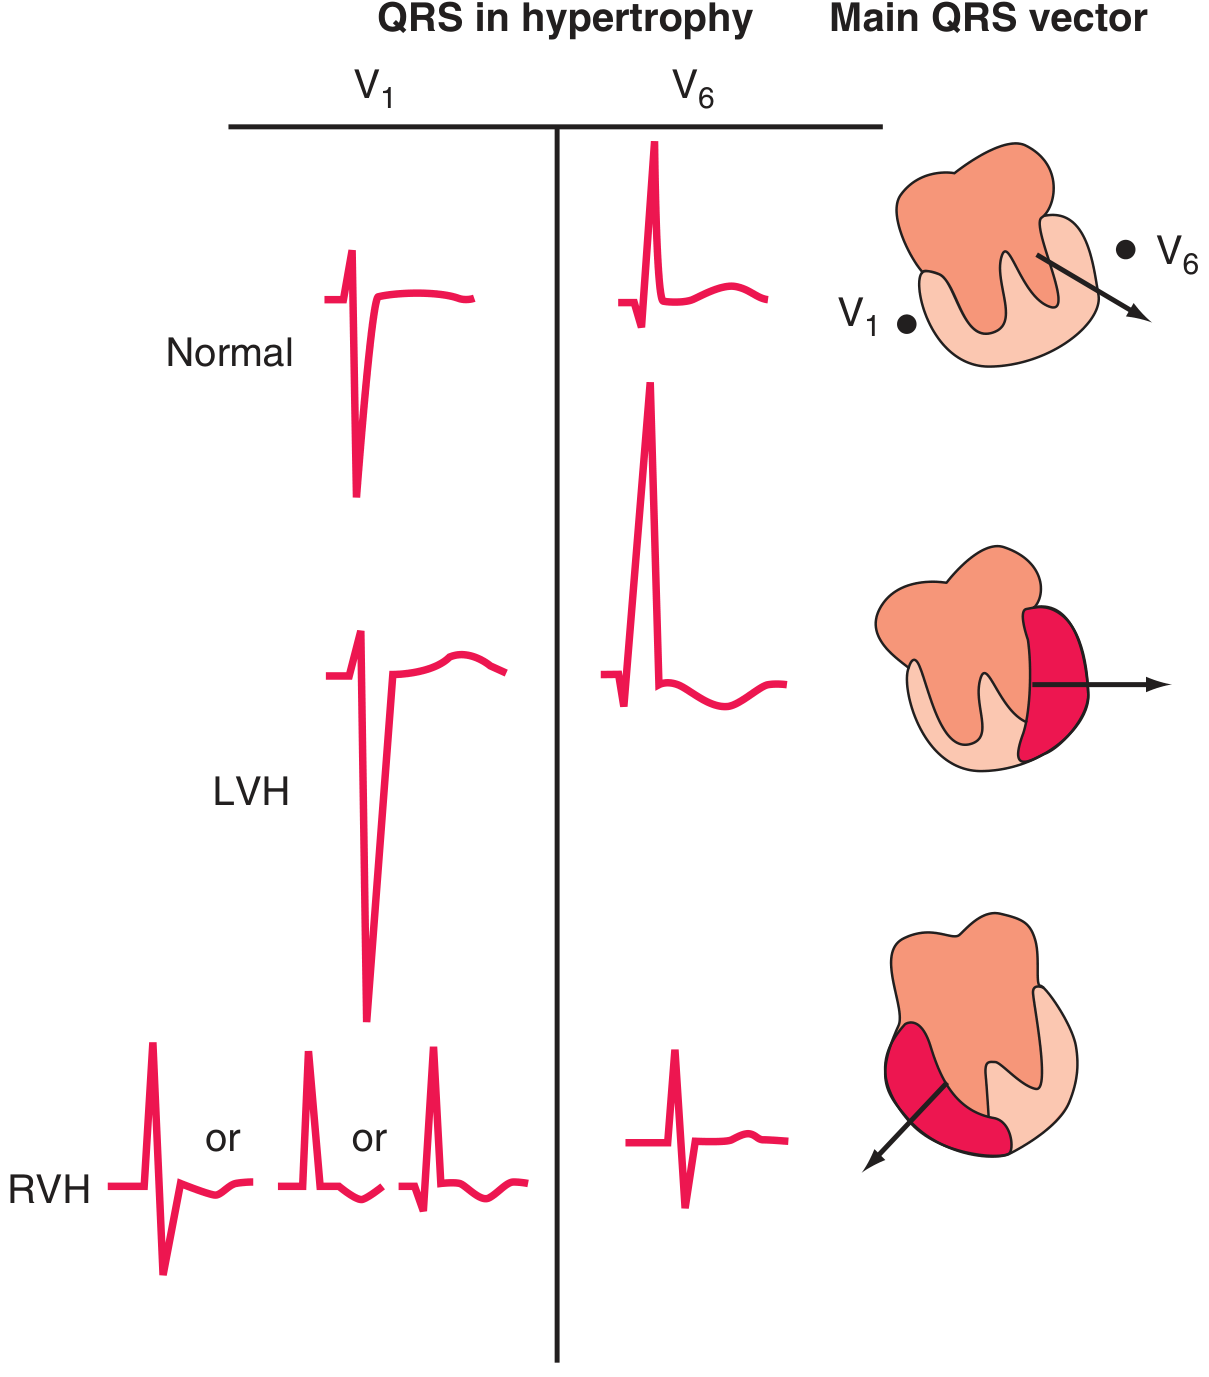
Left Ventricular Hypertrophy (LVH)
The increased LV muscle mass amplifies leftward and posterior electrical forces.
Voltage Criteria (Sokolow-Lyon):
- S in V1 + R in V5 or V6 > 35 mm; OR
- R in aVL > 11 mm; OR
- R in I + S in III > 25 mm
Associated findings:
- Left axis deviation
- "LV strain" pattern: ST depression + T-wave inversion in I, aVL, V5-V6 (lateral leads)
- Prolonged QRS duration (< 120 ms but approaching it)
- Left atrial enlargement pattern
Causes: Hypertension (most common), aortic stenosis, hypertrophic cardiomyopathy
Right Ventricular Hypertrophy (RVH)
- Right axis deviation (> +90°)
- Dominant R wave in V1 (R > S in V1) - various morphologies: R, RS, or qR
- Deep S waves in V5, V6 (prominent S across lateral leads)
- "RV strain" pattern: T-wave inversions in V1-V3 (right precordial leads)
- ST depression in right precordial leads
Causes: Pulmonary hypertension (most common), pulmonary stenosis, ASD, COPD, PE
CATEGORY 4: ARRHYTHMIAS
A. Supraventricular Arrhythmias
Sinus Tachycardia
- Rate > 100 bpm; normal P wave precedes every QRS
- Causes: pain, fever, anxiety, hyperthyroidism, PE, anemia
Atrial Fibrillation (AF)
- ECG:
- No identifiable P waves - replaced by irregular fibrillatory (f) baseline
- Irregularly irregular QRS complexes
- Narrow QRS (unless aberrant conduction or bundle branch block)
- Ventricular rate 100-160 bpm if uncontrolled
- Causes: Hypertension, heart failure, valvular disease, hyperthyroidism, alcohol ("holiday heart"), post-cardiac surgery
- Risk: Stroke (thrombus in left atrial appendage)
Atrial Flutter
- ECG:
- Sawtooth ("flutter") waves at ~300 bpm in leads II, III, aVF
- Regular QRS with fixed ratio conduction: 2:1 (ventricular rate ~150), 3:1, 4:1
- 2:1 flutter is the most common and classic
- Mechanism: Re-entrant circuit in right atrium around tricuspid valve annulus
SVT (AVNRT / AVRT)
- ECG:
- Narrow-complex tachycardia, regular, rate 150-250 bpm
- P waves absent, buried in QRS, or immediately after QRS (retrograde)
- Sudden onset and termination ("paroxysmal")
B. Pre-excitation Syndromes
Wolff-Parkinson-White (WPW)
- ECG:
- Short PR interval (< 120 ms)
- Delta wave - slurred upstroke at the beginning of QRS
- Wide QRS (> 120 ms, due to fusion of normal and accessory pathway conduction)
- Secondary ST-T changes (discordant)
- Mechanism: Accessory pathway (Bundle of Kent) bypasses the AV node, causing early ventricular pre-excitation
- Risk: If AF develops in WPW, rapid conduction over the accessory pathway can cause ventricular fibrillation (life-threatening)
C. Ventricular Arrhythmias
Premature Ventricular Contractions (PVCs)
- ECG:
- Wide, bizarre QRS (> 120 ms) appearing early
- Compensatory pause follows
- No preceding P wave
- T wave in opposite direction to QRS
- Isolated PVCs: usually benign; frequent or runs of PVCs need evaluation
Ventricular Tachycardia (VT)
- ECG:
- Wide-complex tachycardia (QRS > 120 ms), rate 100-250 bpm
- Regular or slightly irregular
- AV dissociation (P waves independent of QRS) - pathognomonic when present
- Fusion beats and capture beats confirm VT
- Concordance across precordial leads (all positive or all negative)
- VT vs SVT with aberrancy: AV dissociation, extreme axis, RS > 100 ms, fusion beats all favor VT
Ventricular Fibrillation (VF)
- ECG: Chaotic, irregular, disorganized electrical activity; no recognizable QRS, ST, or T waves
- No effective cardiac output; cardiac arrest
- Requires immediate defibrillation
Torsades de Pointes
- ECG: Polymorphic VT where QRS complexes appear to "twist" around the isoelectric baseline
- Associated with prolonged QTc
- Can degenerate into VF
- Causes: Long QT syndrome (drugs, electrolytes)
CATEGORY 5: ELECTROLYTE DISTURBANCES
Hyperkalemia (Progressive Changes with Rising K+)
| K+ Level | ECG Change |
|---|---|
| 5.5-6.5 mEq/L | Tall, peaked (tented) T waves - earliest sign |
| 6.5-7.5 mEq/L | Flattened/lost P waves, prolonged PR |
| 7.0-8.0 mEq/L | Widened QRS complex |
| > 8.0 mEq/L | Sine wave pattern (QRS merges with T wave), VF, asystole |
Hypokalemia
- Flattened or inverted T waves
- Prominent U waves (U wave > T wave in same lead)
- ST depression
- Prolonged QU interval (often mistaken for prolonged QT)
- Severe: widened QRS, prolonged PR
Hypercalcemia
- Short QT interval (shortened ST segment)
- Osborn (J) waves occasionally
- Bradycardia in severe cases
Hypocalcemia
- Prolonged QT interval (elongated ST segment)
CATEGORY 6: MISCELLANEOUS ECG ABNORMALITIES
Pericarditis
- ECG:
- Diffuse ST elevation (concave/saddle-shaped, unlike the convex shape of STEMI) in most leads
- PR depression in leads I, II, V4-V6 (and PR elevation in aVR) - classic sign
- No reciprocal ST changes (unlike STEMI)
- Evolves: ST elevation -> ST normalizes -> T-wave inversions
- Cause: Viral (most common), autoimmune, post-MI (Dressler's)
Pulmonary Embolism
- ECG:
- Sinus tachycardia (most common finding)
- S1Q3T3 pattern - S wave in lead I, Q wave in III, T-wave inversion in III
- Right axis deviation
- New RBBB (complete or incomplete)
- T-wave inversions in V1-V4 (right heart strain)
- These changes are nonspecific; normal ECG does not exclude PE
Hypothermia
- Osborn (J) waves - positive deflection at the junction of QRS and ST segment (J point), most prominent in V4-V6 and inferior leads
- Bradycardia; prolonged PR, QRS, QT intervals
- "Shivering artifact" on baseline
Brugada Syndrome
- ECG:
- ST elevation in V1-V3 with a characteristic coved (Type 1) or saddle-back (Type 2) shape
- Incomplete or complete RBBB appearance
- Normal QT interval
- Clinical: Risk of sudden cardiac death from polymorphic VT/VF
- Associated with sodium channel mutation (SCN5A); often unmasked by fever, drugs
Digoxin Effect
- "Reverse tick" or "Salvador Dali moustache" appearance of ST segment
- ST depression with downward-concave "scooped" morphology in lateral leads
- Shortened QT interval
- T-wave flattening or inversion
- Bradycardia, prolonged PR
Digoxin Toxicity
- Almost any arrhythmia, but especially: PAT with block, bidirectional VT, AV blocks, junctional rhythms
- Combination of increased automaticity + slowed conduction is the hallmark
Long QT Syndrome (LQTS)
- QTc > 440 ms (men) or > 460 ms (women)
- Congenital (LQT1, LQT2, LQT3 - different genes, different triggers)
- Acquired: drugs (antiarrhythmics, antipsychotics, antibiotics like azithromycin), hypokalemia, hypomagnesemia, hypothyroidism
- Risk: Torsades de pointes -> syncope -> VF -> sudden death
Cardiac Tamponade
- ECG:
- Sinus tachycardia
- Low voltage QRS across all leads
- Electrical alternans - alternating QRS height with each beat (pathognomonic for tamponade when combined with low voltage and tachycardia)
- Mechanism: Swinging motion of heart within pericardial fluid
Summary Quick Reference Table
| Category | Abnormality | Key ECG Feature |
|---|---|---|
| Conduction | 1st degree AV block | PR > 200 ms |
| Wenckebach | Progressive PR prolongation, then dropped beat | |
| Mobitz II | Fixed PR, sudden dropped beat | |
| Complete heart block | AV dissociation | |
| RBBB | rSR' in V1, wide S in V6 | |
| LBBB | QS in V1, broad R in V6, no septal q | |
| Ischemia | STEMI | Convex ST elevation + reciprocal changes |
| NSTEMI/UA | ST depression or T-wave inversion | |
| Old MI | Pathological Q waves | |
| Hypertrophy | LVH | R in V5/V6 + S in V1 > 35 mm, LAD, strain |
| RVH | Dominant R in V1, RAD, right strain | |
| LAE | Broad notched P or negative terminal V1 component | |
| RAE | Peaked P > 2.5 mm in lead II | |
| Arrhythmia | AF | Irregularly irregular, no P waves |
| Flutter | Sawtooth at 300 bpm, 2:1 or 3:1 | |
| WPW | Short PR, delta wave, wide QRS | |
| VT | Wide complex, AV dissociation | |
| Torsades | Polymorphic VT twisting around baseline | |
| Electrolyte | Hyperkalemia | Peaked T -> widened QRS -> sine wave |
| Hypokalemia | Flat T, prominent U wave | |
| Hypercalcemia | Short QT | |
| Hypocalcemia | Long QT | |
| Misc | Pericarditis | Diffuse saddle ST, PR depression |
| PE | S1Q3T3, RBBB, sinus tachycardia | |
| Tamponade | Low voltage + electrical alternans + tachycardia | |
| Brugada | Coved ST in V1-V3 + RBBB-like | |
| Digoxin effect | Scooped ST depression, short QT | |
| Long QT | QTc > 440/460 ms, risk of torsades |
Sources:
- Harrison's Principles of Internal Medicine 22e - Myocardial ischemia, bundle branch blocks, hypertrophy
- Goldman-Cecil Medicine - ECG waves, conduction abnormalities, BBB table
- Washington Manual of Medical Therapeutics - AV blocks classification
- Medical Physiology (Boron & Boulpaep) - WPW, pre-excitation
- Miller's Anesthesia 10e - Cardiac rhythm disorders
- Tintinalli's Emergency Medicine - Atrial flutter/fibrillation, ECG in emergency
Ct Scan Abnormal findings in consize
Finding Sources
Searching the Web
CT scan abnormal findings radiology head chest abdomen concise summary
Finding Sources
Finding Sources
Finding Sources
Finding Sources
Finding Sources
Finding Sources
Reading File
Finding Sources
Reading File
Reading File
Loading Image
Finding Sources
Finding Sources
I now have sufficient material from authoritative textbooks to compile a thorough, concise answer. Here it is:
CT Scan - Abnormal Findings (Concise Guide)
CT Basics: Understanding Density (Hounsfield Units)
Before reading findings, understanding CT density (attenuation) is key:
| Tissue/Substance | Hounsfield Units (HU) | Appearance |
|---|---|---|
| Air | -1000 | Black |
| Fat | -50 to -80 | Dark gray |
| Water/CSF | 0 | Gray |
| Soft tissue/Brain | 20-80 | Gray |
| Fresh blood | ~80 | Bright/White |
| Bone | >400 | Bright white |
| Iodine contrast | Very high | Bright white |
- Hyperdense = brighter than surrounding tissue (blood, calcification, contrast, bone)
- Hypodense = darker than surrounding tissue (air, fat, edema, necrosis, CSF)
- Isodense = same density as surrounding tissue (can be missed - e.g., subacute SDH)
CT HEAD - Abnormal Findings
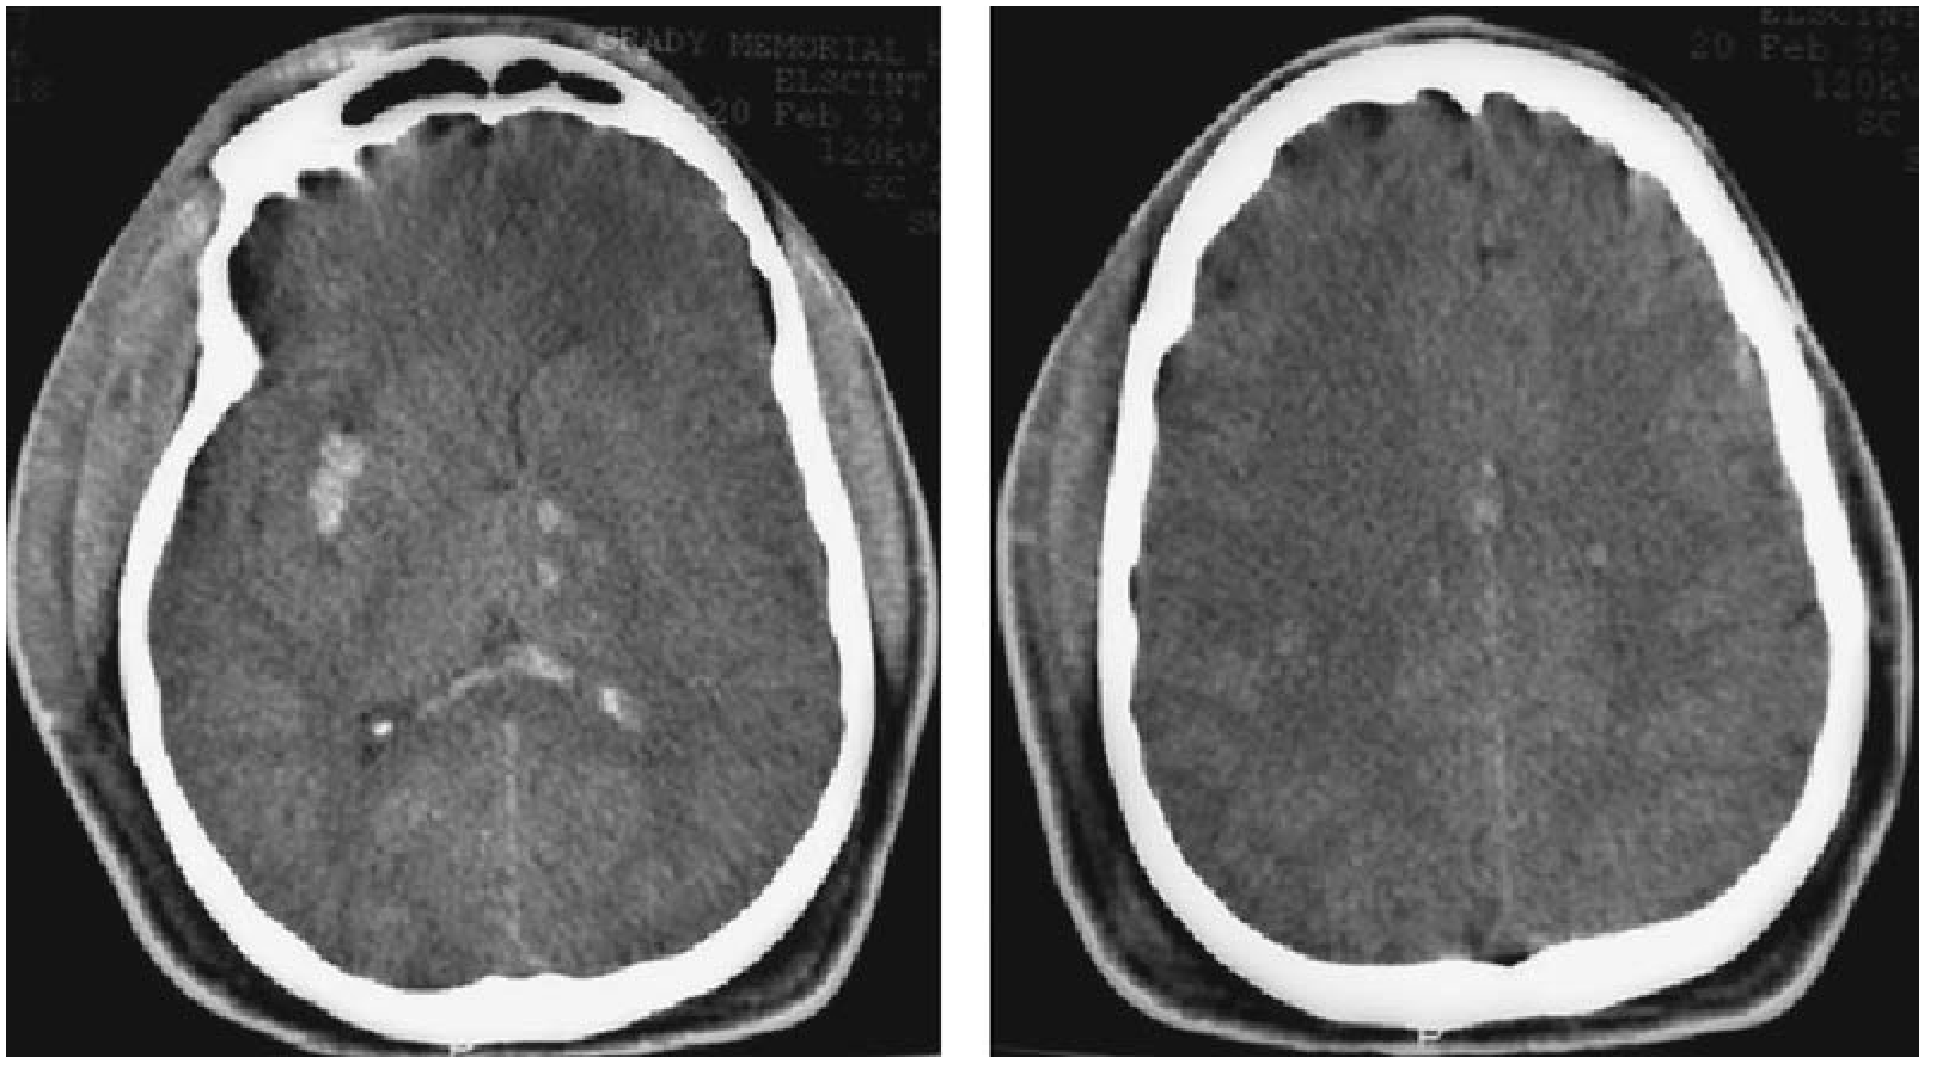
1. Intracranial Hemorrhages
| Type | Location | CT Appearance | Classic Cause |
|---|---|---|---|
| Epidural hematoma (EDH) | Between skull and dura | Biconvex (lens/football-shaped) hyperdense collection | Temporal skull fracture, middle meningeal artery tear |
| Subdural hematoma (SDH) | Between dura and arachnoid | Crescent-shaped hyperdense (acute) or hypodense (chronic) collection | Bridging vein tear; elderly, alcoholics |
| Subarachnoid hemorrhage (SAH) | Subarachnoid space | Hyperdense blood in basal cisterns, sulci, sylvian fissures | Berry aneurysm rupture; "thunderclap" headache |
| Intraparenchymal/intracerebral hemorrhage | Brain tissue | Hyperdense ovoid/irregular lesion in parenchyma | Hypertension (basal ganglia, thalamus), AVM, amyloid |
| Intraventricular hemorrhage | Ventricles | Hyperdense blood within ventricles | Severe SAH, hypertension, trauma |
Key: Subacute SDH (1-3 weeks) becomes isodense with brain - easy to miss. Bilateral isodense SDH may appear as "pseudonormalization." Look for effacement of sulci and midline shift.
2. Ischemic Stroke
- Acute (< 6 hrs): CT may be normal or show subtle hypodensity; CT is used mainly to exclude hemorrhage before thrombolysis
- Early signs:
- Loss of gray-white differentiation (insular ribbon sign, loss of basal ganglia outline)
- Hyperdense MCA sign - clot visible as hyperdense middle cerebral artery
- Sulcal effacement
- Established (> 24 hrs): Well-defined wedge-shaped hypodense area in a vascular territory
- Chronic: Encephalomalacia (very dark/hypodense area), ex-vacuo dilatation of nearby ventricle
3. Brain Tumors
- Primary (e.g., glioblastoma): Heterogeneous mass with surrounding vasogenic edema (finger-like hypodensity in white matter), ring enhancement on contrast, mass effect, midline shift
- Metastases: Multiple enhancing nodules at gray-white junction, marked surrounding edema
- Meningioma: Extraaxial, isodense or hyperdense, homogeneous enhancement, dural tail, may have calcification
4. Cerebral Edema / Raised ICP
- Loss of cortical sulci
- Effacement of basal cisterns (compressed by swelling)
- Compressed ventricles
- Midline shift (brain pushed toward opposite side)
- Tonsillar herniation: Cerebellar tonsils displaced below foramen magnum
5. Hydrocephalus
- Obstructive (non-communicating): Dilated ventricles proximal to obstruction; normal/small distal ventricles; periventricular lucency ("transependymal edema") in acute cases
- Communicating: All ventricles dilated; sulci may be enlarged (NPH) or effaced (SAH-related)
6. Cerebral Contusion
- Heterogeneous hyperdense (blood) and hypodense (edema) areas, typically anterior temporal or posterior frontal lobes ("coup-contrecoup")
- May be normal initially with delayed bleed
CT CHEST - Abnormal Findings
1. Pulmonary Parenchyma
| Finding | Description | Key Diagnoses |
|---|---|---|
| Consolidation | Complete airspace filling; air bronchograms visible | Pneumonia (lobar/broncho), pulmonary edema, hemorrhage, lung cancer |
| Ground-glass opacity (GGO) | Hazy increased attenuation, vessels still visible through it | Interstitial pneumonia (viral/COVID-19), pulmonary edema, early fibrosis, alveolar hemorrhage |
| Cavitation | Air-containing lucency within consolidation or mass | TB, lung abscess, squamous cell carcinoma, Wegener's, septic emboli |
| Tree-in-bud | Centrilobular nodules + branching opacities | Endobronchial spread of infection (TB, atypical pneumonia, bronchiolitis) |
| Honeycombing | Clustered cystic spaces with thick walls, subpleural | End-stage UIP/IPF (usual interstitial pneumonia) |
| Crazy paving | GGO + interlobular septal thickening | Alveolar proteinosis, COVID-19, ARDS |
| Pulmonary nodule | Round lesion < 3 cm | Granuloma (benign, calcified), primary lung cancer (spiculated), metastasis |
| Mass | > 3 cm | High suspicion for malignancy; primary or secondary |
| Atelectasis | Volume loss, displacement of fissures, compensatory emphysema | Obstruction (mucus plug, endobronchial tumor), compression |
2. Pleural Space
| Finding | CT Appearance | Significance |
|---|---|---|
| Pleural effusion | Dependent fluid collection; free/loculated | Heart failure, infection (parapneumonic), malignancy, PE |
| Empyema | Loculated, thick-walled, pleural enhancement, "split pleura" sign | Infected pleural space; requires drainage |
| Pneumothorax | Air (hypodense) in pleural space; collapsed lung; no lung markings | Trauma, spontaneous (tall thin male), tension |
| Pleural thickening/calcification | Thickened, irregular pleura | Prior TB, asbestos exposure (mesothelioma risk) |
3. Pulmonary Vasculature
| Finding | CT Finding | Significance |
|---|---|---|
| Pulmonary Embolism (PE) | Filling defect (hypodense) within pulmonary artery on CTPA | Life-threatening; requires urgent anticoagulation |
| Pulmonary hypertension | Dilated main pulmonary artery (> 29 mm); enlarged RV; RV:LV ratio > 1 | Chronic hypoxia, PE, idiopathic |
4. Mediastinum
| Finding | Significance |
|---|---|
| Mediastinal widening (> 8 cm) | Aortic dissection/aneurysm, lymphoma, hemorrhage, mass |
| Aortic dissection | Intimal flap on CECT creating two lumens (true + false); "D-shaped" true lumen |
| Aortic aneurysm | Aortic diameter > 4 cm (ascending > 4.5 cm, descending > 3.5 cm); risk of rupture |
| Lymphadenopathy | Nodes > 1 cm short axis |
| Pneumomediastinum | Air tracking in mediastinum |
5. Cardiac (CT Coronary/Cardiac)
- Coronary artery calcification - Calcium score (Agatston score); predictor of cardiovascular risk
- Pericardial effusion - Fluid around heart (HU variable by content)
- Pericardial thickening/calcification - Constrictive pericarditis
CT ABDOMEN & PELVIS - Abnormal Findings
1. Liver
| Finding | CT Appearance | Diagnosis |
|---|---|---|
| Simple cyst | Homogeneous hypodense, no enhancement, thin walls | Benign |
| Hepatocellular carcinoma (HCC) | Arterial phase enhancement + "washout" in portal phase; cirrhotic liver | Most common primary liver cancer |
| Metastases | Multiple hypodense lesions (most); variable enhancement | GI, lung, breast, pancreatic cancers |
| Hemangioma | Peripheral nodular enhancement progressing centrally ("fill-in") | Most common benign liver lesion |
| Abscess | Thick-walled, rim-enhancing, hypodense; may have gas | Pyogenic, amoebic |
| Fatty infiltration (steatosis) | Diffuse hypodensity; liver < spleen in density | NASH, alcohol, diabetes, obesity |
| Cirrhosis | Nodular liver contour, small right lobe, hypertrophy of caudate/left lobe, splenomegaly, ascites, varices | Chronic liver disease |
2. Gallbladder & Biliary
| Finding | Significance |
|---|---|
| Gallstones | Hyperdense (calcified) or isodense (cholesterol) stones in GB; wall thickening > 3 mm + pericholecystic fluid = acute cholecystitis |
| Dilated CBD | > 6 mm (> 8 mm post-cholecystectomy) = obstruction (stone, tumor, stricture) |
| Pneumobilia | Air in biliary tree - previous ERCP/surgery, or gallstone ileus (Rigler's triad) |
3. Pancreas
| Finding | Significance |
|---|---|
| Pancreatitis (acute) | Enlarged, heterogeneous pancreas; peripancreatic fat stranding; fluid collections; necrosis = unenhanced areas |
| Pancreatic mass | Hypodense, poorly enhancing mass (ductal adenocarcinoma); "double duct" sign (dilated CBD + PD); vascular encasement = unresectable |
| Pancreatic pseudocyst | Well-defined fluid collection post-pancreatitis |
4. Spleen
- Splenomegaly: > 13 cm; causes include portal hypertension, hematological disease, infection
- Splenic laceration/hematoma: Hypodense (old blood) or hyperdense (fresh blood) areas within spleen; subcapsular collection
- Infarct: Wedge-shaped peripheral hypodensity, no enhancement
5. Kidneys
| Finding | Significance |
|---|---|
| Renal cyst | Simple: thin-walled, homogeneous hypodense, no enhancement (Bosniak I) - benign. Complex: thick walls/septae, enhancement (Bosniak III-IV) - malignancy risk |
| Renal cell carcinoma | Enhancing solid mass in kidney; variable morphology |
| Hydronephrosis | Dilated pelvicalyceal system; obstructed ureter (stone, tumor, stricture) |
| Nephrolithiasis (stones) | Hyperdense calculi in renal collecting system (non-contrast CT is gold standard for urolithiasis) |
| Perinephric fat stranding | Surrounding inflammation - pyelonephritis, stone, trauma |
| Renal infarct | Wedge-shaped cortical hypodensity; absent enhancement |
6. Bowel
| Finding | Significance |
|---|---|
| Small bowel obstruction (SBO) | Dilated small bowel loops (> 3 cm), air-fluid levels, "transition point" from dilated to decompressed bowel |
| Large bowel obstruction | Dilated colon (> 6 cm; cecum > 9 cm = risk of perforation) |
| Pneumoperitoneum (free air) | Air under diaphragm / near porta hepatis |
| Appendicitis | Dilated appendix > 6 mm, periappendiceal fat stranding, appendicolith; absent enhancement of wall = perforation |
| Diverticulitis | Pericolic fat stranding around sigmoid; thickened colonic wall; abscess possible |
| Bowel wall thickening | > 3 mm; causes: Crohn's, ischemia, infection, malignancy |
| Bowel ischemia | Pneumatosis intestinalis (air in bowel wall), portal venous gas = late/severe sign |
7. Aorta (Abdomen)
| Finding | Significance |
|---|---|
| Abdominal aortic aneurysm (AAA) | Diameter > 3 cm; surgical if > 5.5 cm or rapid expansion |
| Retroperitoneal hematoma | Hyperdense collection in retroperitoneum; ruptured AAA or trauma |
8. Pelvis (Common Findings)
| Finding | Significance |
|---|---|
| Ectopic pregnancy | Adnexal mass + free pelvic fluid; no intrauterine gestational sac |
| Ovarian cyst / torsion | Enlarged ovary; absent Doppler flow; edematous stroma |
| Uterine fibroid | Calcified, enhancing uterine mass |
| Pelvic lymphadenopathy | Nodes > 1 cm; malignancy staging |
| Urinary retention | Massively dilated bladder |
CT SPINE - Abnormal Findings (Brief)
| Finding | Significance |
|---|---|
| Vertebral fracture | Compression, burst, flexion-distraction (Chance), fracture-dislocation |
| Spinal canal compromise | Retropulsed fragment encroaching on spinal cord/cauda equina |
| Spondylolisthesis | Anterior slip of one vertebra over another; graded I-IV |
| Disc herniation | Posterior disc protrusion into canal/foramina; hypodense on CT |
| Osteophytes | Bony spurs causing foraminal/canal stenosis |
| Epidural abscess | Enhancing collection compressing dura; fever + back pain + neuro deficit |
Quick Summary by CT Density
| Hyperdense (Bright) | Hypodense (Dark) | Enhancement Patterns |
|---|---|---|
| Acute blood | Edema/infarction | Ring enhancement = abscess, high-grade tumor |
| Calcification | Air/gas | Nodular peripheral = hemangioma |
| Bone | Fat | Arterial "blush" = HCC, vascular tumor |
| Contrast-enhanced vessels | Necrosis/cyst | Homogeneous = lymphoma, meningioma |
| Iodine contrast | CSF/simple fluid | Absent enhancement = necrosis/cyst |
Sources:
- Bradley & Daroff's Neurology in Clinical Practice - CT physics, Hounsfield units
- Tintinalli's Emergency Medicine - Intracranial injury CT findings
- Rosen's Emergency Medicine - Head CT findings, acute emergencies
- Murray & Nadel's Textbook of Respiratory Medicine - CT chest patterns
- Fuster & Hurst's The Heart - Thoracic CT/CTA
- Harrison's Principles of Internal Medicine 22e - Ischemia, hemorrhage imaging
This is a shared conversation. Sign in to Orris to start your own chat.