Ecg of MI with explanation
Reading File
Finding Sources
Finding Sources
Reading File
Reading File
Reading File
Loading Image
Loading Image
Reading File
Loading Image
Loading Image
Reading File
Loading Image
I now have all the key images and content needed. Let me compile the comprehensive answer.
ECG Changes in Myocardial Infarction (MI)
Pathophysiological Basis
When coronary blood flow is interrupted, three distinct membrane abnormalities occur in infarcted cells, each generating characteristic ECG changes:
| Defect in Infarcted Cells | Current Flow | Resultant ECG Change |
|---|---|---|
| Rapid repolarization (accelerated K+ channel opening) | Out of infarct | ST segment elevation |
| Decreased resting membrane potential (K+ loss) | Into infarct during diastole | TQ depression (recorded as ST elevation) |
| Delayed depolarization | Out of infarct | ST segment elevation |
All three abnormalities cause current flow that produces ST elevation in leads overlying the infarct, while leads on the opposite side show reciprocal ST depression. - Ganong's Review of Medical Physiology, 26th Ed
The "Current of Injury" Concept
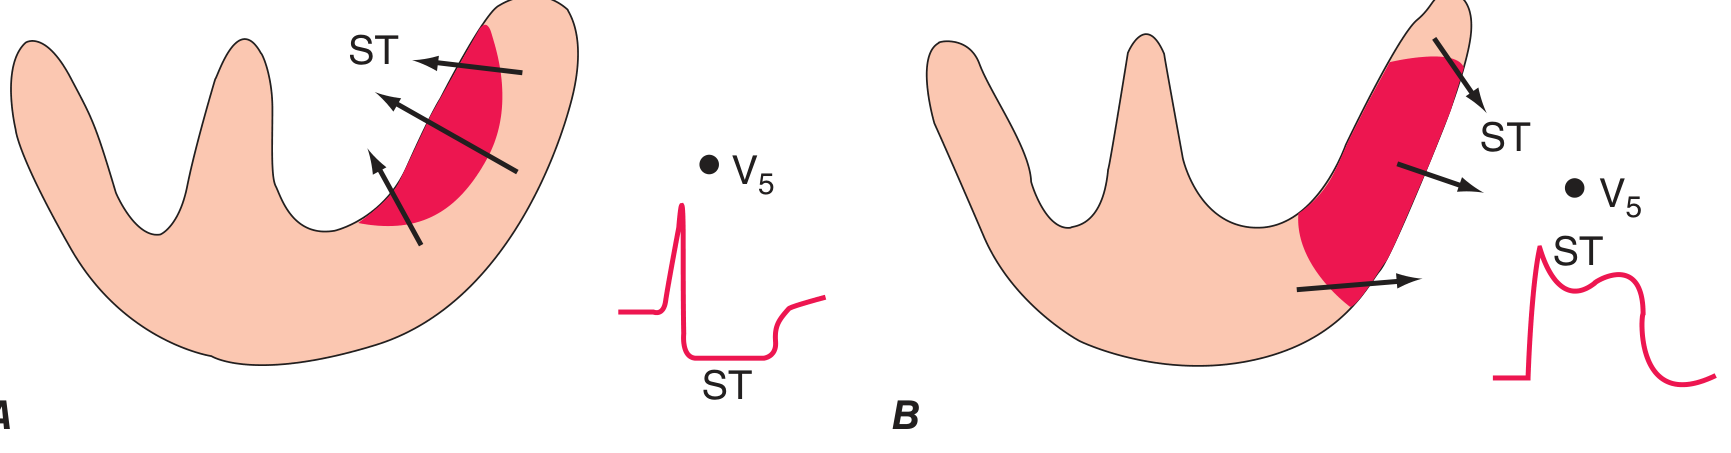
(Harrison's Fig 247-11) - Panel A: Subendocardial ischemia - ST vector points inward → ST depression in overlying leads. Panel B: Transmural/epicardial ischemia - ST vector points outward → ST elevation in overlying leads.
- Transmural ischemia (full-thickness): ST vector shifts toward epicardium → ST elevation in overlying leads, with reciprocal depression in opposite leads.
- Subendocardial ischemia: ST vector shifts toward endocardium/cavity → ST depression in overlying leads (with ST elevation in aVR).
Chronological Evolution of ECG Changes
The ECG in MI evolves through distinct phases:
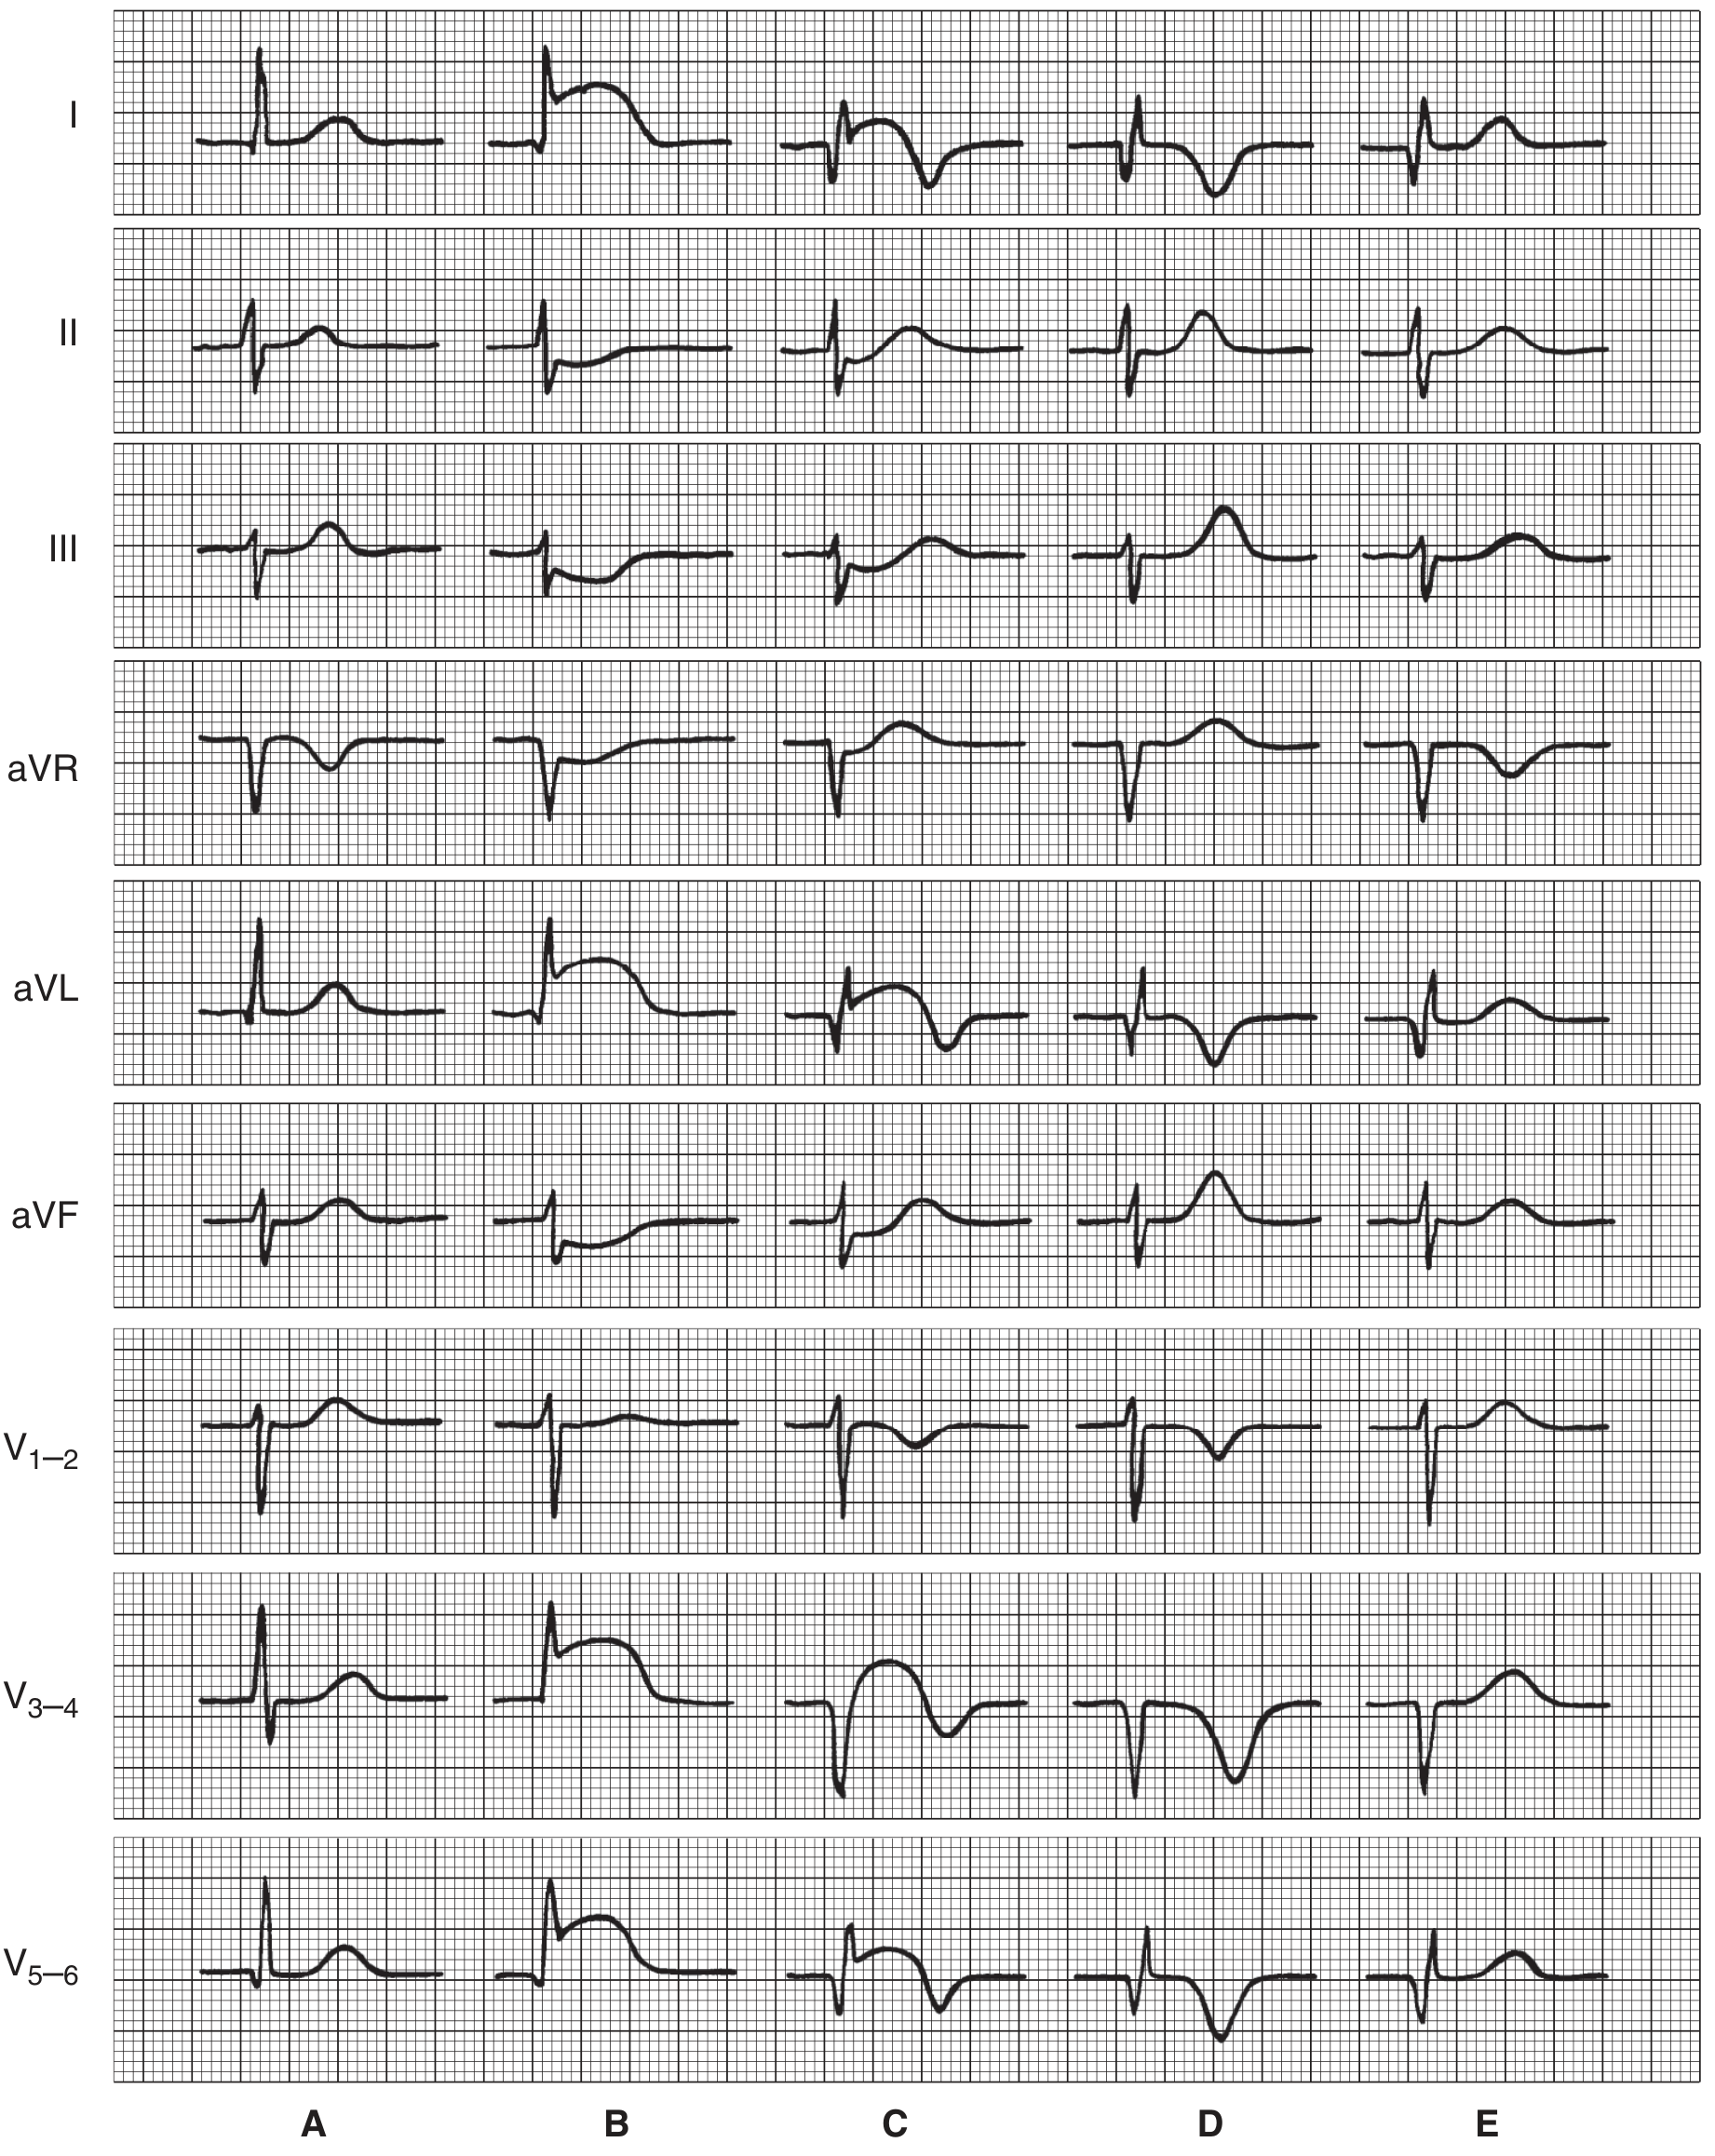
(Ganong Fig 29-17: Diagrammatic illustration of serial ECG patterns in anterior infarction)
| Stage | Timing | ECG Findings |
|---|---|---|
| A - Normal | Baseline | Normal QRS, ST, T waves |
| B - Hyperacute | Minutes to hours | ST elevation in affected leads; tall "hyperacute" T waves; reciprocal ST depression |
| C - Early evolving | Hours to days | Q waves appear; ST elevation begins to decrease; T-wave inversion starts |
| D - Established | Days to weeks | Deep Q waves persist; ST returns toward baseline; T-wave inversions deepen |
| E - Resolved/Chronic | Weeks to months | Q waves may persist (scar); ST normalizes; T waves may normalize or remain inverted |
Four Key ECG Features of MI
1. Hyperacute T Waves (earliest sign, minutes)
- Tall, broad, peaked T waves
- Appear within minutes of occlusion
- Often missed as they are transient
2. ST Segment Elevation (STEMI) or Depression (NSTEMI)
- STEMI criteria: ST elevation ≥1 mm in 2 contiguous limb leads, or ≥2 mm in 2 contiguous precordial leads
- Convex (coved/"tombstone") upward morphology is the classic STEMI shape
- ST depression indicates subendocardial ischemia or posterior MI (as a reciprocal change)
3. T Wave Inversion
- Follows ST elevation as infarct evolves
- Deep symmetric T-wave inversions in V1-V4 (Wellens sign) indicate severe LAD stenosis
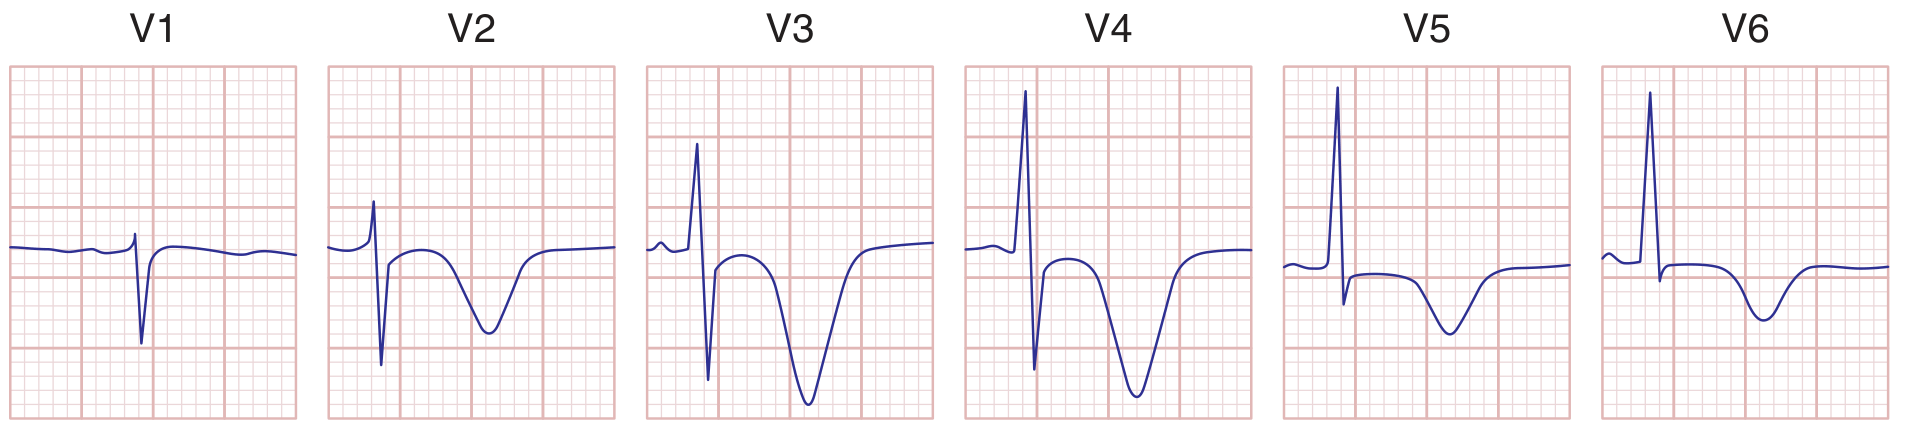
(Harrison's Fig 247-12: Precordial T-wave inversions in anterior wall ischemia - Wellens pattern - indicating high-grade LAD stenosis)
4. Pathological Q Waves (irreversible necrosis)
- Q wave duration >40 ms, depth >25% of R wave height
- Represent electrically silent dead myocardium
- "Failure of R-wave progression" is an equivalent finding in anterior MI
- May develop as early as 1-2 hours or take 24-48 hours to appear
Localization by Lead Distribution
| Territory | Leads Affected | Culprit Artery |
|---|---|---|
| Anterior | V1-V4 | LAD (left anterior descending) |
| Lateral | I, aVL, V5-V6 | LCx (left circumflex) |
| Anterolateral | V1-V6, I, aVL | Proximal LAD or LCx |
| Inferior | II, III, aVF | RCA (right coronary artery) |
| Posterior | Reciprocal ST depression V1-V3; tall R in V1 | RCA or LCx |
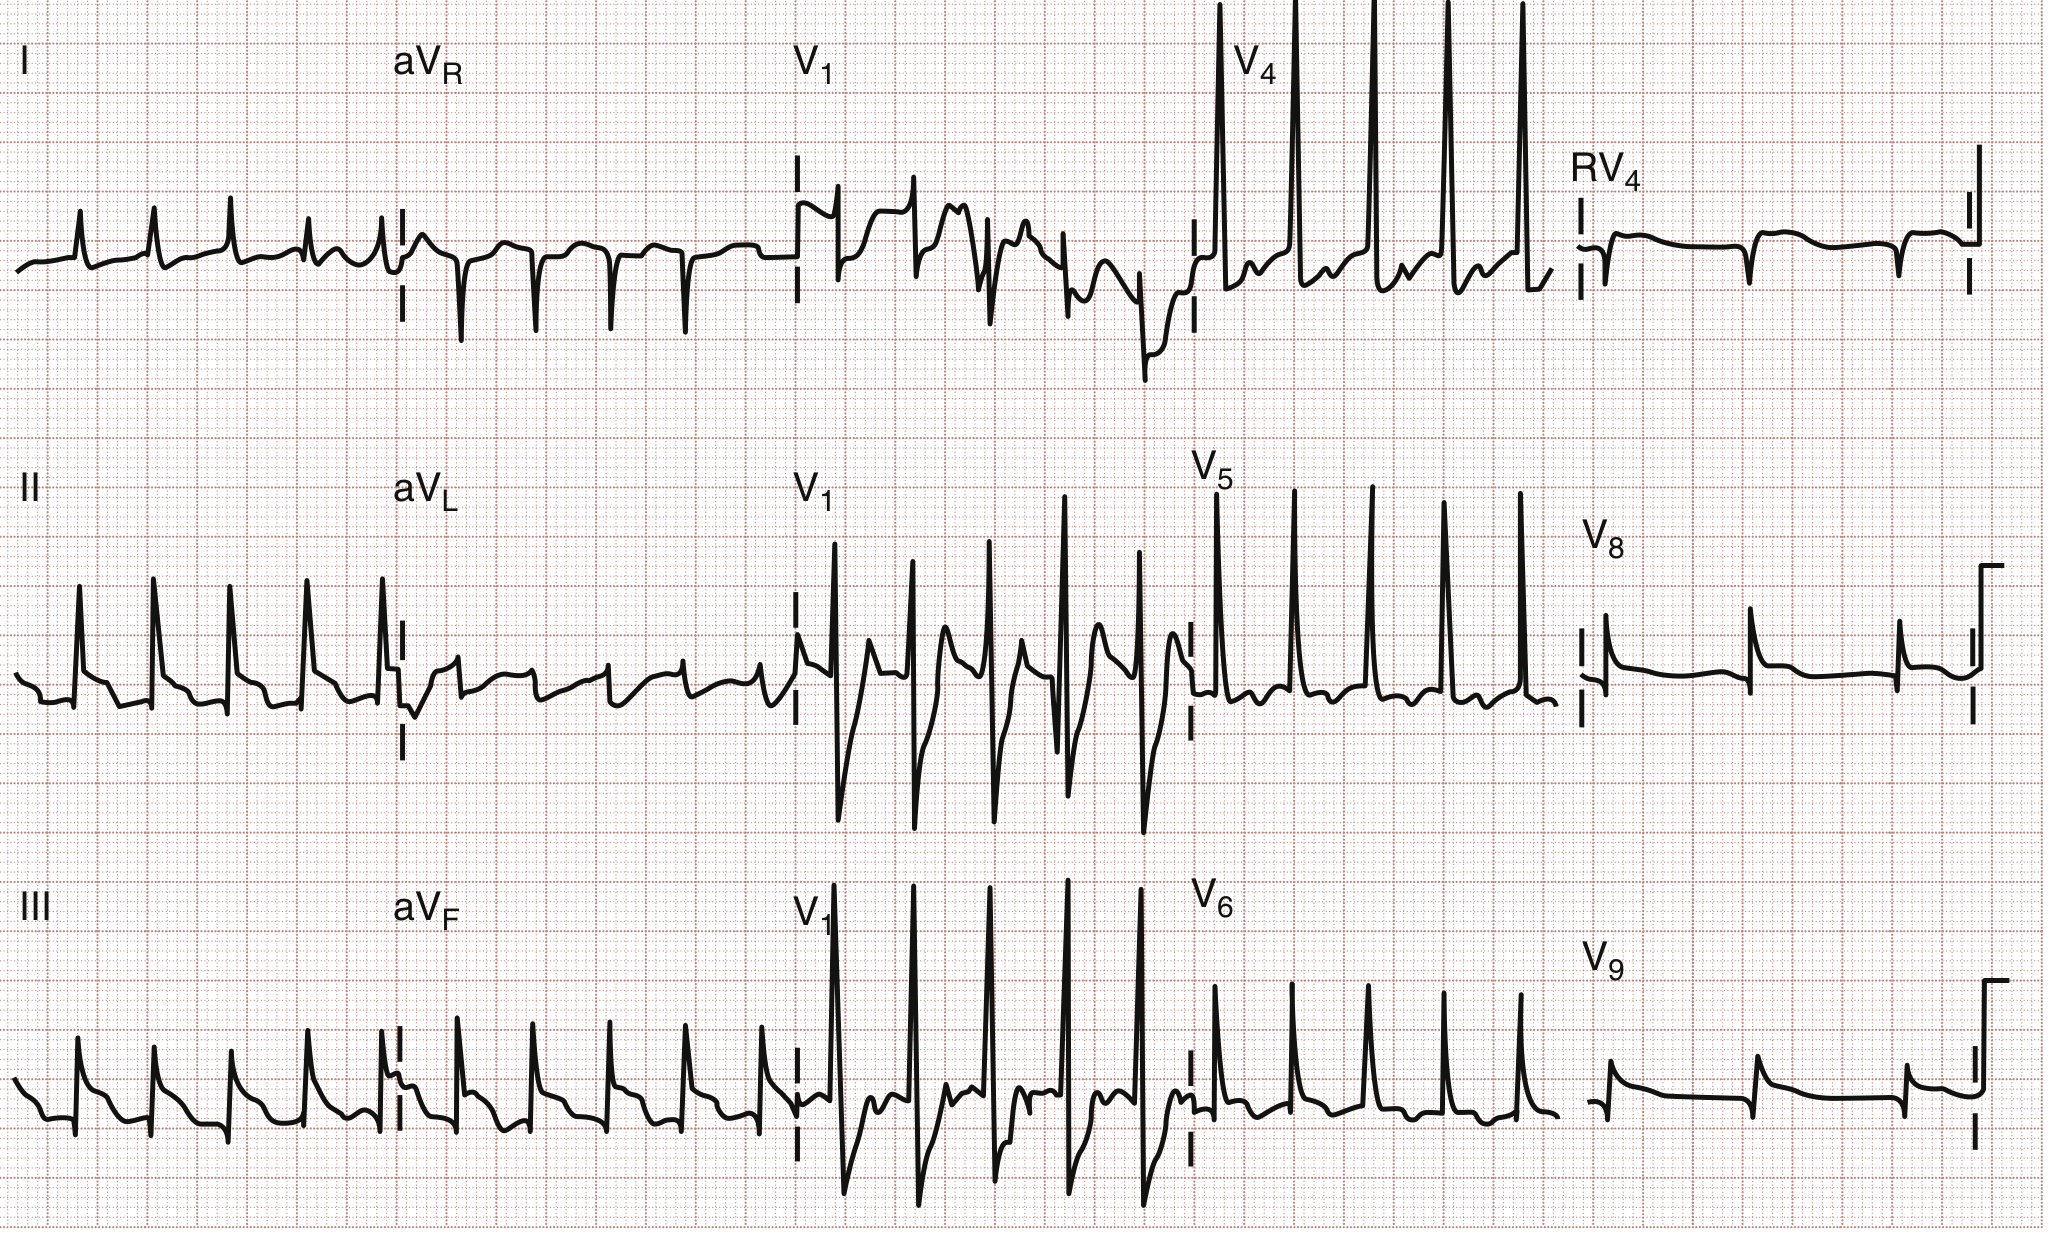
| Right Ventricular | ST elevation in V4R | Proximal RCA |
For inferior STEMI, always do right-sided leads - ST elevation in V4R predicts proximal RCA occlusion with right ventricular involvement.
Real 12-Lead ECG Examples
Serial ECGs showing evolving anterior STEMI (paced rhythm):
STEMI vs NSTEMI on ECG
| Feature | STEMI | NSTEMI/UA |
|---|---|---|
| ST changes | Elevation in culprit territory | ST depression or no ST changes |
| Q waves | Develop over hours-days | Usually absent |
| T waves | Hyperacute then inversion | May show T-wave inversion |
| Biomarkers | Elevated | NSTEMI: elevated; UA: normal |
| Reperfusion urgency | Immediate (door-to-balloon <90 min) | Risk-stratified |
Special Patterns and Pitfalls
- LBBB masking MI: New LBBB with acute chest pain is treated as STEMI equivalent (Sgarbossa criteria help)
- Posterior MI: No direct leads face the posterior wall; look for ST depression + tall R in V1-V2 (mirror image); confirm with posterior leads V7-V9
- Wellens syndrome: Biphasic or deeply inverted T waves in V2-V3 indicate LAD critical stenosis, even between episodes of pain
- De Winter T waves: ST depression with tall symmetric T waves in precordial leads - equivalent to proximal LAD occlusion, requires immediate cath
Sources: Harrison's Principles of Internal Medicine 22E (2025); Ganong's Review of Medical Physiology 26th Ed; Rosen's Emergency Medicine; Tintinalli's Emergency Medicine
Ecg pattern of myocardial infarction with explanation
Finding Sources
Finding Sources
Finding Sources
Reading File
Finding Sources
Finding Sources
Reading File
Reading File
Loading Image
Reading File
Loading Image
Loading Image
Reading File
Loading Image
Loading Image
I now have all the content and images needed for a comprehensive, well-illustrated answer. Let me compile the full response.
ECG Patterns of Myocardial Infarction - Complete Guide
Understanding the Normal ECG First
A normal ECG complex has:
- P wave - atrial depolarization
- PR interval - AV node conduction
- QRS complex - ventricular depolarization
- ST segment - early ventricular repolarization (should be isoelectric)
- T wave - ventricular repolarization
In MI, the ischemia and necrosis progressively alter three components: the ST segment, the T wave, and the QRS complex (Q wave).
The Three Zones of MI and Their ECG Signatures
When coronary blood supply is blocked, three distinct zones form from outside in:
| Zone | Tissue Status | ECG Change |
|---|---|---|
| Zone of Infarction (center) | Dead/necrotic | Pathological Q waves |
| Zone of Injury (middle) | Severely ischemic | ST elevation |
| Zone of Ischemia (outer) | Reversible ischemia | T-wave inversion |
Phase-by-Phase ECG Evolution
The ECG in MI evolves through recognizable stages. Leads overlying the infarct show the changes below:
Phase 1: Hyperacute T Waves (Minutes after occlusion)
What you see:
- Tall, broad, symmetric, peaked T waves
- Often also called "hyperacute T waves"
- ST may already begin to rise
Why it happens:
Immediately after coronary occlusion, infarcted fibers undergo abnormally rapid repolarization due to accelerated K⁺ channel opening. This makes the infarct zone electrically more positive than surrounding normal tissue during the late repolarization phase. Current flows out of the infarct toward overlying electrodes, producing tall positive T waves and early ST elevation.
This phase lasts only minutes and is frequently missed clinically as patients rarely present during this window.
Phase 2: ST Segment Elevation (Hours - the hallmark of STEMI)
What you see:
- ST elevation ≥1 mm in ≥2 contiguous limb leads, or ≥2 mm in ≥2 contiguous precordial leads
- Convex upward (coved/tombstone) morphology - the most specific shape for STEMI
- Reciprocal ST depression in opposite leads
Why it happens:
Three simultaneous ionic events all generate injury currents that elevate the ST segment:
- Rapid repolarization - current flows out of infarct
- Decreased resting membrane potential (K⁺ loss from cells) - TQ segment depression, recorded as ST elevation
- Delayed depolarization - infarct still positive when normal tissue has repolarized
Morphology key:
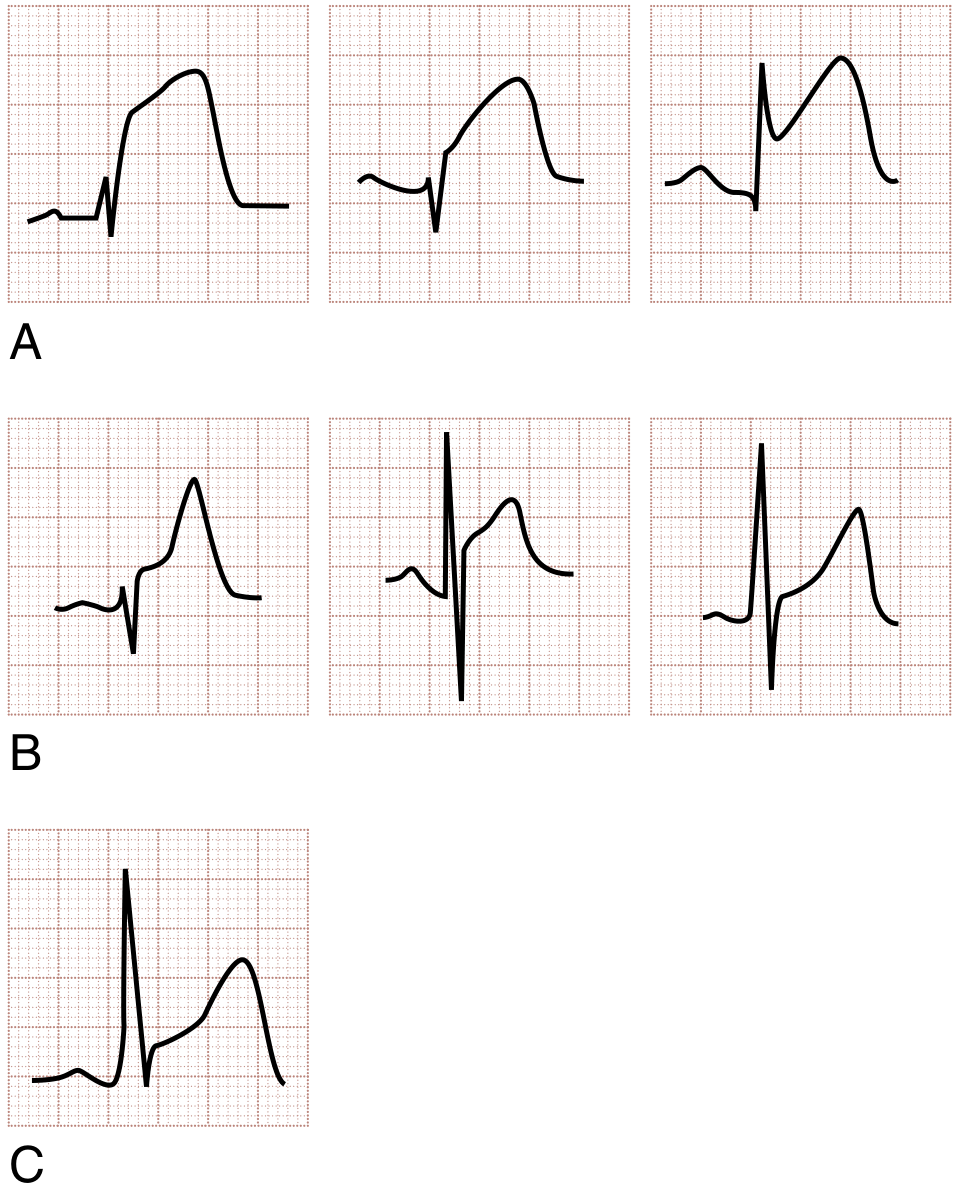 (Rosen's Fig 64.2: Row A = STEMI morphology - flat/convex ST-T. Row B = Non-AMI causes of STE (BER, pericarditis) - concave morphology. Row C = STEMI may also show concavity - serial ECGs are essential)
The ST segment in STEMI is classically flat or convex upward (unlike pericarditis or BER where it is concave/saddleback). However, this is a guideline, not a rule - serial ECGs are needed.
Phase 3: T-Wave Inversion (Hours to days)
What you see:
- Symmetric, deep T-wave inversions in leads overlying the infarct
- ST segment begins to return toward baseline
Why it happens:
The zone of ischemia surrounding the infarct repolarizes abnormally slowly. The T-wave vector shifts away from the ischemic area, producing inversion in overlying leads.
Special pattern - Wellens Syndrome:
Deep symmetric T-wave inversions (or biphasic T waves) in V2-V3, with near-isoelectric ST, indicates critical LAD stenosis (not yet a completed infarct). This is a pre-infarction warning pattern requiring urgent catheterization. Natural history is progression to anterior STEMI.
Phase 4: Q Waves Appear (Hours to days - indicates irreversible necrosis)
What you see:
- Pathological Q waves: duration >40 ms (1 small square wide), depth >25% of R wave height, or any Q in V1-V3
- "Failure of R-wave progression" in anterior leads (R waves fail to grow from V1→V6)
Why it happens:
Necrotic myocardium becomes electrically silent - it cannot depolarize. During systole, the infarct zone is negative relative to healthy myocardium. Overlying electrodes "look through" the dead tissue and see the cavity - recording a negative deflection (Q wave). The healthy myocardium on the opposite side produces a vector pointing away from the electrode.
Note: Posterior and lateral infarcts can produce Q waves in their respective leads. Posterior MI may show reciprocal tall R waves in V1-V2 instead of Q waves (because no standard leads directly face the posterior wall).
Phase 5: Chronic/Resolved Pattern (Weeks to months)
What you see:
- Q waves may persist permanently (marker of old infarct) or gradually shrink
- ST segment normalizes (persistent ST elevation >6 weeks suggests LV aneurysm)
- T waves normalize or remain inverted
Leads and Localization: Which Territory is Infarcting?
| Territory | ECG Leads with ST Elevation | Culprit Artery |
|---|---|---|
| Anterior | V1-V4 | LAD (left anterior descending) |
| Anterolateral | V1-V6, I, aVL | Proximal LAD |
| High Lateral | I, aVL (± V5-V6) | LCx or first diagonal (D1) |
| Inferior | II, III, aVF | RCA (right coronary artery) 80% / LCx 20% |
| Posterior | No elevation - ST depression + tall R in V1-V3; confirm with V7-V9 | RCA or LCx |
| Right Ventricular | V4R (right-sided lead) | Proximal RCA |
| Septal | V1-V2 | Septal perforators of LAD |
Reciprocal Changes - Why They Matter
Reciprocal ST depression in leads opposite to the infarct zone indicates:
- Larger infarct size
- More extensive coronary artery disease
- Greater degree of pump failure
- Higher mortality - the more leads showing changes, the worse the outcome
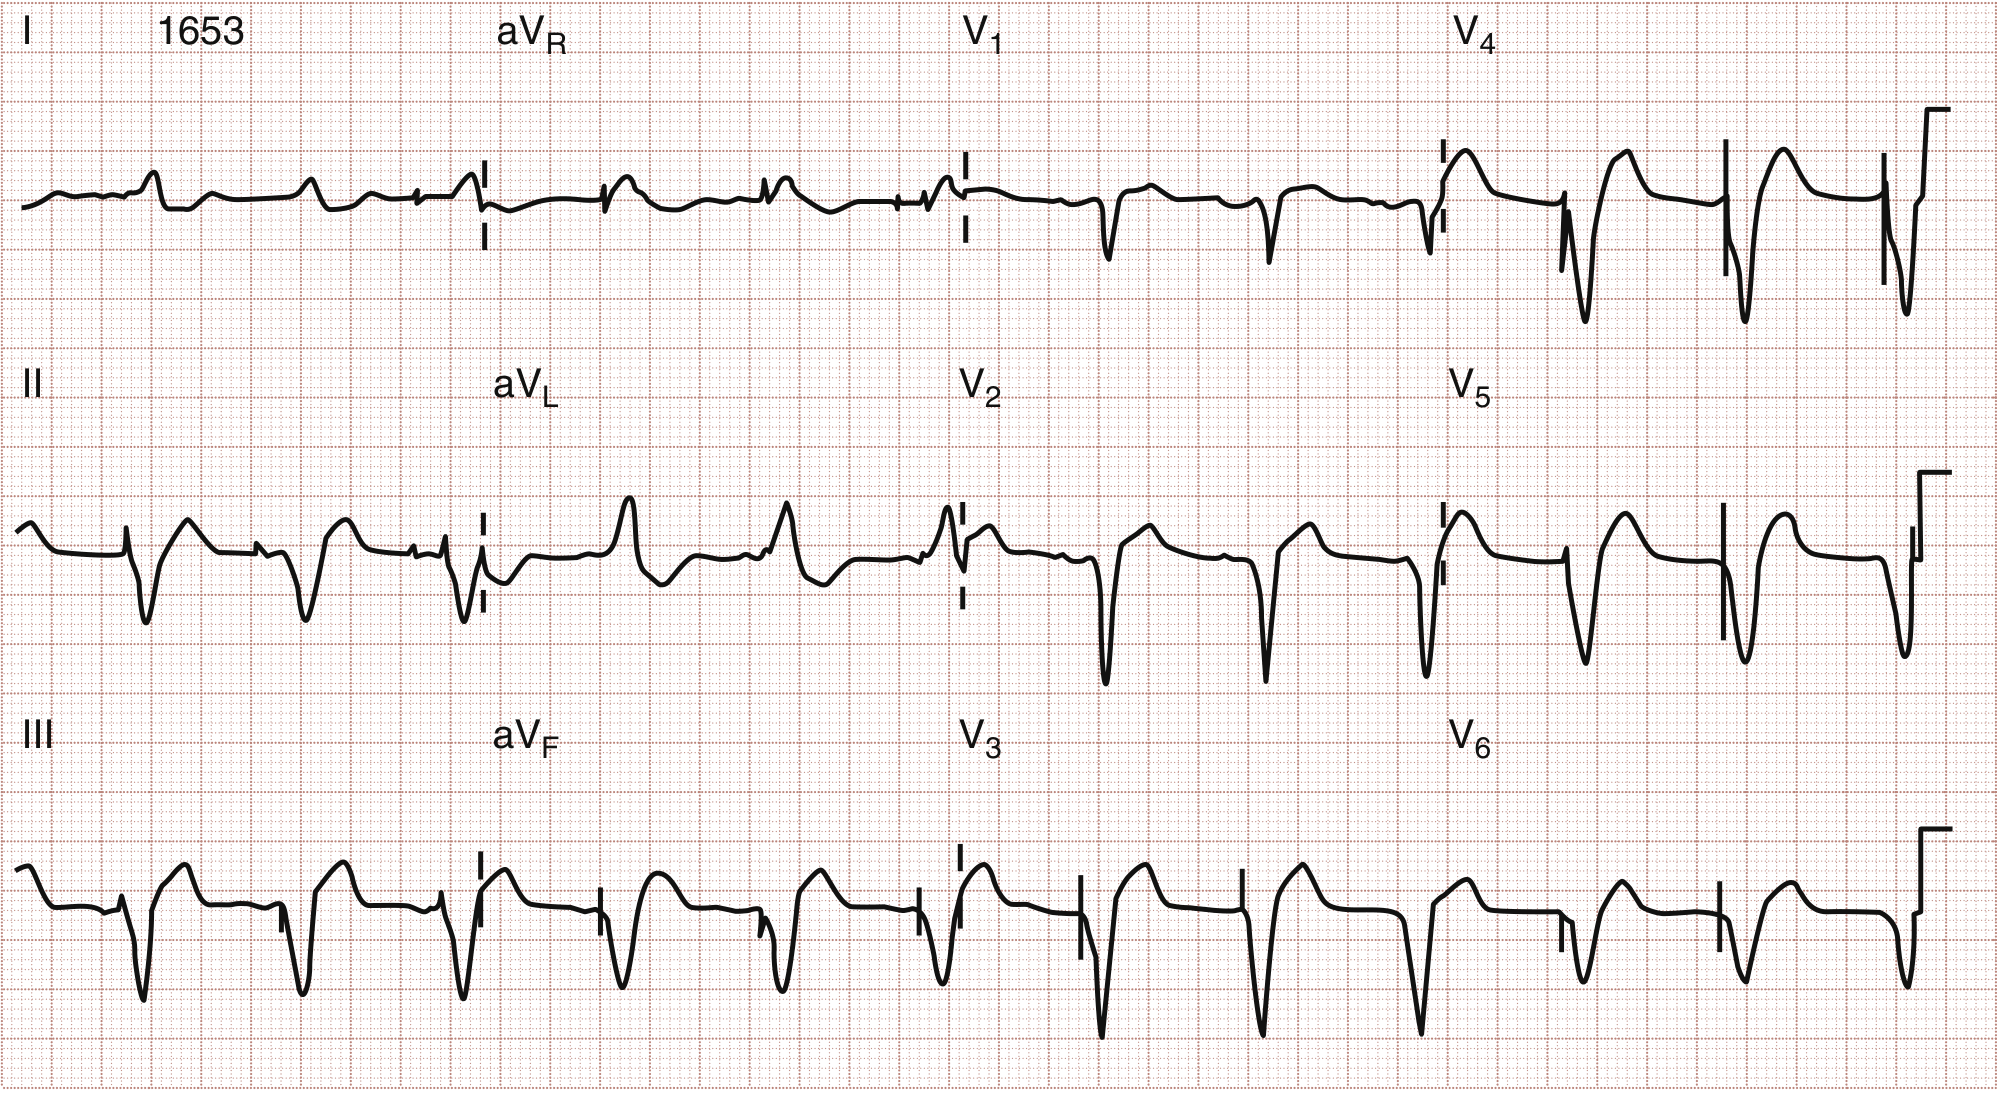
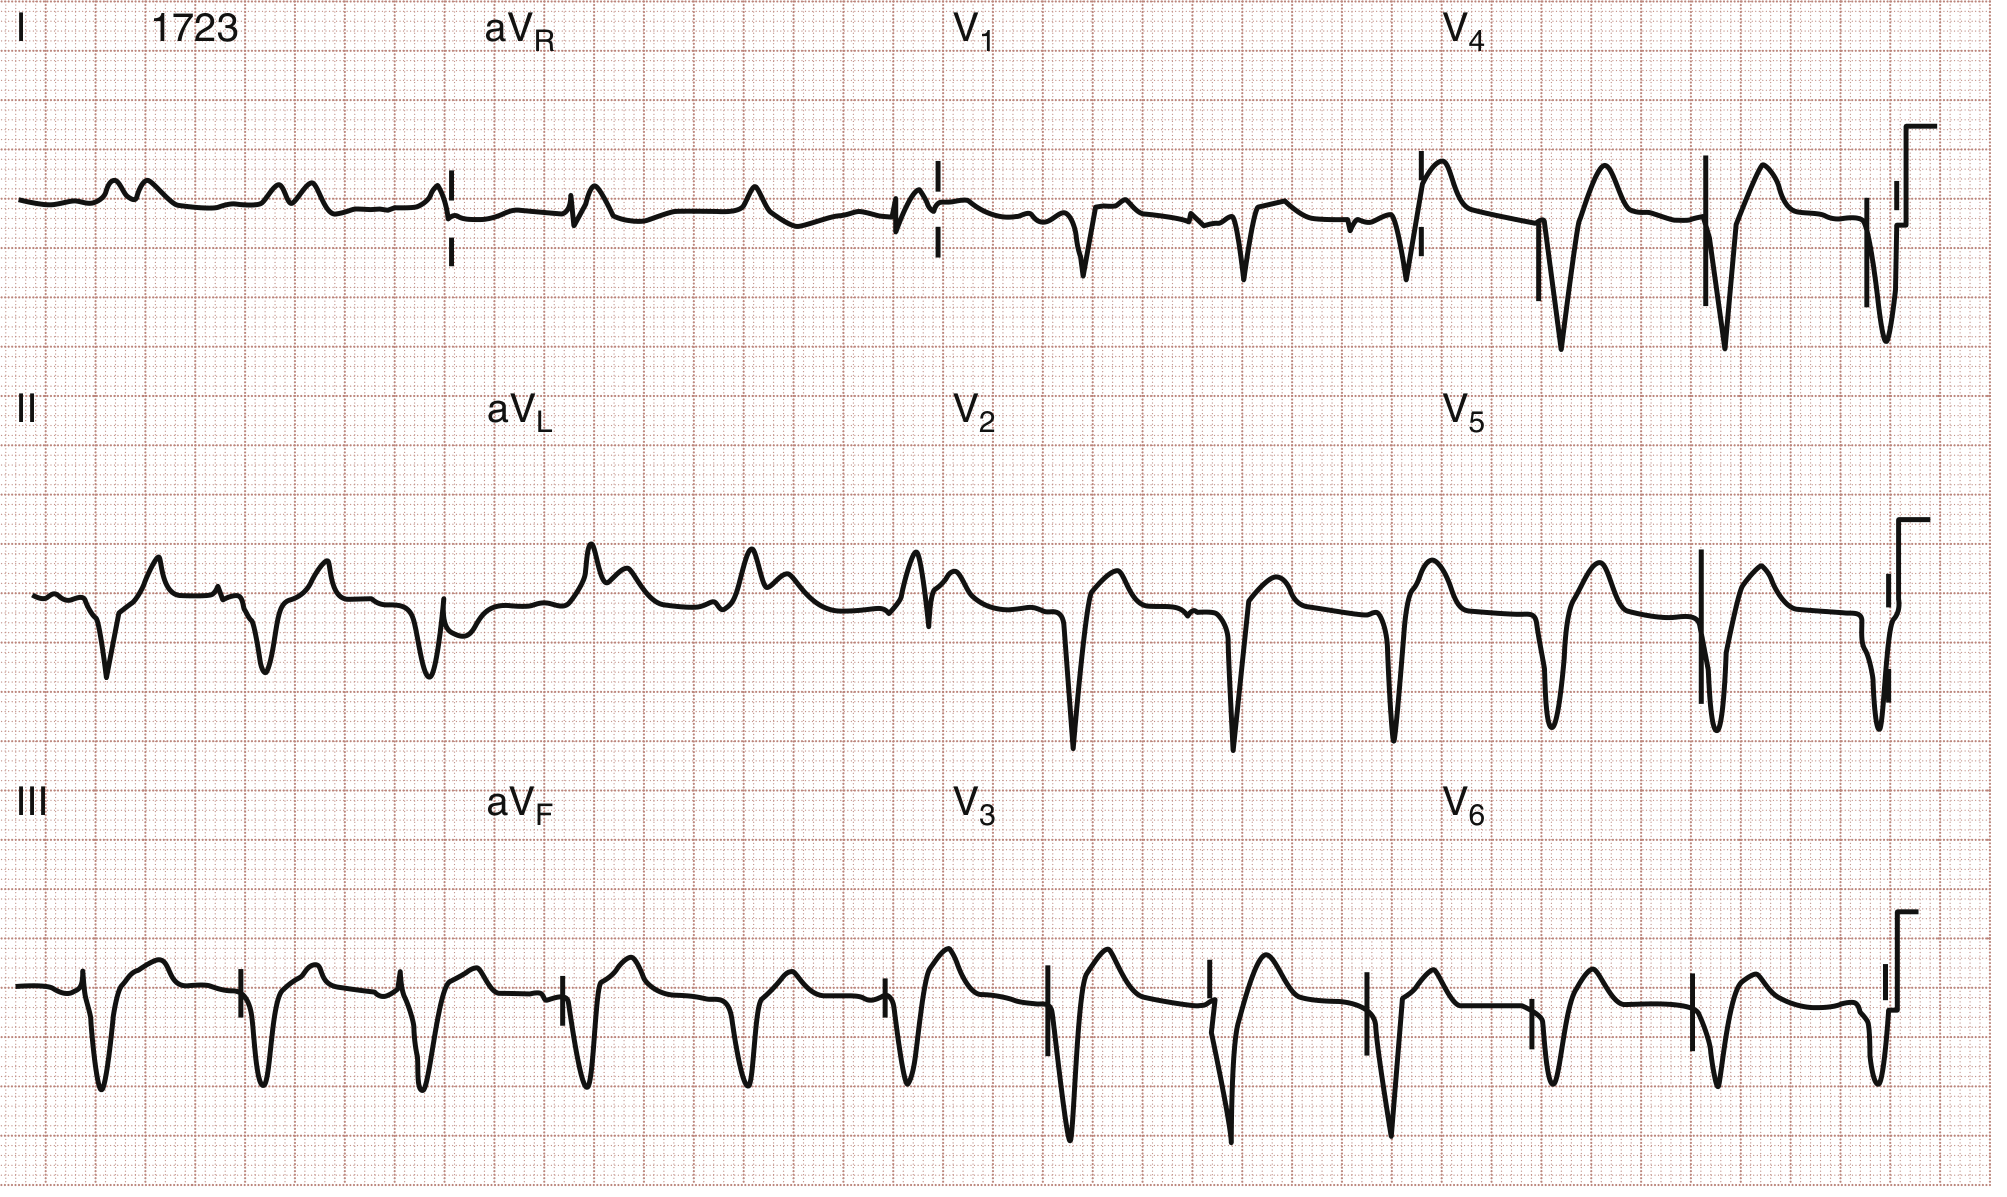
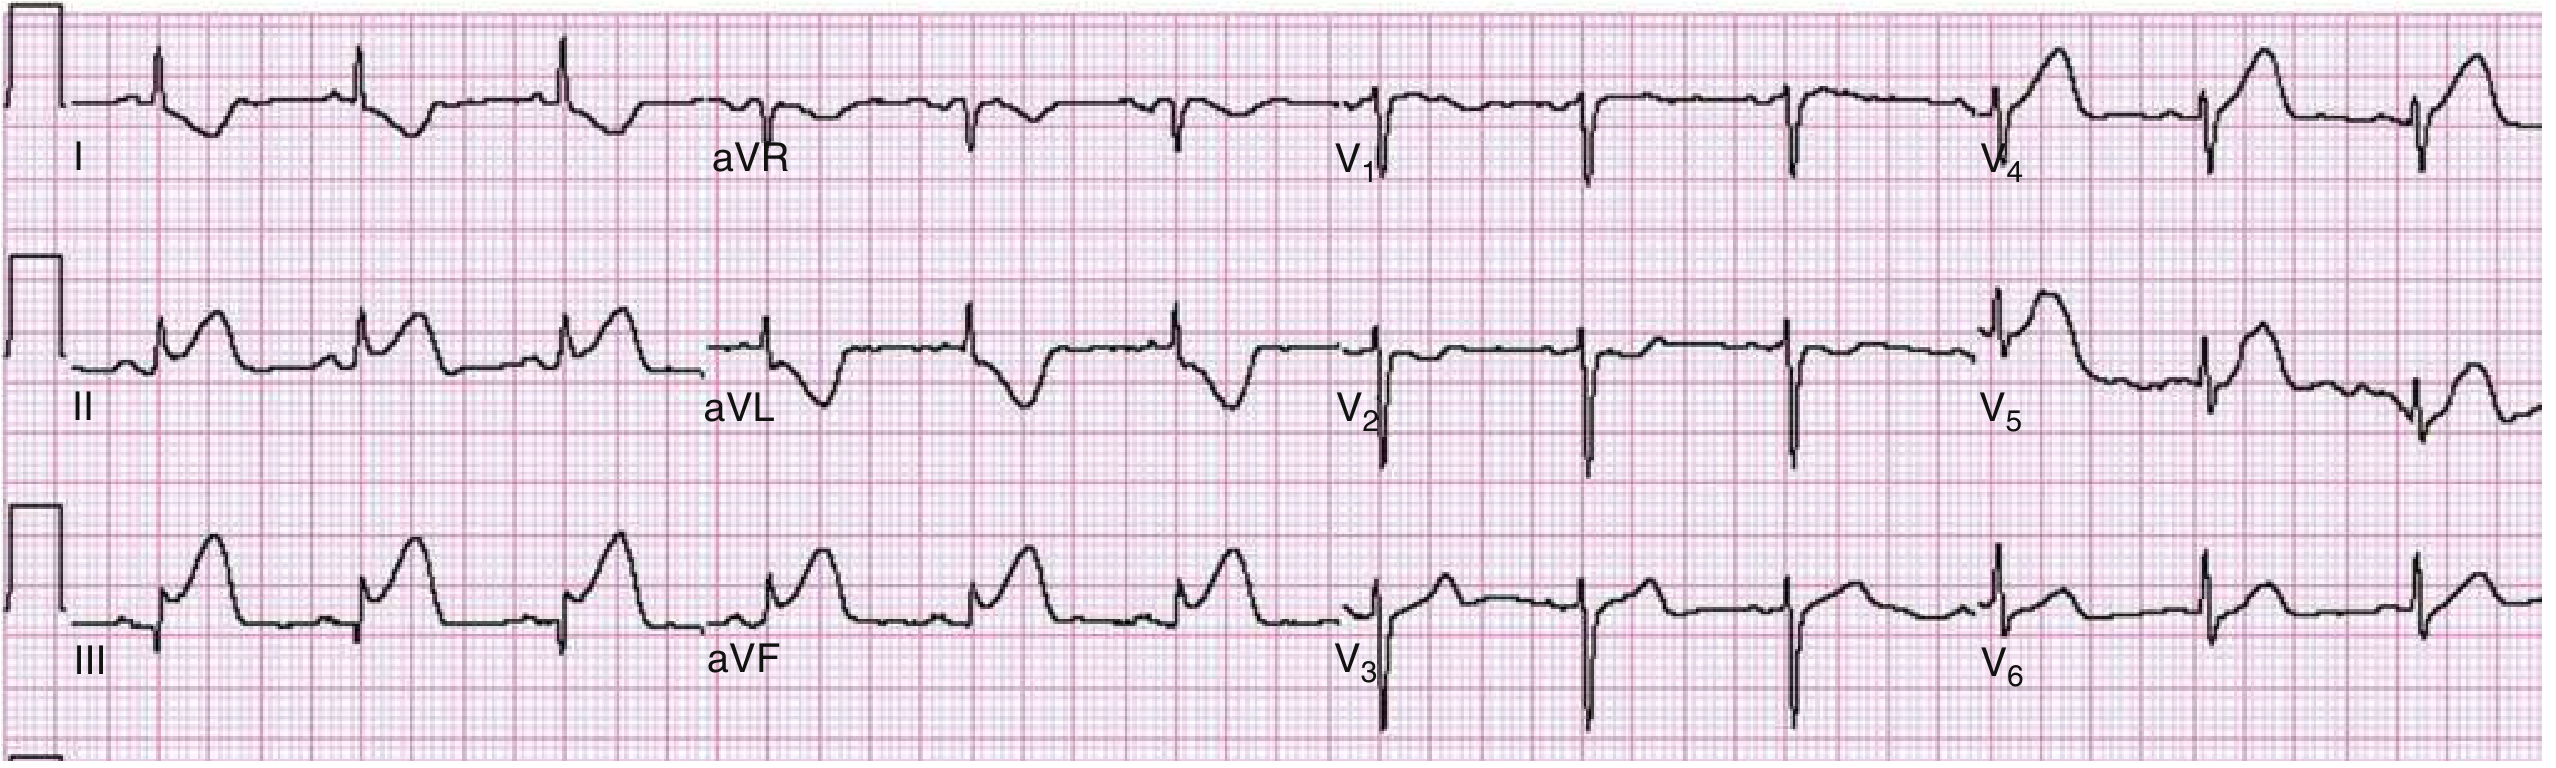
Anterolateral STEMI - Real ECG Example
High Lateral MI (I, aVL elevation with reciprocal depression in III, aVF):
 (Rosen's Fig 64.11: High lateral MI from LAD/D1 bifurcation stenosis - ST elevation in I and aVL)
Distinguishing STEMI from NSTEMI on ECG
| Feature | STEMI | NSTEMI / UA |
|---|---|---|
| ST changes | Elevation in culprit territory (transmural injury) | ST depression or no ST changes |
| T waves | Hyperacute then inversion | May show isolated T-wave inversion |
| Q waves | Develop over hours-days | Usually absent |
| Management | Immediate reperfusion (door-to-balloon <90 min) | Risk-stratified - urgent vs early invasive |
| Key concept | Full-thickness (transmural) ischemia | Subendocardial or partial-thickness ischemia |
Special ECG Patterns and Pitfalls
| Pattern | ECG Appearance | Significance |
|---|---|---|
| Wellens Syndrome | Deep symmetric T inversions (Type A) or biphasic T (Type B) in V2-V3, isoelectric ST | Critical LAD stenosis - will become anterior STEMI |
| De Winter Pattern | ST depression with tall symmetric T waves in precordial leads | Proximal LAD occlusion equivalent - needs immediate cath |
| Posterior MI | ST depression + prominent R wave in V1-V3 (reciprocal pattern) | Confirm with posterior leads V7-V9 showing STE |
| Right Ventricular MI | STE in V4R with inferior STEMI | Proximal RCA - avoid nitrates/diuretics (preload dependent) |
| LBBB | Masks ST changes; use Sgarbossa criteria (concordant STE, exaggerated discordant STE) | New LBBB + symptoms = STEMI equivalent |
Diagnostic Criteria Summary (STEMI)
Standard 12-lead criteria:
- ST elevation ≥1 mm (0.1 mV) in ≥2 contiguous limb leads (I, II, III, aVL, aVF)
- ST elevation ≥2 mm in ≥2 contiguous precordial leads (V1-V6)
- New or presumably new LBBB
- Posterior MI pattern (ST depression V1-V3 + tall R, confirmed by V7-V9 STE)
Sensitivity/Specificity of ECG in AMI:
- Single ECG: sensitivity ~60%, specificity ~90%
- Serial ECGs (20-minute intervals) significantly increase sensitivity for STEMI detection (~16% additional diagnoses)
The "Current of Injury" - Visual Summary
Sources: Harrison's Principles of Internal Medicine 22E (2025); Rosen's Emergency Medicine, 10th Ed; Ganong's Review of Medical Physiology 26th Ed; Tintinalli's Emergency Medicine
Comparison of normal ecg with MI ecg
Finding Sources
Finding Sources
Reading File
Reading File
Loading Image
Finding Sources
Loading Image
Loading Image
Reading File
Loading Image
Loading Image
I have all the images and content needed. Now I'll deliver the comprehensive comparison.
Normal ECG vs MI ECG - A Complete Comparison
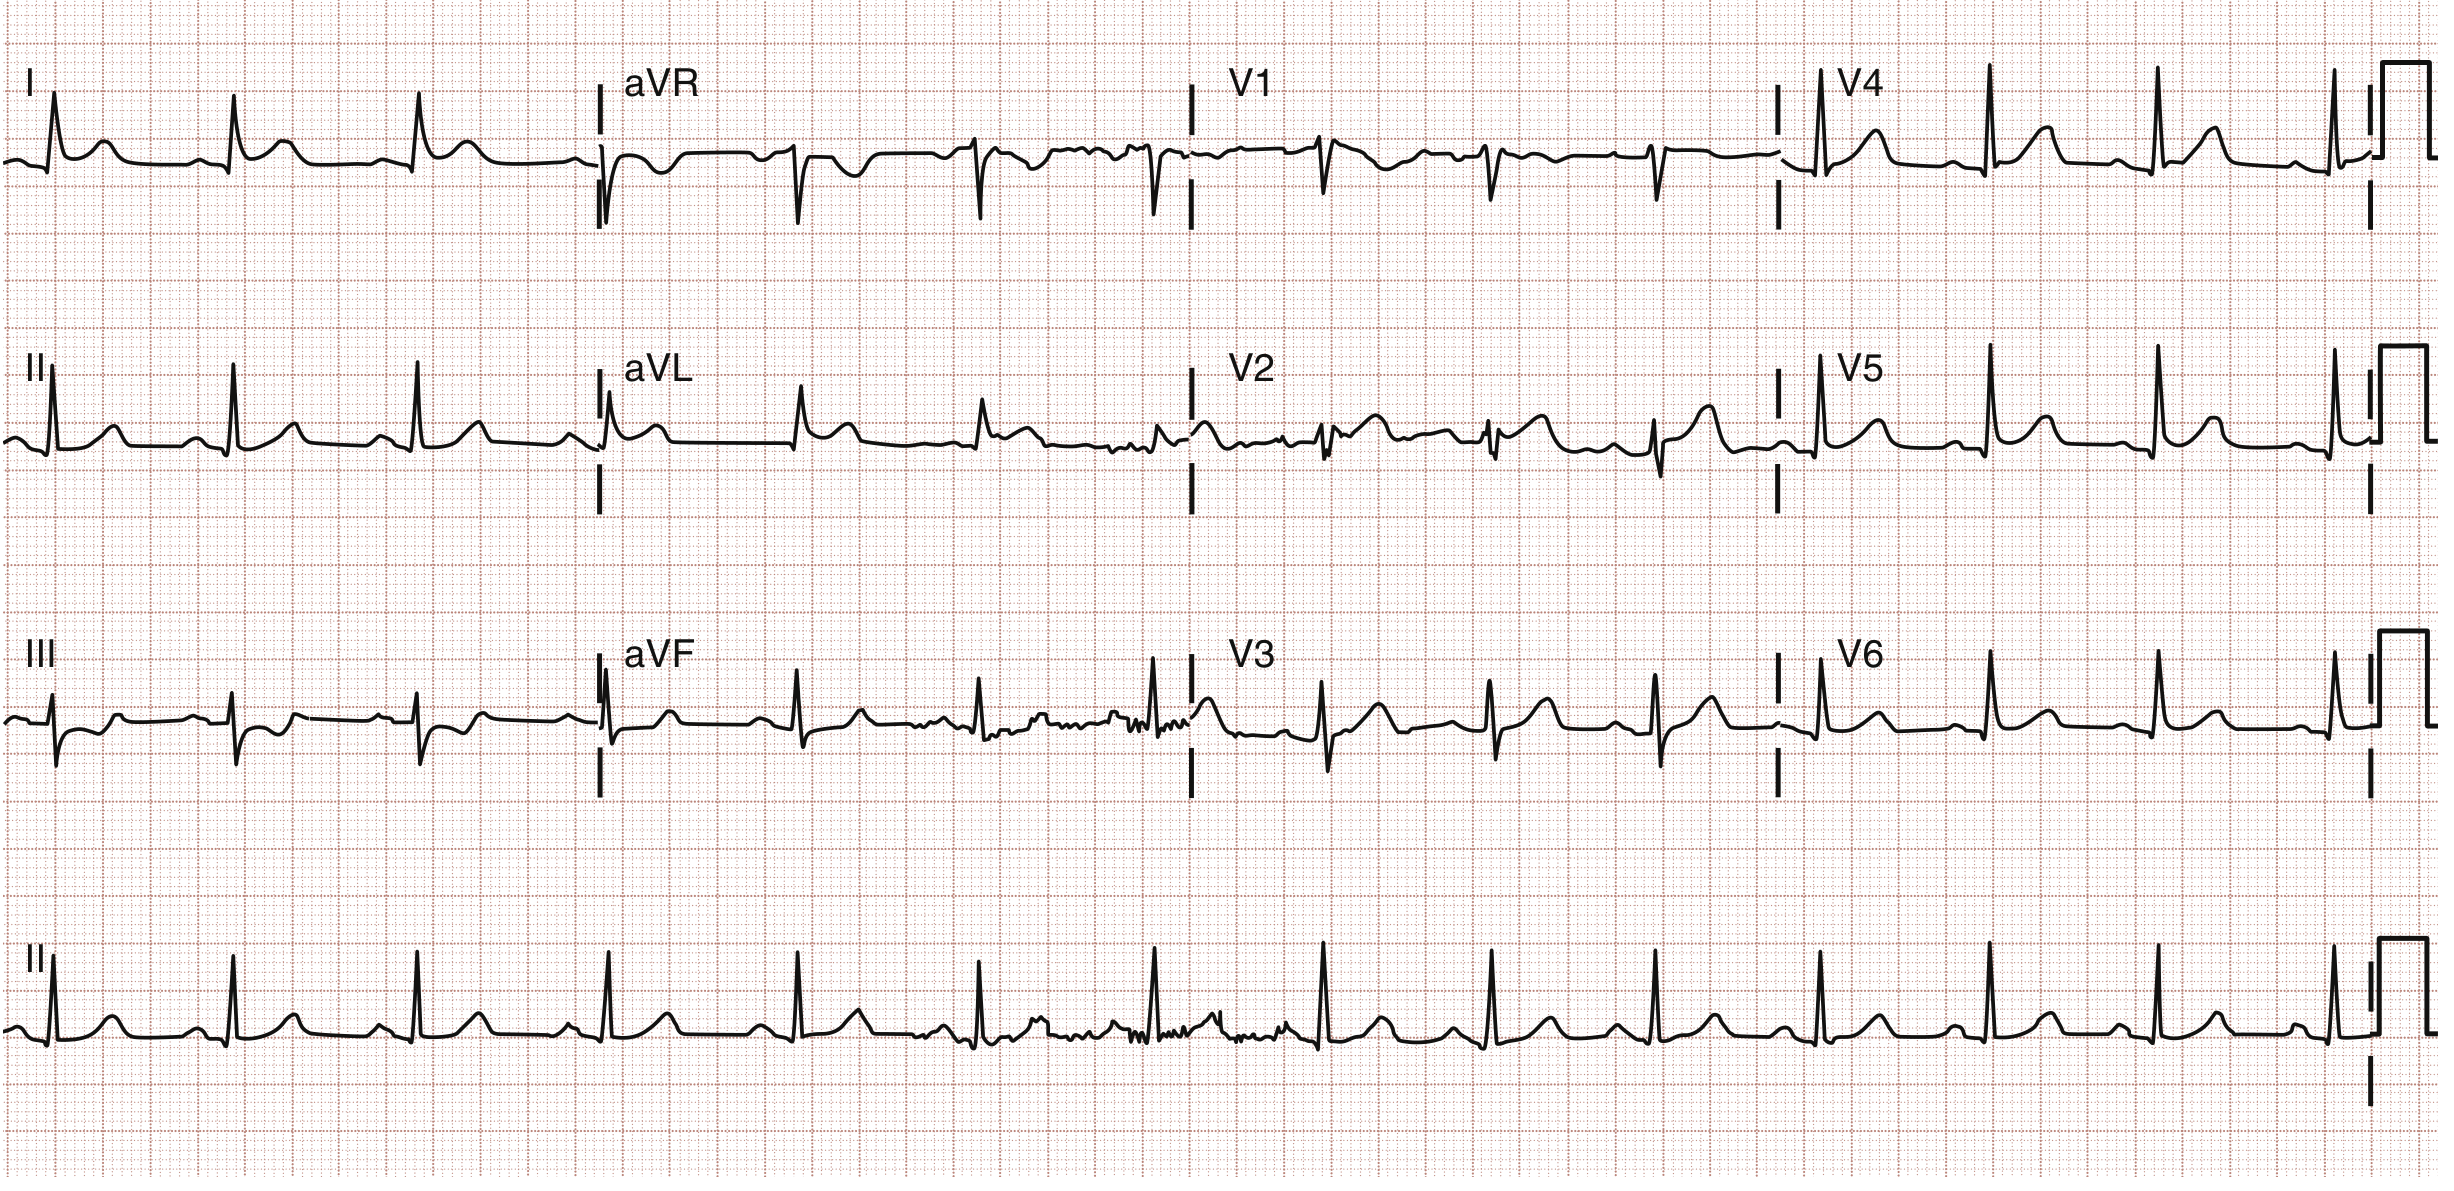
Part 1: The Normal ECG - Building Blocks
Normal ECG Diagram

What Each Component Means
| ECG Component | What It Represents | Normal Values |
|---|---|---|
| P wave | Atrial depolarization (SA node fires → atria contract) | Duration <120 ms; amplitude 0.1-0.3 mV; upright in I, II, aVF |
| PR interval | Atrial depolarization + AV node conduction delay | 120-200 ms (3-5 small squares) |
| QRS complex | Ventricular depolarization (ventricles contract) | Duration 60-100 ms (<2.5 small squares); R wave 1.0-1.5 mV |
| ST segment | Early ventricular repolarization (between end of depolarization and start of T) | Isoelectric (flat, at baseline) - no elevation or depression |
| T wave | Ventricular repolarization | Upright in I, II, V3-V6; 0.2-0.3 mV; asymmetric (slow rise, rapid fall) |
| QT interval | Total ventricular electrical activity (depolarization + repolarization) | ~350 ms; rate-corrected QTc <440 ms (male), <460 ms (female) |
Key Features of a Truly Normal ECG
- P wave present before every QRS, with constant PR interval
- QRS narrow (<100 ms), no pathological Q waves
- ST segment sits exactly on the isoelectric baseline
- T waves upright and asymmetric (gentle upslope, steep downslope) in most leads
- R-wave progression in precordial leads: R wave grows progressively from V1 → V5/V6
- No reciprocal changes between lead groups
Part 2: How MI Disrupts the Normal ECG
When a coronary artery is blocked, three ionic disturbances occur simultaneously in the affected myocardium:
- Rapid repolarization (accelerated K⁺ channel opening) - current flows out of infarct
- Loss of resting membrane potential (K⁺ leaks out of dying cells) - TQ depression, displayed as ST elevation
- Delayed depolarization (necrotic cells can't fire) - electrical silence creates Q waves
The "current of injury" concept explains the ST changes visually:
Part 3: Side-by-Side Comparison - Normal vs MI ECG
The Three Zones and Their ECG Signatures
Normal heart: Uniform depolarization/repolarization → balanced ECG
MI heart:
┌─────────────────────────────────────────────────────┐
│ Outer zone (ISCHEMIA) → T-wave inversion │
│ Middle zone (INJURY) → ST elevation │
│ Inner zone (NECROSIS)→ Pathological Q wave │
└─────────────────────────────────────────────────────┘
Feature-by-Feature Comparison Table
| ECG Feature | NORMAL | STEMI (Acute MI) | Why it Changes |
|---|---|---|---|
| P wave | Normal, upright | Usually normal (unchanged) | Atria are not directly infarcted in most cases |
| PR interval | 120-200 ms | Usually normal | AV node typically unaffected |
| Q wave | Absent OR small septal Q (<40 ms, <25% R height) | Pathological Q wave - wide (>40 ms) and deep (>25% R height); may appear in hours | Necrotic tissue is electrically silent; overlying electrode sees the cavity (negative) |
| R wave | Grows from V1→V5 (normal progression) | Reduced amplitude or lost ("poor R-wave progression"); may disappear completely | Dead myocardium stops contributing positive vectors |
| ST segment | Flat/isoelectric at baseline | Elevated ≥1 mm in 2+ contiguous leads; convex/coved upward shape | Injury current - ionic imbalance in injured cells shifts ST vector toward epicardium |
| ST morphology | Flat, smoothly connecting QRS to T | Convex upward (tombstone) in STEMI; concave/flat in NSTEMI | Transmural vs subendocardial injury |
| T wave | Upright, asymmetric, moderate amplitude | Initially hyperacute (tall, peaked, symmetric) → then inverted (deep, symmetric) | Early: rapid repolarization raises T. Later: ischemic zone repolarizes abnormally slowly |
| Reciprocal changes | Absent - all leads in balance | ST depression in leads opposite to infarct territory | Mirror-image of injury current in remote leads |
| QT interval | Normal (~350 ms) | May be prolonged in acute phase | Repolarization abnormalities extend the total ventricular electrical cycle |
Part 4: The Five Stages of MI ECG Evolution
Compare column A (normal) with each subsequent stage:
| Stage | Time | What You See vs Normal |
|---|---|---|
| A - Normal | Baseline | Normal P, QRS, ST, T - the reference |
| B - Hyperacute | Minutes | Tall peaked T waves in I, aVL, V3-V5; ST beginning to rise; reciprocal ST depression in II, III, aVF |
| C - Early evolving | Hours | Q waves appear; ST elevation prominent; T waves start inverting; loss of R amplitude |
| D - Established | Days | Deep Q waves; ST returning to baseline; deep symmetric T inversions |
| E - Chronic | Weeks-months | Q waves persist (permanent scar marker); ST normalized; T waves may normalize or stay inverted |
Part 5: Visual Comparison of ST Segment Morphology
This is one of the most important differences between a normal ECG and MI:
| ST Shape | What It Suggests |
|---|---|
| Flat/isoelectric | Normal |
| Convex upward (coved) - Row A | STEMI - most specific shape |
| Concave upward (saddleback) - Row B | Pericarditis, benign early repolarization - usually NOT MI |
| Obliquely flat with elevation | Can be STEMI - use clinical context + serial ECGs |
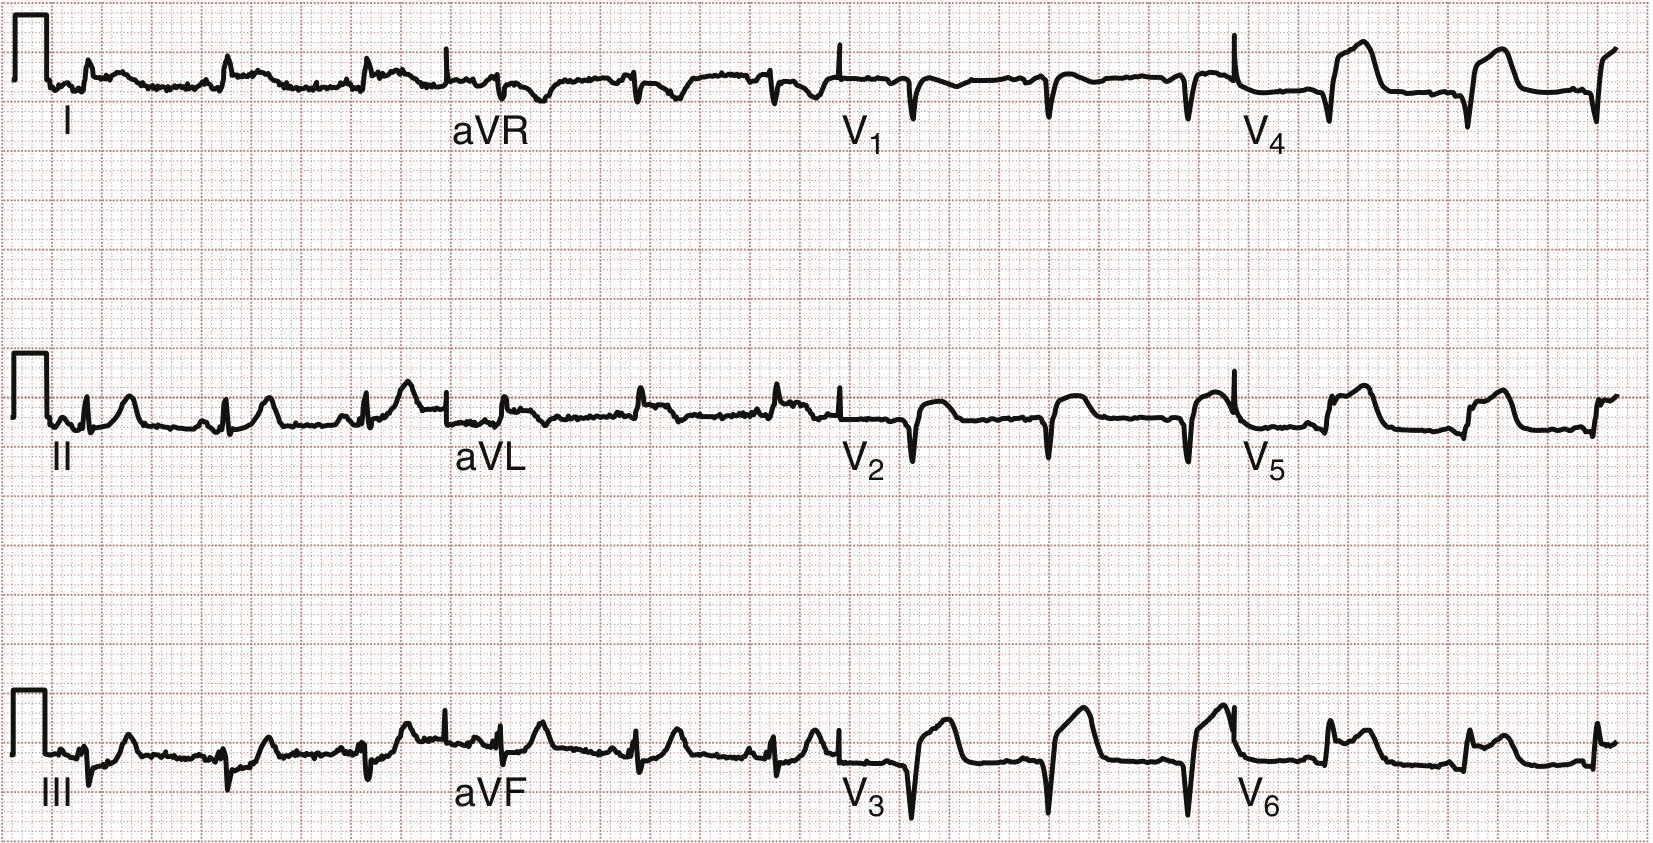
Part 6: Real MI ECG - Anterolateral STEMI
Here is what an actual STEMI looks like compared to normal:
What to spot vs normal:
- V1-V4: marked ST elevation where it should be flat; large tombstone morphology in V3-V4
- Lead I, aVL: ST elevation (lateral involvement)
- V5, V6: ST elevation continuing laterally
- aVR: reciprocal ST depression
- This is an emergency requiring immediate catheterization
Part 7: Concise Summary Card
┌──────────────────────────────────────────────────────────────────────┐
│ NORMAL ECG │ MI ECG (STEMI) │
├──────────────────────────────────────────────────────────────────────┤
│ P wave: Normal, upright │ P wave: Unchanged (usually) │
│ PR: 120-200 ms │ PR: Unchanged (usually) │
│ Q wave: Absent/small │ Q wave: PATHOLOGICAL - wide+deep │
│ R wave: Normal progression │ R wave: Reduced/absent (lost) │
│ ST segment: FLAT, isoelectric │ ST segment: ELEVATED, convex upward │
│ T wave: Upright, asymmetric│ T wave: Hyperacute → INVERTED │
│ Reciprocal: None │ Reciprocal: ST DEPRESSION opposite │
└──────────────────────────────────────────────────────────────────────┘
Quick Memory Aid
Think of MI ECG changes as "Q-SITE":
- Q - Pathological Q waves (necrosis/dead tissue)
- S - ST elevation (injury current)
- I - T-wave Inversion (ischemia)
- T - Tall hyperacute T waves (earliest sign)
- E - Evolutionary changes over time
Sources: Costanzo Physiology 7th Ed; Guyton & Hall Medical Physiology; Harrison's Principles of Internal Medicine 22E (2025); Ganong's Review of Medical Physiology 26th Ed; Rosen's Emergency Medicine 10th Ed
This is a shared conversation. Sign in to Orris to start your own chat.