
Antigen presentation pathway in an infographic image with correct information
antigen presentation pathway MHC class I class II diagram
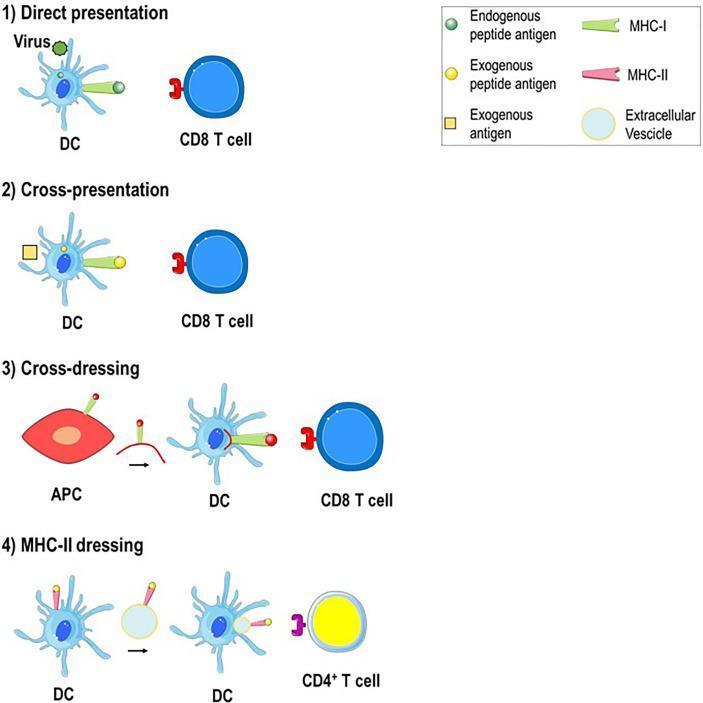
A medical immunology diagram illustrating four mechanisms of antigen presentation to T cells by Dendritic Cells (DCs). The diagram is divided into labeled sections: 1) Direct Presentation: Shows a virus-infected DC processing endogenous antigens to present via MHC Class I to a CD8+ T cell. 2) Cross-Presentation: Depicts a DC engulfing an exogenous antigen and presenting the derived peptide via MHC Class I to a CD8+ T cell. 3) Cross-Dressing: Illustrates the intercellular transfer of pre-formed peptide-MHC Class I complexes from an Antigen Presenting Cell (APC) to a DC (via trogocytosis or vesicles), which then interacts with a CD8+ T cell. 4) MHC-II Dressing: Shows the transfer of peptide-MHC Class II complexes from one DC to another DC for presentation to a CD4+ T cell. A legend identifies key components including endogenous and exogenous peptide antigens, MHC-I (green), MHC-II (pink), and extracellular vesicles. This visual aid clarifies the complex pathways involved in adaptive immune activation and potential autoimmune responses in clinical contexts like autoimmune hepatitis.
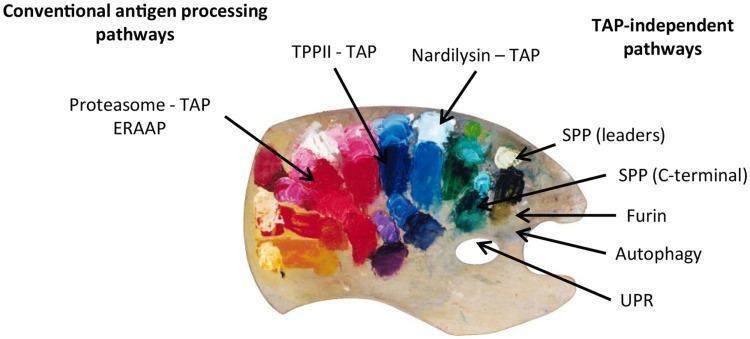
An educational infographic using a painter's palette as a metaphor to illustrate the diverse origins of MHC class I peptide repertoires. The visual categorizes antigen processing into two primary groups: 'Conventional antigen processing pathways' and 'TAP-independent pathways.' The conventional side features bright pigments (reds, pinks, blues) representing dominant pathways involving Proteasome, TAP, ERAAP, TPPII, and Nardilysin. In contrast, the 'TAP-independent' side (often associated with T-cell epitopes associated with impaired peptide processing or TEIPPs) is represented by darker, more muted tones (blacks, greys, dark greens). Specific TAP-independent sources labeled include signal peptide peptidase (SPP) for leader and C-terminal sequences, Furin-mediated cleavage in the secretory pathway, Autophagy, and the Unfolded Protein Response (UPR). This diagram emphasizes that while conventional pathways provide the majority of the peptide pool, alternative pathways contribute a distinct 'color' to the cellular presentation, particularly under conditions of cellular stress or TAP deficiency.
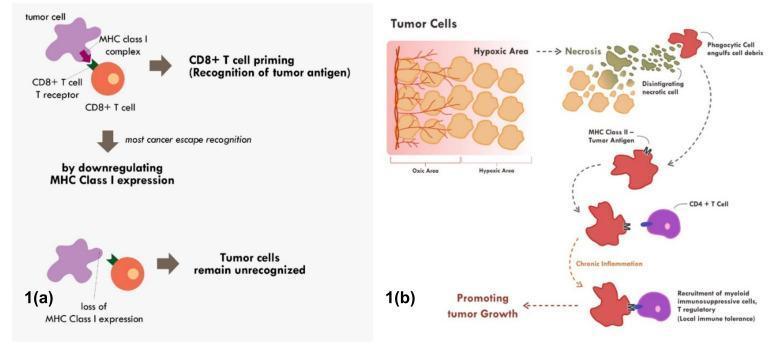
Two-panel pathophysiology diagram illustrating mechanisms of tumor immune escape and tolerance. Panel (a) depicts immune evasion via Major Histocompatibility Complex (MHC) Class I downregulation. Initially, a tumor cell presents antigen via MHC Class I to a CD8+ T cell receptor, leading to T cell priming and recognition. Below, the diagram shows the subsequent loss of MHC Class I expression on the tumor cell surface, resulting in the tumor remaining unrecognized by cytotoxic T cells. Panel (b) illustrates immune tolerance secondary to chronic inflammation in the tumor microenvironment. It shows a progression from an oxic area to a hypoxic zone, leading to cell necrosis and the disintegration of tumor cells. Phagocytic cells (antigen-presenting cells) engulf the resulting cell debris and present tumor antigens via MHC Class II to CD4+ T cells. This chronic inflammatory pathway drives the recruitment of myeloid immunosuppressive cells and regulatory T cells (Tregs), establishing local immune tolerance and promoting further tumor growth. The diagram is intended for oncology and immunology education, detailing how cancer cells circumvent host surveillance through surface molecule manipulation and the exploitation of the inflammatory necrotic response.
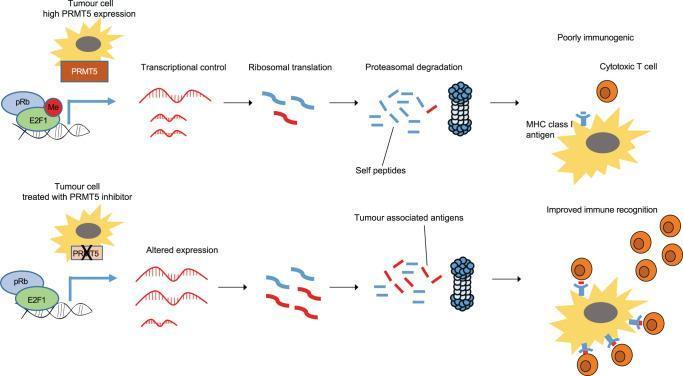
This pathophysiology diagram illustrates the molecular pathway of lncRNA-derived antigen presentation in tumor cells under two conditions: high PRMT5 expression (untreated) and pharmacological PRMT5 inhibition. The upper panel shows that PRMT5 methylates E2F1 (Me), which interacts with pRb at the DNA level to exert transcriptional control. This leads to ribosomal translation and proteasomal degradation of predominantly 'self-peptides' (blue), resulting in an MHC class I antigen display that is poorly immunogenic to cytotoxic T cells. The lower panel depicts a tumor cell treated with a PRMT5 inhibitor (T1-44), which halts E2F1 methylation. This results in altered transcriptional expression of lncRNAs, yielding a different polypeptide composition during ribosomal translation. Subsequent proteasomal degradation generates 'Tumour associated antigens' (red) that are presented on MHC class I complexes. This alteration leads to improved immune recognition and increased infiltration of cytotoxic T cells. This diagram illustrates a novel mechanism where PRMT5 and E2F1 regulate the non-coding genome to influence tumor immunogenicity.
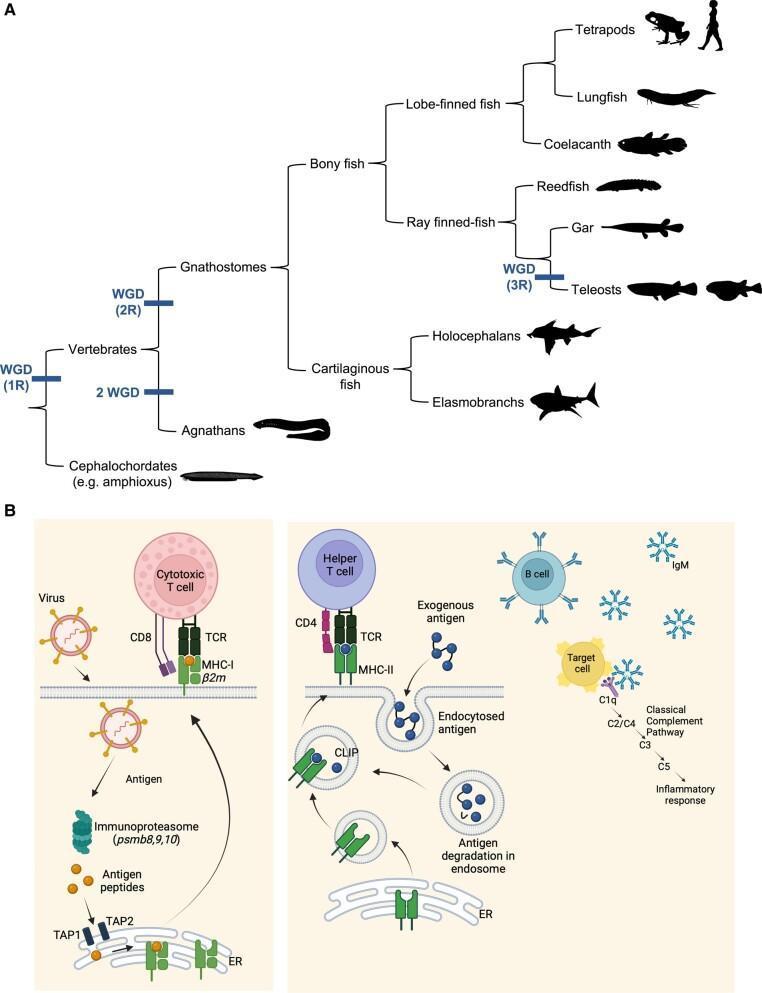
Educational medical schematic combining evolutionary biology and immunology. Section A depicts a phylogenetic tree of vertebrate lineages, highlighting whole-genome duplication (WGD) events (1R, 2R, and 3R) in the evolution of Gnathostomes, including cartilaginous fish, bony fish, and tetrapods. Section B provides a comparative pathophysiology diagram of the adaptive immune system. The left panel illustrates the MHC-I pathway: intracellular viral antigens are processed by the immunoproteasome (psmb8,9,10), transported via TAP1/TAP2 into the endoplasmic reticulum (ER), and presented to CD8+ cytotoxic T cells via the MHC-I/beta-2 microglobulin complex. The center panel shows the MHC-II pathway: exogenous antigens are endocytosed, degraded in endosomes, and loaded onto MHC-II molecules (facilitated by CLIP) for presentation to CD4+ helper T cells. The right panel demonstrates the classical complement pathway, where IgM bound to antigens on a target cell activates C1q, C2/C4, C3, and C5, leading to an inflammatory response. This visual summarizes key concepts in antigen processing and humoral immunity.
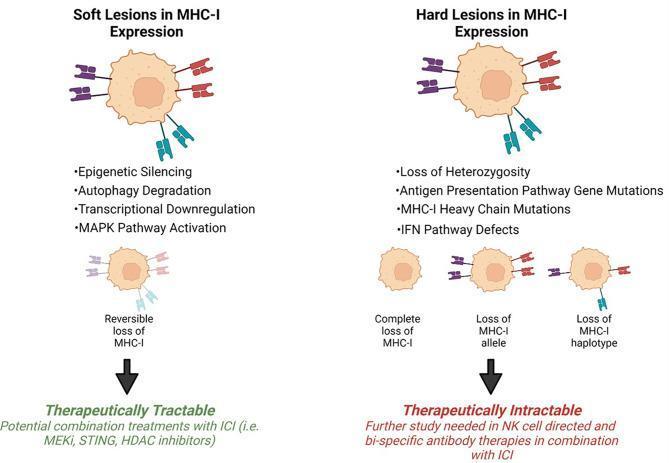
This medical illustration compares two mechanisms of Major Histocompatibility Complex Class I (MHC-I) downregulation in tumor cells: Soft Lesions and Hard Lesions. The diagram uses cell representations with colored surface markers (purple, red, and blue) symbolizing MHC-I molecules. 'Soft Lesions' are characterized by reversible downregulation caused by epigenetic silencing, autophagy degradation, transcriptional downregulation, or MAPK pathway activation. This state is labeled 'Therapeutically Tractable,' suggesting recovery via combination treatments such as MEKi, STING, or HDAC inhibitors. In contrast, 'Hard Lesions' represent irreversible genetic alterations, including loss of heterozygosity, antigen presentation pathway gene mutations, MHC-I heavy chain mutations, and IFN pathway defects. These result in complete loss of MHC-I, loss of specific alleles, or loss of haplotypes. Such lesions are labeled 'Therapeutically Intractable,' requiring alternative approaches like NK cell-directed or bispecific antibody therapies. The visual focus is on the quantity and presence of surface markers to indicate the degree of immune evasion and potential for therapeutic restoration of antigen presentation.
A detailed medical education infographic titled "Antigen Presentation Pathways" showing two parallel pathways side by side inside a single antigen-presenting cell (APC). LEFT SIDE - MHC Class II Pathway (blue color scheme): - Label: "MHC CLASS II PATHWAY" with subtitle "Exogenous Antigens → CD4+ T Helper Cells" - Step 1: Extracellular antigen (bacteria/protein) enters via endocytosis into an endosome, labeled "Endocytosis of extracellular antigen" - Step 2: Endosome merges with lysosome → "Endolysosome: cathepsins degrade protein into peptides (13–25 aa)" - Step 3: MHC Class II molecule (α+β chains) synthesized in ER, associated with Invariant Chain (Ii) blocking peptide groove, travels through Golgi - Step 4: Golgi vesicle with MHC II fuses with endolysosome → "HLA-DM catalyzes CLIP removal and peptide loading" - Step 5: Peptide-MHC II complex → cell surface → presented to CD4+ T Helper Cell via TCR - APCs listed: "Professional APCs: Dendritic cells, Macrophages, B cells" RIGHT SIDE - MHC Class I Pathway (orange/red color scheme): - Label: "MHC CLASS I PATHWAY" with subtitle "Endogenous Antigens → CD8+ Cytotoxic T Cells" - Step 1: Intracellular antigen (virus/mutated protein) in cytosol, labeled "Cytosolic/endogenous protein" - Step 2: Proteasome (barrel-shaped complex) degrades protein → "Proteasome: ubiquitin-tagged proteins → peptides (8–10 aa)" - Step 3: TAP transporter (TAP1+TAP2) on ER membrane transports peptides into ER lumen - Step 4: MHC Class I (α chain + β2-microglobulin) in ER associates with peptide-loading complex (tapasin, calreticulin, ERp57) → "Peptide loading in ER" - Step 5: Stable peptide-MHC I complex travels Golgi → cell surface → presented to CD8+ Cytotoxic T Cell via TCR - APCs listed: "All nucleated cells" CENTER: Large labeled cell with nucleus, ER, and Golgi apparatus visible BOTTOM: Comparison table with columns "Feature | MHC Class I | MHC Class II" and rows: Antigen source, APC types, Peptide length, Site of loading, T cell activated, Key molecules CROSS-PRESENTATION note in a box: "Cross-presentation: Dendritic cells can present exogenous antigens on MHC Class I → activates CD8+ T cells" Color scheme: professional, clean medical illustration style with blue for MHC II pathway and orange/red for MHC I pathway, white background, clear arrows showing direction of flow, numbered steps
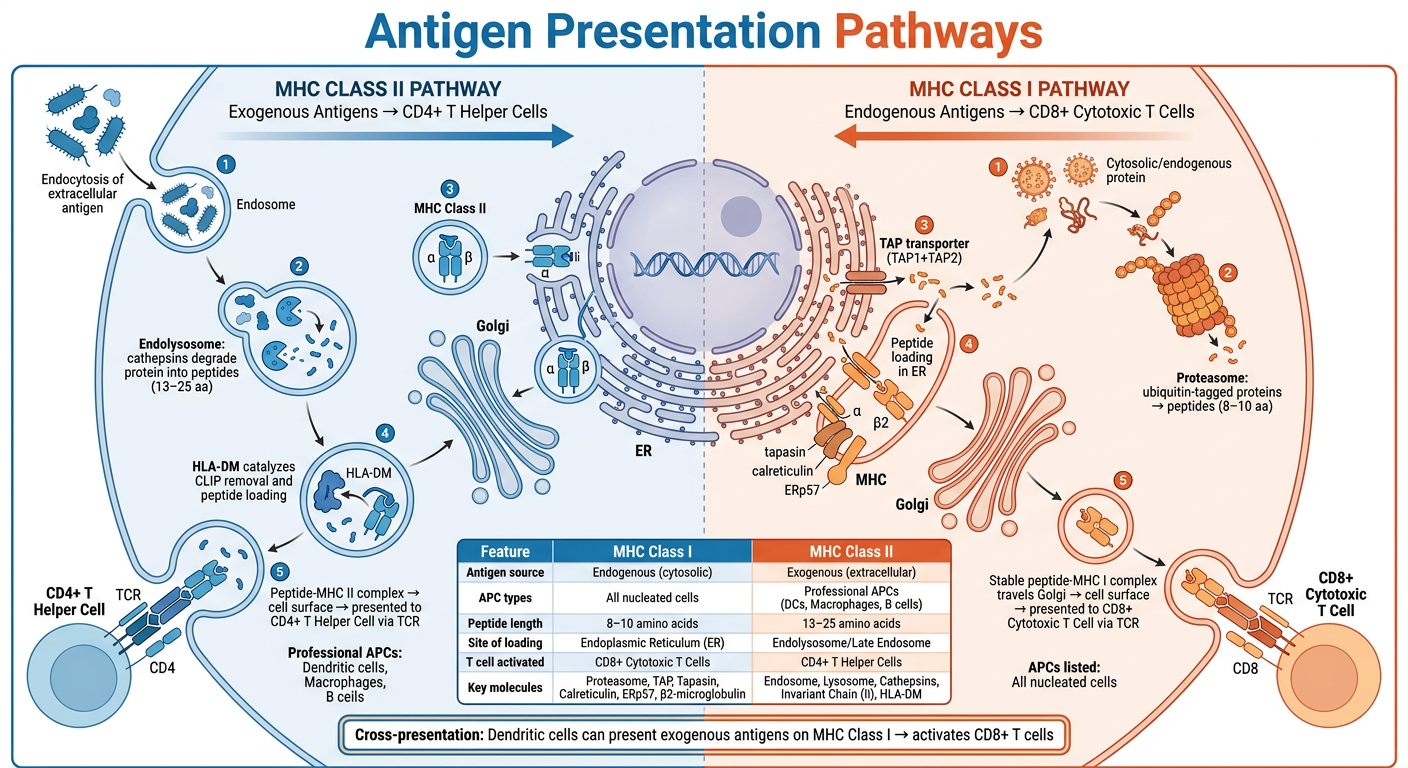
MHC Class I Pathway - Endogenous Antigens
| Step | Event |
|---|---|
| 1 | Intracellular proteins (viral, mutated tumor antigens) are tagged with ubiquitin |
| 2 | Proteasome (β1, β2, β5 subunits) degrades them into peptides 8-10 amino acids long |
| 3 | TAP1/TAP2 transporter moves peptides into the ER lumen |
| 4 | Peptide binds MHC I (α chain + β2-microglobulin) within the peptide-loading complex (tapasin, calreticulin, ERp57) |
| 5 | Stable complex exits ER → Golgi → cell surface |
| 6 | Presented to CD8+ cytotoxic T cells via TCR |
MHC Class II Pathway - Exogenous Antigens
| Step | Event |
|---|---|
| 1 | Extracellular antigen enters APC via endocytosis/phagocytosis |
| 2 | Cathepsins in late endosomes/lysosomes degrade protein into peptides 13-25 amino acids long |
| 3 | MHC II (α+β chains) synthesized in ER with Invariant chain (Ii) blocking the groove; CLIP occupies binding site |
| 4 | MHC II vesicle fuses with antigen-containing endolysosome |
| 5 | HLA-DM catalyzes removal of CLIP and loading of antigenic peptide |
| 6 | Peptide-MHC II → cell surface → presented to CD4+ helper T cells |
Comparison Table
| Feature | MHC Class I | MHC Class II |
|---|---|---|
| Antigen source | Cytosolic (endogenous) | Endosomal/extracellular |
| Peptide length | 8-10 aa | 13-25 aa |
| Site of loading | ER | Late endosome/lysosome |
| Key transport molecules | TAP, tapasin | Invariant chain, HLA-DM |
| T cell activated | CD8+ cytotoxic T cells | CD4+ helper T cells |
| APCs | All nucleated cells | Professional APCs only |
Cross-Presentation (bonus)
Sources: Goodman & Gilman's Pharmacological Basis of Therapeutics, p. 774 | Cellular and Molecular Immunology, pp. 416-417 | Junqueira's Basic Histology 17e, pp. 675-676
Create a high-resolution PDF comparison poster: MHC Class I vs II
mkdir -p /tmp/workspace/mhc-poster && ls /tmp/workspace/mhc-poster/
Create a flowchart of both pathway
mkdir -p /tmp/workspace/mhc-poster && python3 -c "import reportlab, matplotlib; print('libs ok')"
~/mhc-poster/generate_flowchart.py
"""
MHC Class I vs Class II Antigen Presentation Pathway Flowchart
High-resolution PDF using matplotlib + reportlab
"""

import matplotlib
matplotlib.use('Agg')
import matplotlib.pyplot as plt
import matplotlib.patches as mpatches
from matplotlib.patches import FancyBboxPatch, FancyArrowPatch
import matplotlib.patheffects as pe
import numpy as np
from reportlab.lib.pagesizes import A2
from reportlab.pdfgen import canvas
from reportlab.lib.utils import ImageReader
import io

# ── colour palette ──────────────────────────────────────────────────────────
BG          = "#F7F9FC"
TITLE_BG    = "#1A1A2E"
TITLE_FG    = "#FFFFFF"

C1_DARK     = "#C0392B"   # MHC I – deep red
C1_MID      = "#E74C3C"
C1_LIGHT    = "#FADBD8"
C1_ACCENT   = "#F1948A"

C2_DARK     = "#1A5276"   # MHC II – deep blue
C2_MID      = "#2980B9"
C2_LIGHT    = "#D6EAF8"
C2_ACCENT   = "#85C1E9"

ARROW_C1    = "#922B21"
ARROW_C2    = "#154360"
DIVIDER     = "#BDC3C7"
TEXT_DARK   = "#1C1C1C"
TEXT_MED    = "#2C3E50"
NOTE_BG     = "#FEF9E7"
NOTE_BORDER = "#F39C12"
CROSS_BG    = "#EAF2FF"
CROSS_BDR   = "#5DADE2"

# ── figure setup ────────────────────────────────────────────────────────────
FIG_W, FIG_H = 22, 30
fig, ax = plt.subplots(figsize=(FIG_W, FIG_H))
ax.set_xlim(0, FIG_W)
ax.set_ylim(0, FIG_H)
ax.axis('off')
fig.patch.set_facecolor(BG)
ax.set_facecolor(BG)

# ── helpers ──────────────────────────────────────────────────────────────────
def rbox(ax, x, y, w, h, fc, ec, lw=1.5, radius=0.35, alpha=1.0, zorder=3):
    b = FancyBboxPatch((x - w/2, y - h/2), w, h,
                       boxstyle=f"round,pad=0,rounding_size={radius}",
                       facecolor=fc, edgecolor=ec, linewidth=lw,
                       alpha=alpha, zorder=zorder)
    ax.add_patch(b)

def label(ax, x, y, txt, fs=10, color=TEXT_DARK, bold=False, ha='center', va='center',
          wrap=False, zorder=5):
    weight = 'bold' if bold else 'normal'
    ax.text(x, y, txt, fontsize=fs, color=color, fontweight=weight,
            ha=ha, va=va, zorder=zorder,
            wrap=wrap, multialignment='center',
            fontfamily='DejaVu Sans')

def arrow(ax, x1, y1, x2, y2, color, lw=2.2, headw=0.22, headl=0.22, zorder=4):
    ax.annotate('', xy=(x2, y2), xytext=(x1, y1),
                arrowprops=dict(arrowstyle=f'->,head_width={headw},head_length={headl}',
                                color=color, lw=lw),
                zorder=zorder)

def diamond(ax, cx, cy, w, h, fc, ec, lw=1.5, zorder=3):
    pts = np.array([[cx, cy+h/2],[cx+w/2,cy],[cx,cy-h/2],[cx-w/2,cy]])
    poly = plt.Polygon(pts, closed=True, facecolor=fc, edgecolor=ec, linewidth=lw, zorder=zorder)
    ax.add_patch(poly)

def step_box(ax, x, y, w, h, number, title, subtitle,
             fc, ec, num_fc, num_ec, title_color=TEXT_DARK):
    rbox(ax, x, y, w, h, fc, ec, lw=2)
    # number badge
    circle = plt.Circle((x - w/2 + 0.55, y + h/2 - 0.42), 0.32,
                         color=num_fc, ec=num_ec, lw=1.5, zorder=6)
    ax.add_patch(circle)
    ax.text(x - w/2 + 0.55, y + h/2 - 0.42, str(number),
            fontsize=9, color='white', ha='center', va='center',
            fontweight='bold', zorder=7)
    # title
    ax.text(x, y + 0.18, title, fontsize=10.5, color=title_color,
            ha='center', va='center', fontweight='bold',
            multialignment='center', zorder=5, fontfamily='DejaVu Sans')
    # subtitle
    ax.text(x, y - 0.30, subtitle, fontsize=8.8, color=TEXT_MED,
            ha='center', va='center', style='italic',
            multialignment='center', zorder=5, fontfamily='DejaVu Sans',
            wrap=True)

# ════════════════════════════════════════════════════════════════════════════
# TITLE BANNER
# ════════════════════════════════════════════════════════════════════════════
rbox(ax, FIG_W/2, 29.1, FIG_W - 0.6, 1.5, TITLE_BG, TITLE_BG, radius=0.4, zorder=2)
label(ax, FIG_W/2, 29.35, "ANTIGEN PRESENTATION PATHWAYS", fs=22,
      color='white', bold=True, zorder=6)
label(ax, FIG_W/2, 28.82,
      "MHC Class I (Endogenous)  ·  MHC Class II (Exogenous)  ·  Cross-Presentation",
      fs=12, color="#AED6F1", bold=False, zorder=6)

# ════════════════════════════════════════════════════════════════════════════
# COLUMN HEADERS
# ════════════════════════════════════════════════════════════════════════════
# MHC I header
rbox(ax, 5.8, 27.8, 9.6, 1.1, C1_DARK, C1_DARK, radius=0.35, zorder=3)
label(ax, 5.8, 28.1, "MHC CLASS I PATHWAY", fs=16, color='white', bold=True)
label(ax, 5.8, 27.58, "Endogenous Antigens  →  CD8⁺ Cytotoxic T Cells  |  APCs: All Nucleated Cells",
      fs=9.5, color="#FADBD8")

# MHC II header
rbox(ax, 16.2, 27.8, 9.6, 1.1, C2_DARK, C2_DARK, radius=0.35, zorder=3)
label(ax, 16.2, 28.1, "MHC CLASS II PATHWAY", fs=16, color='white', bold=True)
label(ax, 16.2, 27.58, "Exogenous Antigens  →  CD4⁺ Helper T Cells  |  APCs: DCs, Macrophages, B Cells",
      fs=9.5, color="#D6EAF8")

# vertical divider
ax.plot([FIG_W/2, FIG_W/2], [1.2, 27.2], color=DIVIDER, lw=2, ls='--', zorder=2)

# ════════════════════════════════════════════════════════════════════════════
# MHC CLASS I – LEFT COLUMN  (x centre = 5.8)
# ════════════════════════════════════════════════════════════════════════════
X1 = 5.8
BW, BH = 8.6, 1.45   # box width / height
GAP = 2.2             # centre-to-centre vertical gap

steps_I = [
    (1, "INTRACELLULAR ANTIGEN",
        "Viral proteins, mutated tumour proteins,\nor other cytosolic self/non-self proteins",
        C1_LIGHT, C1_MID, C1_DARK, C1_DARK),
    (2, "UBIQUITINATION",
        "Misfolded or foreign proteins tagged\nwith polyubiquitin chains for degradation",
        C1_LIGHT, C1_MID, C1_DARK, C1_DARK),
    (3, "PROTEASOMAL DEGRADATION",
        "26S proteasome (β1, β2, β5 subunits) cleaves\nprotein → short peptides  8–10 amino acids",
        C1_LIGHT, C1_MID, C1_DARK, C1_DARK),
    (4, "TAP TRANSPORT INTO ER",
        "TAP1/TAP2 heterodimer pumps peptides\nacross ER membrane into the ER lumen",
        C1_LIGHT, C1_MID, C1_DARK, C1_DARK),
    (5, "PEPTIDE-LOADING COMPLEX (PLC)",
        "MHC I (α chain + β₂m) + tapasin + calreticulin\n+ ERp57 stabilise & load optimal peptides",
        C1_LIGHT, C1_MID, C1_DARK, C1_DARK),
    (6, "ER QUALITY CONTROL",
        "Only stable peptide-MHC I trimers\nare released from the PLC",
        C1_LIGHT, C1_MID, C1_DARK, C1_DARK),
    (7, "GOLGI PROCESSING",
        "Peptide-MHC I complex travels\nthrough cis → medial → trans-Golgi",
        C1_LIGHT, C1_MID, C1_DARK, C1_DARK),
    (8, "SURFACE DISPLAY & T CELL ACTIVATION",
        "pMHC I on APC surface → TCR of CD8⁺ T cell\n+ CD8 co-receptor → cytotoxic T cell activation",
        C1_DARK, C1_DARK, "#F7F9FC", "#F7F9FC"),
]

# Starting Y for first box
Y_START = 26.15
for i, (num, title, sub, fc, ec, num_fc, num_ec) in enumerate(steps_I):
    cy = Y_START - i * GAP
    title_col = TEXT_DARK if fc != C1_DARK else 'white'
    sub_col   = TEXT_MED  if fc != C1_DARK else "#FADBD8"
    rbox(ax, X1, cy, BW, BH, fc, ec, lw=2)
    # number badge
    circle = plt.Circle((X1 - BW/2 + 0.55, cy + BH/2 - 0.38), 0.30,
                         color=num_fc, ec=num_ec, lw=1.5, zorder=6)
    ax.add_patch(circle)
    ax.text(X1 - BW/2 + 0.55, cy + BH/2 - 0.38, str(num),
            fontsize=9, color='white' if num_fc != "#F7F9FC" else C1_DARK,
            ha='center', va='center', fontweight='bold', zorder=7)
    ax.text(X1, cy + 0.25, title, fontsize=10, color=title_col,
            ha='center', va='center', fontweight='bold',
            multialignment='center', zorder=5)
    ax.text(X1, cy - 0.28, sub, fontsize=8.5, color=sub_col,
            ha='center', va='center', style='italic',
            multialignment='center', zorder=5)
    # arrow to next
    if i < len(steps_I) - 1:
        arrow(ax, X1, cy - BH/2, X1, cy - GAP + BH/2, ARROW_C1)

# ════════════════════════════════════════════════════════════════════════════
# MHC CLASS II – RIGHT COLUMN  (x centre = 16.2)
# ════════════════════════════════════════════════════════════════════════════
X2 = 16.2

steps_II = [
    (1, "EXOGENOUS ANTIGEN UPTAKE",
        "Bacteria, viruses, immune complexes\ninternalised by endocytosis / phagocytosis",
        C2_LIGHT, C2_MID, C2_DARK, C2_DARK),
    (2, "ENDOSOME FORMATION",
        "Antigen enclosed in early endosome;\nvesicle acidifies progressively",
        C2_LIGHT, C2_MID, C2_DARK, C2_DARK),
    (3, "LYSOSOMAL DEGRADATION",
        "Cathepsins (B, D, S, L) in late endosome /\nlysosome cleave protein → 13–25 aa peptides",
        C2_LIGHT, C2_MID, C2_DARK, C2_DARK),
    (4, "MHC II SYNTHESIS IN ER",
        "MHC II α+β chains assembled in ER;\nInvariant chain (Ii/CD74) blocks groove (CLIP)",
        C2_LIGHT, C2_MID, C2_DARK, C2_DARK),
    (5, "MIIC COMPARTMENT FUSION",
        "MHC II-Ii vesicle from Golgi fuses with\nantigen-containing late endosome (MIIC)",
        C2_LIGHT, C2_MID, C2_DARK, C2_DARK),
    (6, "HLA-DM CATALYSED PEPTIDE EXCHANGE",
        "HLA-DM removes CLIP; antigenic peptide\nloaded into groove; HLA-DO modulates DM",
        C2_LIGHT, C2_MID, C2_DARK, C2_DARK),
    (7, "GOLGI → CELL SURFACE TRANSPORT",
        "Stable peptide-MHC II complex exported\nthrough Golgi to plasma membrane",
        C2_LIGHT, C2_MID, C2_DARK, C2_DARK),
    (8, "SURFACE DISPLAY & T CELL ACTIVATION",
        "pMHC II on APC surface → TCR of CD4⁺ T cell\n+ CD4 co-receptor → helper T cell activation",
        C2_DARK, C2_DARK, "#F7F9FC", "#F7F9FC"),
]

for i, (num, title, sub, fc, ec, num_fc, num_ec) in enumerate(steps_II):
    cy = Y_START - i * GAP
    title_col = TEXT_DARK if fc != C2_DARK else 'white'
    sub_col   = TEXT_MED  if fc != C2_DARK else "#D6EAF8"
    rbox(ax, X2, cy, BW, BH, fc, ec, lw=2)
    circle = plt.Circle((X2 - BW/2 + 0.55, cy + BH/2 - 0.38), 0.30,
                         color=num_fc, ec=num_ec, lw=1.5, zorder=6)
    ax.add_patch(circle)
    ax.text(X2 - BW/2 + 0.55, cy + BH/2 - 0.38, str(num),
            fontsize=9, color='white' if num_fc != "#F7F9FC" else C2_DARK,
            ha='center', va='center', fontweight='bold', zorder=7)
    ax.text(X2, cy + 0.25, title, fontsize=10, color=title_col,
            ha='center', va='center', fontweight='bold',
            multialignment='center', zorder=5)
    ax.text(X2, cy - 0.28, sub, fontsize=8.5, color=sub_col,
            ha='center', va='center', style='italic',
            multialignment='center', zorder=5)
    if i < len(steps_II) - 1:
        arrow(ax, X2, cy - BH/2, X2, cy - GAP + BH/2, ARROW_C2)

# ════════════════════════════════════════════════════════════════════════════
# CROSS-PRESENTATION BOX  (centred between columns, mid height)
# ════════════════════════════════════════════════════════════════════════════
cpY = Y_START - 3.5 * GAP   # ~between step 4 and 5 vertically
rbox(ax, FIG_W/2, cpY, 2.8, 3.2, CROSS_BG, CROSS_BDR, lw=2, radius=0.4, zorder=4)
ax.text(FIG_W/2, cpY + 1.1, "CROSS-\nPRESENT-\nATION", fontsize=9, color=C2_DARK,
        ha='center', va='center', fontweight='bold', multialignment='center', zorder=6)
ax.text(FIG_W/2, cpY - 0.25,
        "DCs present\nexogenous Ag\non MHC I\n→ CD8⁺ T cell",
        fontsize=7.8, color=TEXT_MED,
        ha='center', va='center', style='italic', multialignment='center', zorder=6)
# dashed arrows from MHC II step 3 and to MHC I pathway
ax.annotate('', xy=(FIG_W/2 - 1.4, cpY + 0.4),
            xytext=(X2 - BW/2, Y_START - 2*GAP),
            arrowprops=dict(arrowstyle='->', color=CROSS_BDR, lw=1.6, ls='dashed'),
            zorder=5)
ax.annotate('', xy=(X1 + BW/2, Y_START - 2*GAP),
            xytext=(FIG_W/2 + 1.4, cpY + 0.4),
            arrowprops=dict(arrowstyle='->', color=C1_MID, lw=1.6, ls='dashed'),
            zorder=5)

# ════════════════════════════════════════════════════════════════════════════
# BOTTOM COMPARISON TABLE
# ════════════════════════════════════════════════════════════════════════════
TABLE_TOP = 2.85
TABLE_H   = 1.5
# background
rbox(ax, FIG_W/2, TABLE_TOP - 0.55, FIG_W - 0.6, TABLE_H + 0.2,
     "#EAECEE", "#95A5A6", lw=1.5, radius=0.3, zorder=2)

# header row
rbox(ax, FIG_W/2, TABLE_TOP + 0.3, FIG_W - 0.6, 0.55, "#2C3E50", "#2C3E50",
     lw=1, radius=0.3, zorder=3)
cols_x = [2.2, 7.0, 11.0, 15.2, 19.3]
headers = ["Feature", "MHC Class I", "MHC Class II", "MHC Class I", "MHC Class II"]
for hx, ht in zip(cols_x, headers):
    col = 'white'
    ax.text(hx, TABLE_TOP + 0.3, ht, fontsize=8.5, color=col,
            ha='center', va='center', fontweight='bold', zorder=5)

rows = [
    ("Antigen source",     "Cytosolic / endogenous", "Extracellular / exogenous"),
    ("Peptide length",     "8–10 amino acids",       "13–25 amino acids"),
    ("Degradation site",   "Proteasome",             "Late endosome / lysosome"),
    ("Peptide loading",    "ER (TAP + tapasin)",     "MIIC (HLA-DM, -DO)"),
    ("T cell activated",   "CD8⁺ Cytotoxic T cell", "CD4⁺ Helper T cell"),
    ("APC types",          "All nucleated cells",    "DCs, Macrophages, B cells"),
]

row_colors = ["#FDFEFE", "#F2F3F4"]
for ri, (feat, val1, val2) in enumerate(rows):
    ry = TABLE_TOP - 0.08 - ri * 0.22
    rc = row_colors[ri % 2]
    rbox(ax, FIG_W/2, ry, FIG_W - 0.7, 0.20, rc, "#D5D8DC", lw=0.5, radius=0.05, zorder=2)
    ax.text(cols_x[0], ry, feat,  fontsize=7.8, color=TEXT_DARK,
            ha='center', va='center', fontweight='bold', zorder=5)
    ax.text(cols_x[2], ry, val1, fontsize=7.8, color=C1_DARK,
            ha='center', va='center', zorder=5)
    ax.text(cols_x[4], ry, val2, fontsize=7.8, color=C2_DARK,
            ha='center', va='center', zorder=5)

# column headers for table values
ax.text(cols_x[2], TABLE_TOP - 0.08 - len(rows)*0.22 - 0.05,
        "▲ MHC I values", fontsize=7, color=C1_MID, ha='center', va='top')
ax.text(cols_x[4], TABLE_TOP - 0.08 - len(rows)*0.22 - 0.05,
        "▲ MHC II values", fontsize=7, color=C2_MID, ha='center', va='top')

# ════════════════════════════════════════════════════════════════════════════
# KEY MOLECULES LEGEND (between table and footer)
# ════════════════════════════════════════════════════════════════════════════
legend_y = 1.25
rbox(ax, FIG_W/2, legend_y, FIG_W - 0.6, 0.75, NOTE_BG, NOTE_BORDER,
     lw=1.5, radius=0.3, zorder=3)
ax.text(FIG_W/2, legend_y + 0.18,
        "KEY MOLECULES",
        fontsize=9, color=TEXT_DARK, ha='center', va='center',
        fontweight='bold', zorder=5)
ax.text(FIG_W/2, legend_y - 0.18,
        "MHC I: α chain, β₂-microglobulin, TAP1/TAP2, Tapasin, Calreticulin, ERp57"
        "   |   "
        "MHC II: α chain, β chain, Invariant chain (CD74/Ii), CLIP, HLA-DM, HLA-DO",
        fontsize=8.2, color=TEXT_MED, ha='center', va='center', zorder=5)

# ════════════════════════════════════════════════════════════════════════════
# FOOTER
# ════════════════════════════════════════════════════════════════════════════
rbox(ax, FIG_W/2, 0.42, FIG_W - 0.6, 0.52, TITLE_BG, TITLE_BG, radius=0.3, zorder=3)
ax.text(FIG_W/2, 0.42,
        "Sources: Cellular & Molecular Immunology (Abbas et al.) · "
        "Goodman & Gilman's Pharmacological Basis of Therapeutics · "
        "Junqueira's Basic Histology 17e",
        fontsize=7.5, color="#AED6F1", ha='center', va='center', zorder=5)

plt.tight_layout(pad=0)

# ── Save high-res PNG then embed in A2 PDF ───────────────────────────────
PNG_PATH = "/tmp/workspace/mhc-poster/flowchart.png"
PDF_PATH = "/tmp/workspace/mhc-poster/MHC_Pathway_Flowchart.pdf"

fig.savefig(PNG_PATH, dpi=200, bbox_inches='tight',
            facecolor=BG, edgecolor='none')
plt.close(fig)
print(f"PNG saved: {PNG_PATH}")

# Embed in A2 PDF
from reportlab.lib.pagesizes import A2, landscape
from reportlab.pdfgen import canvas as rl_canvas
from reportlab.lib.utils import ImageReader
from PIL import Image

img = Image.open(PNG_PATH)
iw, ih = img.size            # pixels
# A2 landscape dims in points
pdf_w, pdf_h = landscape(A2)

# scale to fit page with 18pt margin
margin = 18
avail_w = pdf_w - 2*margin
avail_h = pdf_h - 2*margin
scale   = min(avail_w / iw, avail_h / ih)
draw_w  = iw * scale
draw_h  = ih * scale
x_off   = margin + (avail_w - draw_w) / 2
y_off   = margin + (avail_h - draw_h) / 2

c = rl_canvas.Canvas(PDF_PATH, pagesize=landscape(A2))
c.setTitle("MHC Class I vs II Antigen Presentation Pathway Flowchart")
c.setAuthor("Orris Medical")
c.setSubject("Immunology – Antigen Presentation")
c.drawImage(ImageReader(PNG_PATH), x_off, y_off, width=draw_w, height=draw_h)
c.save()
print(f"PDF saved: {PDF_PATH}")
cd /tmp/workspace/mhc-poster && python3 generate_flowchart.py 2>&1
ls -lh /tmp/workspace/mhc-poster/

MHC Pathway Flowchart
PDF Document · PDF
- Intracellular antigen (viral/tumour proteins)
- Ubiquitination
- Proteasomal degradation → 8-10 aa peptides
- TAP1/TAP2 transport into ER
- Peptide-loading complex (tapasin, calreticulin, ERp57)
- ER quality control
- Golgi processing
- Surface display → CD8+ cytotoxic T cell activation
- Exogenous antigen uptake (endocytosis/phagocytosis)
- Endosome formation + acidification
- Cathepsin degradation → 13-25 aa peptides
- MHC II synthesis in ER with Invariant chain (CLIP)
- MIIC compartment fusion
- HLA-DM catalysed peptide exchange (CLIP removal)
- Golgi → cell surface transport
- Surface display → CD4+ helper T cell activation