
generate morphological picture of papillary thyroid cancer
papillary thyroid cancer morphology histology microscopy
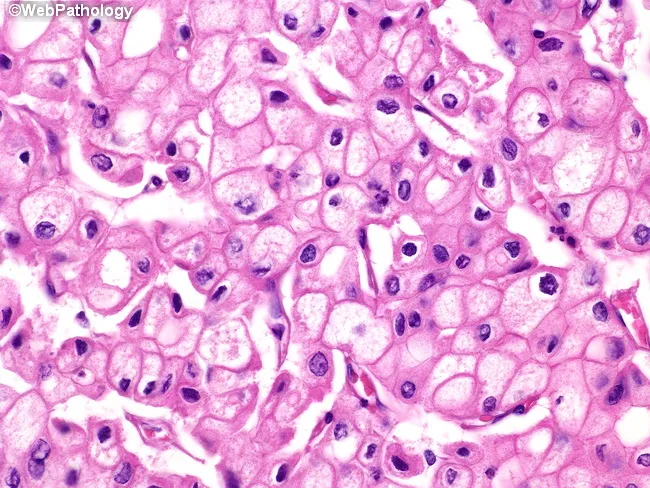
This is a histopathology slide of thyroid tissue prepared by hematoxylin and eosin staining, examined under brightfield light microscopy at high magnification. The specimen demonstrates epithelial neoplasm consistent with papillary thyroid carcinoma (PTC). The neoplastic cells are arranged in sheets and, where present, papillary fronds with fibrovascular cores are recognizable. The predominant cytoplasm is finely reticular and eosinophilic, with blander nuclear features. The nuclei show characteristic raisinoid appearance with nuclear grooves, giving an Orphan Annie eye look; the nuclear membranes are distinct and often thickened. Perinuclear halos, i.e., clear nuclear clearing around the chromatin, are evident. Some tumor cells exhibit voluminous cytoplasm, and in the plane of section, nuclei may be absent in those cells, a phenomenon of sectioning rather than true anuclear cells. The cytoplasmic clearing and grooves are diagnostic, aiding differentiation from benign nodules. The histology carries diagnostic significance, with PTC carrying generally favorable prognosis but potential for lymphatic metastasis; differential includes follicular carcinoma, medullary carcinoma, Hashimoto-related changes, and benign adenomas. Clinically, presence of these features correlates with occult metastasis risk and guides surgical planning, post-operative radioiodine therapy considerations, and molecular testing (e.g., BRAF V600E). This image is relevant for medical education, pathology teaching files, digital atlases, and research on thyroid cancer morphology.
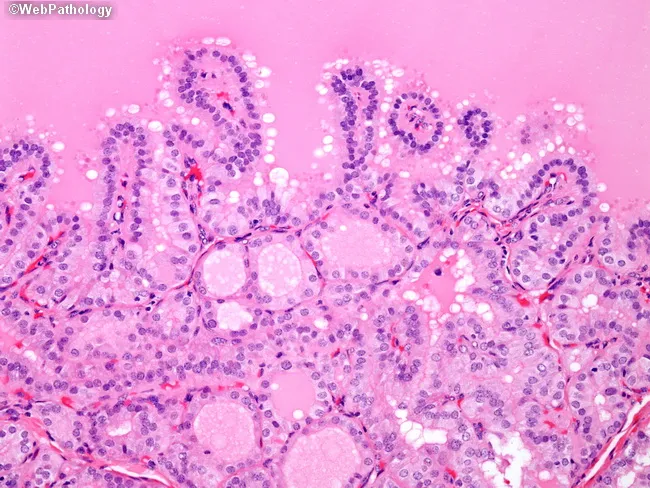
Thyroid gland histology section examined under light microscopy with Hematoxylin and Eosin stain. The thyroid follicles show marked epithelial hyperplasia with crowding of nuclei, producing papillary-like folds into the colloid. This pattern occurs in Graves disease and reflects hormonally driven follicular hyperplasia rather than neoplastic papillary thyroid carcinoma. Notable features include focal papillary infoldings with absence of malignant nuclear characteristics such as grooves, inclusions, or clearing. Clinical context typically reveals hyperthyroidism, with low TSH and elevated thyroid hormones. The changes are autoimmune-mediated, driven by thyroid-stimulating immunoglobulin (TSI) stimulating TSH receptors, leading to diffuse follicular enlargement and increased colloid turnover. In the absence of carcinoma-associated nuclear morphology, these findings should not be misinterpreted as papillary thyroid carcinoma. The image highlights how architectural changes can mimic neoplasia while lacking PTC cytology. Differential considerations include papillary carcinoma, nodular goiter, and thyroiditis; the decisive factors are epithelial architecture and nuclear phenotype. This histology is clinically significant to avoid overtreatment and guide management such as antithyroid therapy, radioiodine, or surgery based on clinical and biochemical context. Educationally, it supports pathology training, radiology-pathology correlation, and recognition of Graves-associated thyroid changes in suspected hyperthyroid patients. Correlate with serology and imaging for comprehensive patient assessment. With clinical correlation.
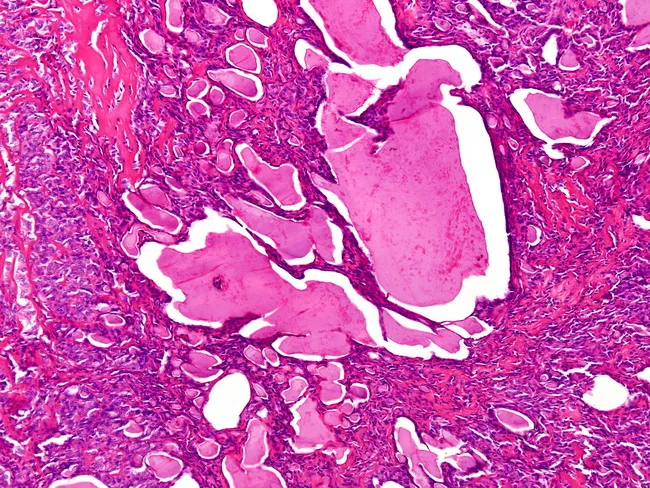
This histopathology image represents renal tissue involved by metastatic thyroid carcinoma, prepared as a hematoxylin and eosin stained slide and examined under light microscopy. The renal cortical/parenchymal field contains variably sized follicles filled with colloid‑like material, features that mimic thyroid follicles. The left side shows microfollicles with abortive lumens and solid appearance, consistent with a thyroid‑type neoplasm invading renal parenchyma. The architectural pattern is compatible with papillary or follicular thyroid carcinoma morphology, including follicle‑forming tumor cells arranged in microacini and acinar clusters amidst desmoplastic stroma. Distinguishing between a primary renal neoplasm and metastatic thyroid carcinoma hinges on immunohistochemical profile and clinical context. If a thyroid primary is confirmed and nuclear features typical of papillary thyroid carcinoma (Orphan Annie eye nuclei, nuclear grooves, grooves/inclusions) are present in metastatic deposits, then immunoreactivity for thyroid transcription factor‑1 (TTF‑1) and thyroglobulin would favor thyroid origin and metastasis. Conversely, a primary renal neoplasm would be unlikely to express TTF‑1 or thyroglobulin. Clinically, recognizing this pattern has implications for staging, prognosis, and treatment, including thyroid cancer‑focused systemic therapy and surveillance for additional metastases. This image underscores the necessity of integrating histology with patient history and immunohistochemistry in diagnostic decision making.
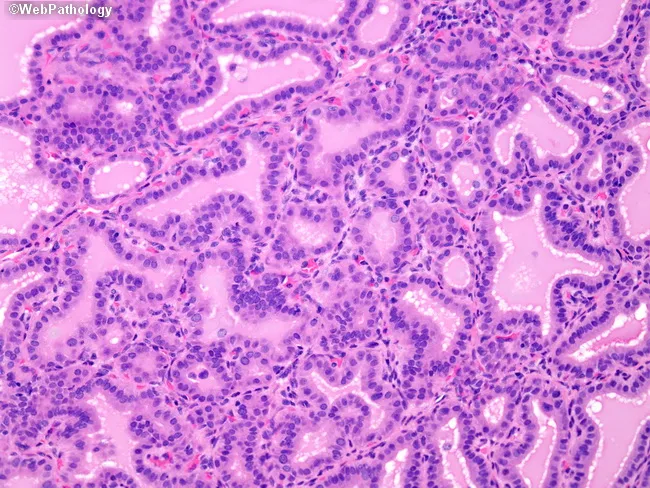
Imaging modality: light microscopy of hematoxylin and eosin–stained thyroid tissue sections. Primary subject: thyroid follicular epithelium with colloid-filled follicles. Anatomical context: thyroid gland parenchyma in the cervical region, showing follicles lined by tall columnar epithelium. Morphology: hypercellular epithelium with marked nuclear crowding creates papillary infoldings that protrude into the glandular lumens. Pale colloid is present within the follicles and margins appear scalloped. In architectural detail, papillary projections resemble papillary thyroid carcinoma but lack true fibrovascular cores, a key differentiator on histology. The follicular lumens vary in size, and colloid shows scalloping margins, consistent with benign activity rather than malignant invasion. Cytologic features include elongated nuclei with ovoid contours and scant cytoplasm; mitotic activity is not conspicuous. Immunophenotype is not assessed in this image; histology alone raises diagnostic considerations of benign hyperplastic changes including nodular hyperplasia or benign follicular adenoma with papillary-like infoldings. Diagnostic significance: recognition of papillary-like architecture without fibrovascular cores reduces the likelihood of classic papillary thyroid carcinoma, and highlights the need for correlating with nuclear features and ancillary studies. This image is relevant for surgical pathology reference, education, and differential diagnosis training in endocrine pathology. These considerations are essential for resident education, diagnostic conundrums, and interdisciplinary tumor boards.
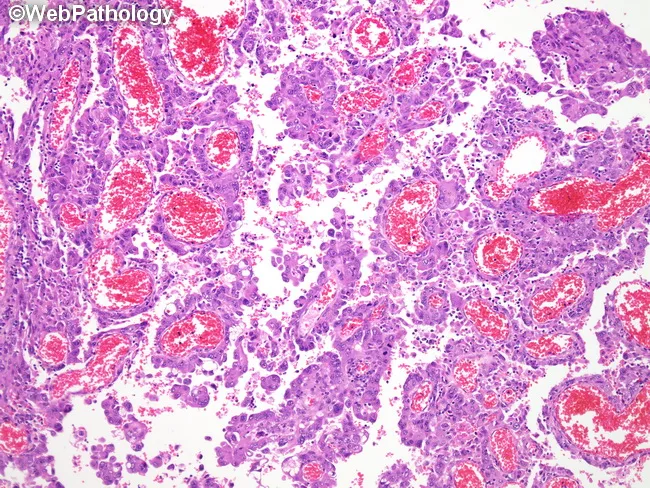
Imaging modality: light microscopy of a hematoxylin and eosin (H&E) stained histology slide of lung tissue, illustrating papillary adenocarcinoma. The sampled pulmonary parenchyma displays papillary finger-like fronds projecting into alveolar spaces, each papilla built around a central delicate fibrovascular core. Epithelial cells line the cores in multiple layers, typically cuboidal to columnar in shape, with mild to moderate nuclear atypia and increased cellular density along the papillary surfaces. The tumor nests extend along alveolar septa and may detach partially, creating free-floating clusters within airspaces. The stroma between papillary fronds is scant, and vascular cores are conspicuous by red-pink stromal material on the H&E stain. Some areas show complex branching and fusion of papillae, giving a lane-like architecture. In contrast to micropapillary variants, these papillary structures retain true fibrovascular cores; however, focal lepidic or artifactual tangential sections can mimic nonpapillary growth. The overall pattern supports a diagnosis of papillary predominant adenocarcinoma of the lung, a histologic subtype of non-small cell lung cancer (NSCLC). Clinically, recognition of papillary morphology has diagnostic significance for subtype classification, prognosis, and potential molecular testing considerations (EGFR, KRAS, ALK), guiding therapeutic decisions. This histologic context informs prognosis, treatment planning, and multidisciplinary management decisions in routine diagnostic practice.
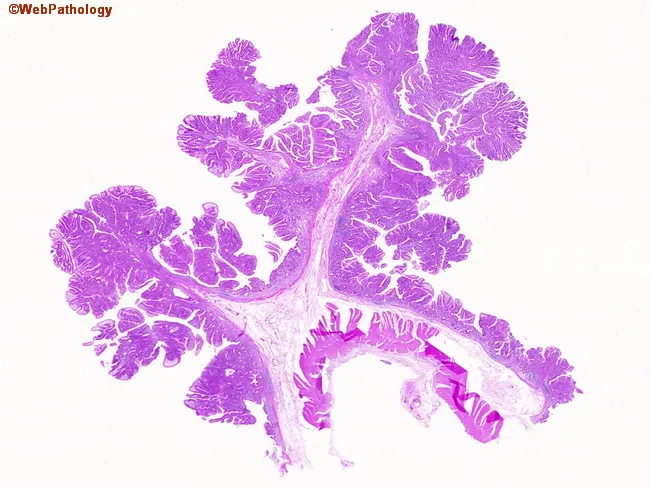
This image depicts a hematoxylin and eosin stained histology section observed under light microscopy. The tissue demonstrates prominent papillary architecture characterized by multiple arborizing papillary fronds with elongated, branching cores composed of fibrous stroma and precariously positioned capillary-like vessels. The papillary fronds are lined by a single or stratified layer of epithelial cells with basophilic nuclei, showing typical polarity and minimal cytologic atypia; mitotic activity is not evident at this magnification. The overall pattern is suggestive of a papillary neoplasm rather than a ductal or acinar structure, and the cores create a characteristic vascularized stalk that projects into a glandular lumen or cystic space. The image lacks clinical context but, in a diagnostic setting, would prompt consideration of papillary carcinomas depending on the organ of origin (e.g., papillary thyroid carcinoma, papillary urothelial carcinoma, papillary renal cell carcinoma). Differential diagnoses include benign papillary lesions and inflammatory papillary proliferations. Immunohistochemical panels (e.g., TTF-1, thyroglobulin for thyroid; GATA3, CK7/CK20 for urothelial; PAX8, RCC markers for renal) would be essential for tissue-of-origin determination. Clinically, recognizing papillary morphology in biopsy aids in tumor grading, staging, and guiding management decisions. This description emphasizes morphology and context to support searchability and educational utility.
Papillary Thyroid Carcinoma - Morphology
1. Classic H&E Histology - Diagnostic Nuclear Features
- Nuclear grooves (longitudinal folding of the nuclear membrane)
- Intranuclear cytoplasmic pseudoinclusions (perinuclear halos/clearing)
- Enlarged, overlapping nuclei with irregular membranes
- Finely reticular, eosinophilic cytoplasm
2. Papillary Architecture with Fibrovascular Cores
Summary of Morphological Features of PTC
| Feature | Description |
|---|---|
| Architecture | Papillary fronds with fibrovascular cores; may show follicular, solid, or mixed patterns |
| Nuclei | "Orphan Annie eye" - optically clear, ground-glass chromatin |
| Nuclear grooves | Longitudinal lines in nuclei - pathognomonic |
| Inclusions | Intranuclear cytoplasmic pseudoinclusions |
| Psammoma bodies | Concentric calcified laminated bodies (~50% of cases) |
| Growth pattern | Papillary, follicular variant, tall cell, columnar, diffuse sclerosing |
| Stroma | Fibrous, often with sclerosis and lymphocytic infiltration |
| Spread | Characteristic lymphatic spread to cervical lymph nodes |
Note: The nuclear features (grooves + Orphan Annie nuclei + pseudoinclusions) are diagnostic even in follicular-patterned variants without true papillary structures. BRAF V600E mutation is present in ~60% of cases.
can you give me something labelled
A detailed labelled medical diagram of papillary thyroid carcinoma histology. Show a hematoxylin and eosin stained microscopy view with clear anatomical labels pointing to: "Orphan Annie Eye Nuclei" (optically clear ground-glass nuclei), "Nuclear Groove" (longitudinal fold in nucleus), "Intranuclear Pseudoinclusion" (cytoplasmic inclusion in nucleus), "Fibrovascular Core" (central stalk of papillary frond), "Papillary Frond" (finger-like projection), "Psammoma Body" (concentric laminated calcification), "Overlapping Nuclei", and "Neoplastic Epithelial Cells". Medical education diagram style, clean white background with arrows and labels, realistic H&E staining colors (pink and purple).
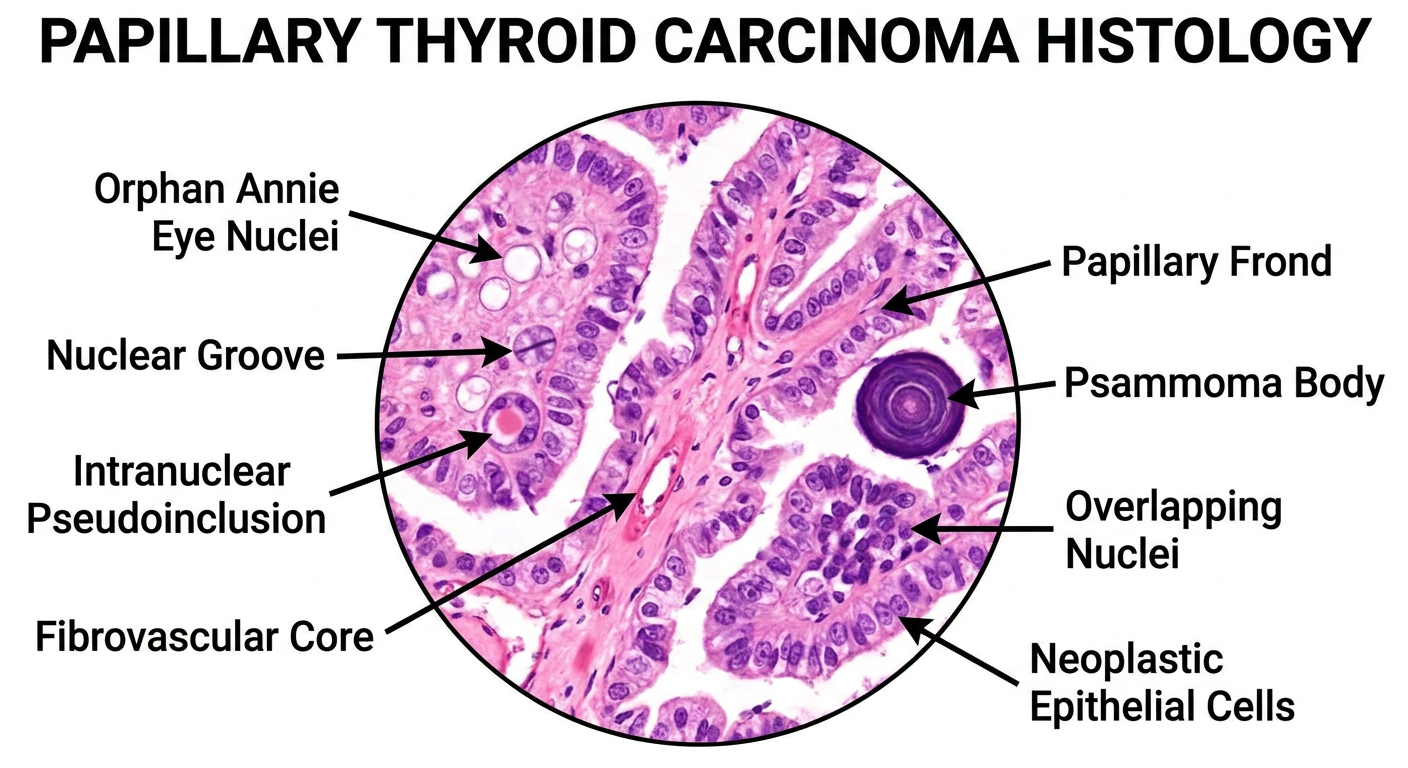
- Orphan Annie Eye Nuclei - the hallmark optically clear, ground-glass nuclei (due to dispersed chromatin)
- Nuclear Grooves - longitudinal folds in the nuclear membrane, pathognomonic for PTC
- Intranuclear Pseudoinclusions - cytoplasmic invaginations into the nucleus
- Fibrovascular Core - the central stalk supporting each papillary frond
- Papillary Fronds - finger-like projections lined by neoplastic epithelium
- Psammoma Bodies - concentric laminated calcifications (~50% of cases)
- Overlapping Nuclei - crowded, irregularly spaced nuclei
i have pathology exam tomorrow on thyroid and it's various disease. make me note about important topic
🧠 THYROID PATHOLOGY - EXAM NOTES
Source: Robbins & Kumar Basic Pathology
1. NORMAL THYROID - QUICK RECAP
- Follicles lined by cuboidal to low columnar epithelial cells synthesizing thyroglobulin
- Colloid = iodinated thyroglobulin stored in follicular lumen
- Axis: Hypothalamus → TRH → Pituitary → TSH → Thyroid → T3/T4
- T4 converted to T3 in periphery (T3 is 10x more active)
- T3/T4 increase basal metabolic rate
2. HYPERTHYROIDISM (THYROTOXICOSIS)
Causes (in order of frequency):
| Cause | Notes |
|---|---|
| Graves disease | ~85% of cases; autoimmune |
| Toxic multinodular goiter | Hyperfunctioning nodules |
| Toxic adenoma | Single hyperfunctioning nodule |
| Thyroiditis | Transient thyrotoxicosis from follicle rupture |
| TSH-secreting pituitary adenoma | Rare |
Clinical Features:
- Skin: warm, soft, flushed; heat intolerance; sweating
- GI: hypermotility, diarrhea, malabsorption
- Cardiac: tachycardia, palpitations, AF in elderly; high-output cardiac failure
- Musculoskeletal: proximal muscle weakness, tremor, osteoporosis
- Neuro: anxiety, emotional lability, fine tremor
- Eye (Graves-specific): exophthalmos (proptosis) due to orbital fibrosis and fat deposition
- Thyroid storm = severe life-threatening exacerbation: fever, tachycardia, hypotension, altered consciousness
3. HYPOTHYROIDISM
Causes:
| Cause | Notes |
|---|---|
| Hashimoto thyroiditis | Most common in iodine-sufficient areas |
| Iodine deficiency | Most common worldwide |
| Surgical/radioiodine ablation | Post-treatment |
| Congenital (cretinism) | Neonatal - developmental |
| Secondary | Pituitary or hypothalamic failure |
Clinical Features:
- Cretinism (congenital): short stature, mental retardation, coarse facial features, protuberant abdomen, umbilical hernia, macroglossia
- Myxedema (adult): non-pitting edema (accumulation of glycosaminoglycans in skin/tissues), fatigue, cold intolerance, constipation, bradycardia, weight gain, hoarse voice
- Myxedema coma: life-threatening; hypothermia, hypotension, respiratory depression
4. THYROIDITIS
A. HASHIMOTO THYROIDITIS ⭐ (Most Important!)
| Feature | Detail |
|---|---|
| Type | Autoimmune (type IV + II hypersensitivity) |
| Epidemiology | Most common thyroiditis; middle-aged women |
| Antibodies | Anti-TPO (anti-thyroid peroxidase) - most sensitive; anti-thyroglobulin |
| Genetics | CTLA4 polymorphisms; 40% concordance in monozygotic twins |
- Autoreactive CD4+ T cells activate cytotoxic CD8+ T cells → kill thyrocytes
- IFN-γ recruiting macrophages → follicle destruction
- Antithyroid antibodies → ADCC + complement
- Diffuse symmetric enlargement
- Dense lymphocytic infiltrate + well-formed germinal centers
- Follicle atrophy + Hurthle (oxyphil) cell metaplasia (abundant eosinophilic granular cytoplasm due to mitochondria)
- Increased interstitial fibrosis
- Painless goiter → slow hypothyroidism
- May have transient hashitoxicosis first (follicle rupture releases T3/T4)
- Increased risk of B-cell non-Hodgkin lymphoma (thyroid primary)
- Possible increased risk of papillary carcinoma
B. SUBACUTE GRANULOMATOUS (DE QUERVAIN) THYROIDITIS
| Feature | Detail |
|---|---|
| Cause | Viral (post-URTI) |
| Epidemiology | 30-50 years, F > M |
| Course | Self-limiting (unlike Hashimoto) |
| Pain | PAINFUL thyroid - key distinguishing feature |
- Firm gland
- Disrupted follicles with giant cell granulomas around extravasated colloid
- Resolves with fibrosis then regeneration
- Hyperthyroid (follicle destruction → hormone release)
- Euthyroid
- Transient hypothyroid
- Recovery (euthyroid)
C. RIEDEL THYROIDITIS (Fibrous Thyroiditis)
- Rare; dense fibrous replacement of thyroid + invasion of adjacent structures
- Can mimic carcinoma clinically (stony hard, fixed mass)
- Associated with IgG4-related disease
- May cause tracheal/esophageal compression
5. GOITER
| Type | Notes |
|---|---|
| Diffuse nontoxic goiter | Iodine deficiency; TSH-driven diffuse hyperplasia; euthyroid |
| Multinodular goiter | Repeated cycles of hyperplasia/involution; heterogeneous nodules; may become toxic (Plummer disease) |
- Multiple nodules of varying size, some with colloid, some with fibrosis/calcification
- Nodules lack a complete fibrous capsule (unlike adenoma)
6. THYROID TUMORS
A. FOLLICULAR ADENOMA
- Solitary, encapsulated, well-differentiated
- Cold nodule on radionuclide scan (usually)
- Hot nodule = toxic adenoma (may cause hyperthyroidism)
- Morphology: well-formed follicles, intact fibrous capsule
- Key point: capsular integrity must be assessed to exclude malignancy - hence surgical excision required
B. PAPILLARY THYROID CARCINOMA (PTC) ⭐
- Most common thyroid cancer (>85%)
- Female predominance in young/middle-aged
- Associated with radiation exposure in childhood
- BRAF V600E mutation (~60%) - activates MAP kinase pathway
- RET/PTC rearrangements (10-20%) - radiation-associated
- NTRK rearrangements
| Feature | Description |
|---|---|
| Orphan Annie Eye Nuclei | Optically clear, ground-glass chromatin - pathognomonic |
| Nuclear grooves | Longitudinal folds in nuclear membrane |
| Intranuclear pseudoinclusions | Cytoplasmic invagination into nucleus |
| Papillary fronds | Finger-like projections with fibrovascular cores |
| Psammoma bodies | Concentric laminated calcifications (~50%) |
| Nuclear overlap | Crowded, overlapping irregular nuclei |
Nuclear triad = grooves + pseudoinclusions + Orphan Annie = DIAGNOSTIC (even without papillary architecture)
- Usually presents as solitary painless thyroid nodule
- Spread: lymphatic (cervical lymph nodes) - EARLY
- Cold nodule on scan
- Excellent prognosis; 10-year survival >95%
| Variant | Notes |
|---|---|
| Follicular variant | Follicular architecture + PTC nuclei; same prognosis as classic |
| Tall cell variant | >50% tall cells; more aggressive |
| Diffuse sclerosing variant | Diffuse involvement + heavy fibrosis; younger patients |
C. FOLLICULAR THYROID CARCINOMA (FTC)
- 5-15% of thyroid cancers
- More common in iodine-deficient areas
- Molecular: RAS mutations, PAX8-PPARγ fusion
- Capsular invasion and/or vascular invasion = malignancy
- Fine needle aspiration cannot distinguish adenoma from carcinoma (need full capsule assessment)
D. ANAPLASTIC (UNDIFFERENTIATED) THYROID CARCINOMA
- <5% of thyroid cancers but most lethal
- Occurs in elderly patients (usually >60 years)
- May arise from dedifferentiation of PTC or FTC
- Molecular: TP53 mutations + prior mutations (BRAF/RAS)
- Pleomorphic giant cells, spindle cells, squamoid cells
- Extensive necrosis and mitosis
- Invades adjacent structures (trachea, esophagus, vessels)
- Rapidly enlarging, fixed, hard neck mass
- Median survival: 3-6 months; nearly universally fatal
E. MEDULLARY THYROID CARCINOMA (MTC)
- 5% of thyroid cancers
- Derived from parafollicular C cells (NOT follicular epithelium)
- Secretes calcitonin (tumor marker)
- 25% familial - associated with MEN 2A and MEN 2B (RET mutations)
- Solid nests/sheets of polygonal to spindle cells
- Amyloid deposits in stroma (derived from calcitonin precursors) - Congo red stain positive
- No follicles
- MEN 2A: MTC + pheochromocytoma + parathyroid hyperplasia
- MEN 2B: MTC + pheochromocytoma + mucosal neuromas + marfanoid habitus
- Screen family members with RET mutation testing
7. QUICK COMPARISON TABLE - THYROID CANCERS
| Feature | PTC | FTC | Anaplastic | MTC |
|---|---|---|---|---|
| Frequency | >85% | 5-15% | <5% | 5% |
| Origin | Follicular cells | Follicular cells | Follicular cells | C cells |
| Spread | Lymphatic | Hematogenous | Local + both | Lymphatic |
| Marker | None | None | None | Calcitonin |
| Key mutation | BRAF V600E | RAS, PAX8-PPARγ | TP53 | RET |
| Prognosis | Excellent | Good-fair | Lethal | Intermediate |
| Special feature | Psammoma bodies | Capsular invasion | Rapidly fatal | Amyloid stroma |
8. HIGH-YIELD EXAM MNEMONICS
- "PTC = Papillary = Psammoma bodies + Prognosis good"
- "FTC = Follicular = Far spread (hematogenous) + FNA useless"
- "ATC = Anaplastic = Always fatal"
- "MTC = Medullary = MEN + Marker (calcitonin) + Amyloid"
- Hashimoto = Hurthle cells + High Ab (anti-TPO) + Hypothyroid
- De Quervain = De-structive + Painful + Post-viral + Granulomas
- BRAF V600E = most common mutation in PTC (60%)
- Cold nodule = more likely malignant; Hot nodule = usually benign
what is hot and Cold nodule
thyroid hot cold nodule radionuclide scan scintigraphy
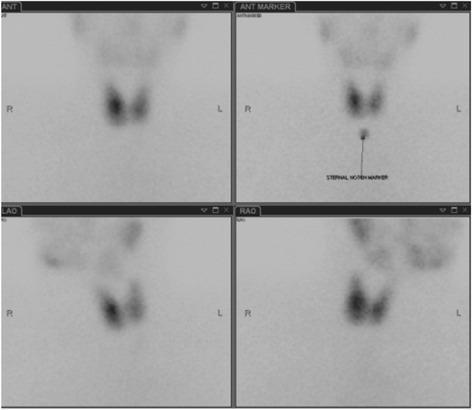
This diagnostic image set displays a radionuclide thyroid scintigraphy (Technetium-99m scan) of a human thyroid gland, presented in four distinct views: Anterior (ANT), Anterior with Marker (ANT MARKER), Left Anterior Oblique (LAO), and Right Anterior Oblique (RAO). The scan shows a normal-sized, bilobed thyroid gland with a characteristic butterfly shape. There is a diffuse and homogeneous distribution of radiotracer uptake throughout both the right and left lobes, with no focal 'hot' (hyperfunctioning) or 'cold' (non-functioning) nodules detected. In the 'ANT MARKER' panel, a 'STERNAL NOTCH MARKER' is positioned inferiorly to provide an anatomical reference for the gland's position in the neck. The images also demonstrate physiological tracer accumulation in the salivary glands and oral cavity, visible superior to the thyroid. This scintigraphic study is used to evaluate thyroid morphology and functional status, particularly in the clinical context of hyperthyroidism or thyroiditis.
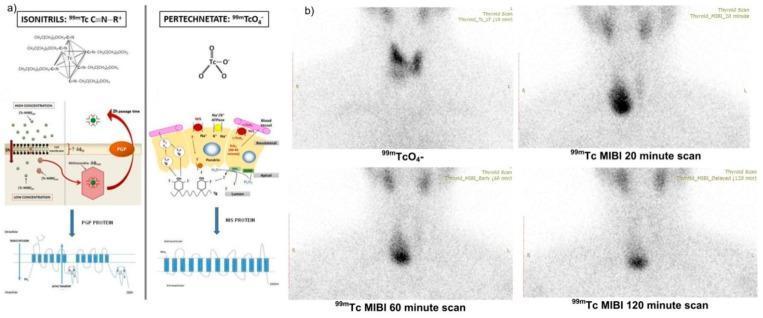
This composite educational image illustrates the pathophysiology and diagnostic imaging of thyroid nodules using dual-tracer scintigraphy. Panel (a) contains diagrams of the molecular structures of Isonitrils (99mTc-MIBI) and Pertechnetate (99mTcO4−) alongside cellular models showing their uptake mechanisms: pertechnetate via the Sodium/Iodide Symporter (NIS) and MIBI through mitochondrial trapping and P-glycoprotein (PGP) efflux. Panel (b) presents clinical nuclear medicine scans of a 42-year-old female. The 99mTcO4− scan shows a 'cold' nodule in the right thyroid lobe with significantly decreased radiotracer uptake compared to the normal left lobe. Sequential 99mTc-MIBI scans at 20, 60, and 120 minutes demonstrate 'mismatch' physiology: the nodule appears 'hot' with intense, progressive radiotracer retention and reduced efflux over time. This mismatch pattern (pertechnetate-cold/MIBI-hot with delayed retention) is a high-risk indicator for malignancy, such as Hurthle cell or papillary thyroid carcinoma, reflecting active mitochondrial metabolism and potential PGP pump dysfunction.
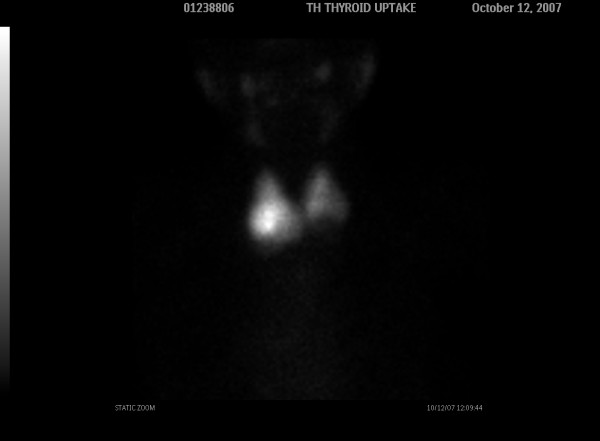
**Imaging Modality:** Nuclear medicine radionuclide scan (Thyroid Scintigraphy) using Technetium-99m (99mTc) pertechnetate. **Anatomical Region:** Anterior view of the neck demonstrating the thyroid gland. **Observed Pathology:** Focal area of decreased radionuclide uptake (photopenia) located in the inferior pole of the left thyroid lobe. **Characteristic Visual Features:** * **Thyroid Morphology:** The right thyroid lobe and superior portion of the left lobe demonstrate relatively homogenous tracer distribution. * **Cold Nodule:** A well-defined "cold" or non-functioning nodule is visible at the lower aspect of the left lobe, characterized by a lack of tracer accumulation compared to the surrounding functional thyroid parenchyma. * **Salivary Glands:** Incidental visualization of tracer uptake in the submandibular and parotid glands is noted superiorly, consistent with normal biodistribution. **Key Diagnostic Features:** The presence of a solitary cold nodule on a 99mTc thyroid scan is a critical finding for evaluating thyroid pathology, as it indicates a focal region of suppressed biochemical activity or replaced thyroid tissue. This finding necessitates further clinical correlation, typically via ultrasonography and fine-needle aspiration biopsy (FNAB).
Hot vs. Cold Thyroid Nodule
The Basic Concept
| Term | Uptake | Function | Appearance on Scan |
|---|---|---|---|
| Hot Nodule | MORE than surrounding tissue | Hyperfunctioning | Bright/dark area = more radiotracer concentration |
| Warm Nodule | SAME as surrounding tissue | Normal functioning | Same intensity as rest of gland |
| Cold Nodule | LESS than surrounding tissue | Hypofunctioning / non-functioning | Pale/blank area = photopenia (tracer void) |
Cold Nodule
- ~10% of cold nodules are malignant
- All thyroid cancers except MTC can be PTC, FTC, or anaplastic - all non-functioning
- A cold nodule does NOT mean cancer - most (90%) are benign (cysts, colloid nodules, fibrosis, Hashimoto-related)
- Thyroid cyst (most common benign cause)
- Colloid nodule / adenomatous nodule
- Thyroid carcinoma (PTC, FTC, anaplastic)
- Focal thyroiditis
- Hemorrhage into a nodule
Hot Nodule
- Hot nodules are almost never malignant - this is a key exam fact
- They are usually toxic adenomas (Plummer disease) causing hyperthyroidism
- Toxic (hyperfunctioning) adenoma - single nodule
- Toxic multinodular goiter - multiple hot nodules
- Early Graves disease occasionally
Scan Image: Cold Nodule
Key Exam Points to Remember
| Point | Detail |
|---|---|
| Hot nodule = malignant? | Almost NEVER (rarely malignant) |
| Cold nodule = malignant? | 10% chance - needs FNA |
| Most cold nodules are... | Benign (cysts, colloid nodules) |
| Radioisotope used | Tc-99m pertechnetate or ¹²³I |
| Best test to evaluate cold nodule | Ultrasound + FNA biopsy |
| Role of scintigraphy today | Best for evaluating hyperthyroidism (to distinguish Graves vs toxic adenoma vs toxic MNG) |
| FDG-PET avid nodule | 33% risk of malignancy - needs US + FNA |
A simple memory trick: "Cold = Concerning; Hot = Harmless" (with respect to malignancy)
can you teach me x-ray
What aspect of X-ray do you want to learn? · What is your current level?
chest X-ray consolidation pneumonia pathology patterns
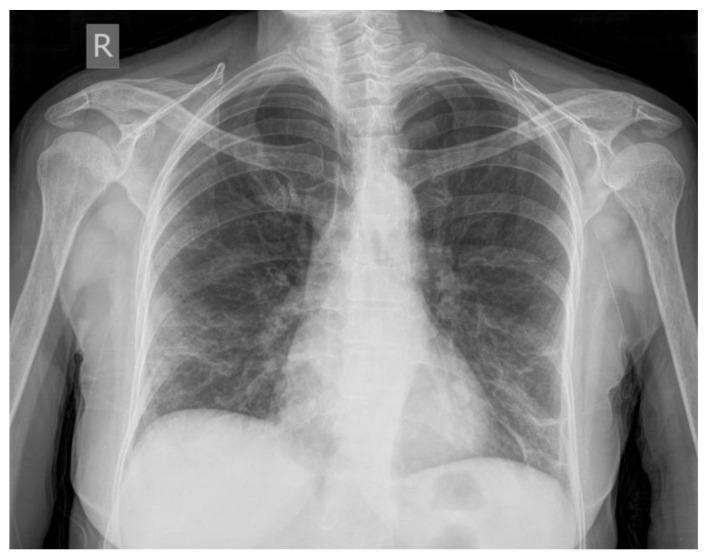
This anterior-posterior (AP) chest X-ray illustrates typical radiological findings of bilateral COVID-19 pneumonia. The primary pathology consists of diffuse 'ground-glass opacities' and areas of consolidation distributed throughout the lung fields. The infiltrates are predominantly located in the lower lobes and peripheral/subpleural regions of both the left and right lungs. Reticulonodular changes and interstitial infiltrative patterns are visible, especially within the areas of consolidation in the basal regions. The cardiac silhouette and mediastinal contours appear within normal limits, while the diaphragmatic domes are distinct. The presence of these confluent, bilateral lower lung opacities is highly characteristic of acute viral pneumonia, such as that caused by SARS-CoV-2. This diagnostic image serves as a clinical example of early-stage hospitalization findings in patients with extensive pulmonary involvement.
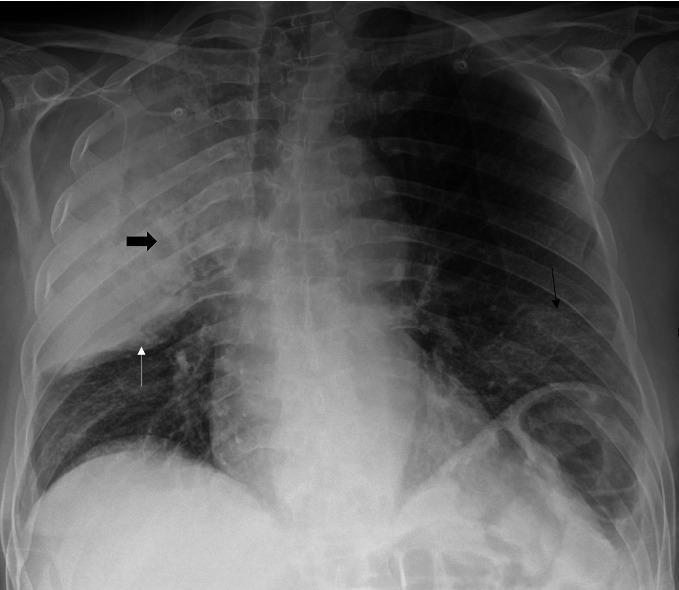
This chest X-ray in anteroposterior (AP) projection demonstrates multi-focal pulmonary pathology. The primary finding is a dense consolidation of the right upper lobe (RUL), characterized by a notable 'bulging fissure' sign where the horizontal fissure (marked by a thin white arrow) is displaced inferiorly, suggesting an expansive inflammatory process such as Klebsiella or Legionella pneumonia. Within the RUL consolidation, a thick black arrow points to an area of radiolucency representing pulmonary cavitation. Additionally, the image shows bilateral lower zone ground-glass opacities (indicated by a thin black arrow in the left lung base), manifesting as hazy increased density that does not fully obscure pulmonary vasculature. This combination of dense, cavitating lobar consolidation and diffuse ground-glass opacities is clinically significant for severe community-acquired or atypical pneumonia, potentially occurring in the context of co-infections such as SARS-CoV-2 and Legionella pneumophila. Educational value lies in identifying the bulging fissure sign, recognizing cavitary lesions on plain film, and distinguishing lobar consolidation from diffuse ground-glass patterns.
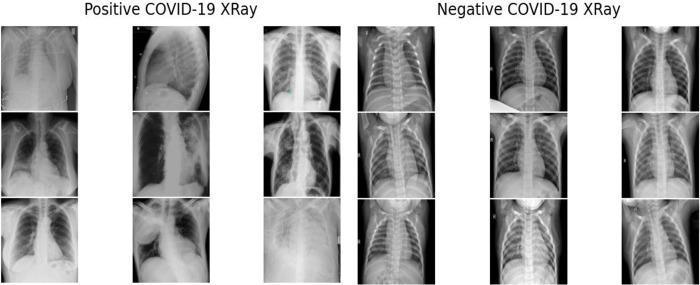
A comparison chart of chest x-ray (CXR) radiography samples, organized into two columns: 'Positive COVID-19 XRay' and 'Negative COVID-19 XRay.' The visual demonstrates the key diagnostic findings associated with viral pneumonia. The positive samples exhibit varying degrees of pulmonary pathology, including bilateral, patchy ground-glass opacities (GGO), reticular patterns, and areas of dense airspace consolidation, often with a peripheral or lower lobe predominance. These findings appear as hazy, white densities that obscure normal lung markings. In contrast, the negative COVID-19 samples show clear lung fields, well-defined costophrenic angles, and visible bronchovascular markings without evidence of acute infiltrates or consolidation. The image serves as an educational tool for identifying radiological manifestations of COVID-19 infection, specifically emphasizing the difference between normal thoracic anatomy and common patterns of pulmonary inflammation and alveolar filling observed in viral respiratory distress.
pleural effusion chest X-ray blunting costophrenic angle
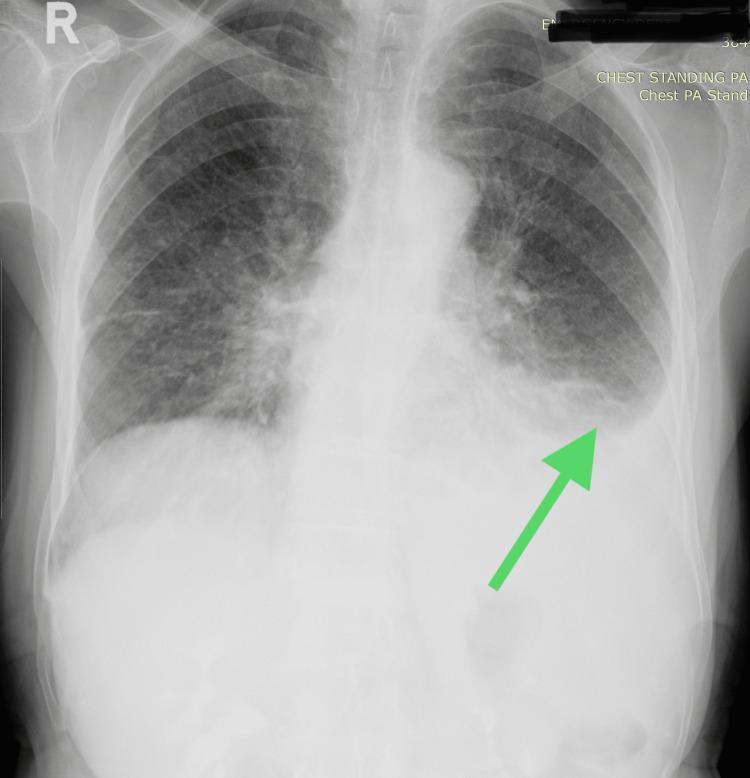
A posterior-anterior (PA) chest X-ray demonstrating a left-sided pleural effusion. The primary finding, indicated by a green arrow, is an area of increased homogenous radiopacity in the lower left lung field. This opacity causes blunting of the left costophrenic angle and exhibits a characteristic meniscus sign—a curved upper border that tracks superiorly along the lateral chest wall. In contrast, the right lung field appears clear with a sharp costophrenic angle and visible vascular markings. The mediastinal shadow is central, and the visualized bony structures, including the ribs and clavicles, are shown. In the clinical context of multiple myeloma, this exudative effusion and the subtle lucencies in the visualized humerus and scapula are significant for systemic disease involvement. This diagnostic image is intended for medical students and clinicians to illustrate radiographic signs of pleural fluid accumulation and associated musculoskeletal complications in plasma cell dyscrasias.
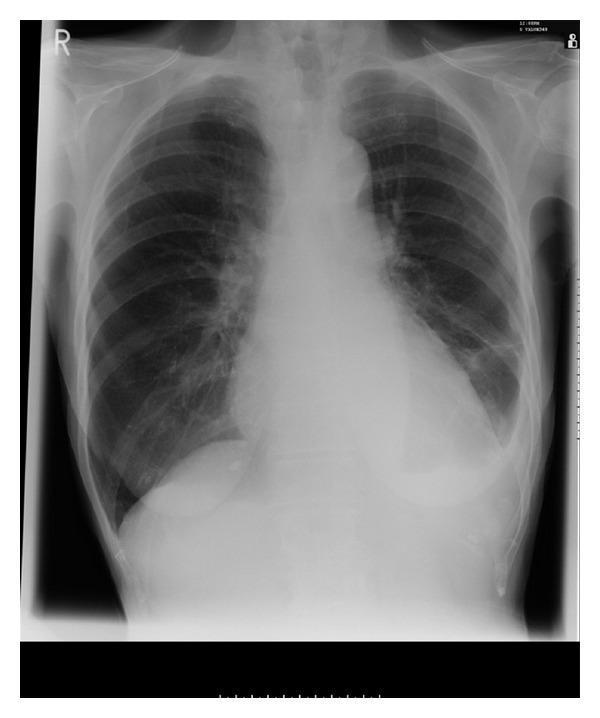
This diagnostic image is an anterior-posterior (AP) chest X-ray demonstrating bilateral pleural effusions. The most prominent radiographic feature is the presence of increased basal opacities with associated blunting of the costophrenic angles, characteristic of fluid accumulation in the pleural space. The effusion is more pronounced on the left side, where the meniscus sign is visible against the lateral chest wall, partially obscuring the left cardiac border and the left hemidiaphragm. The right costophrenic angle also shows moderate blunting. The heart silhouette appears slightly enlarged or obscured by the surrounding pleural fluid. The upper and middle lung fields remain relatively clear without evidence of focal consolidation, masses, or pneumothorax. The mediastinum is centrally positioned. The bony thorax, including the ribs and clavicles, appears intact. This image illustrates a common manifestation of systemic or pulmonary disease and serves as an educational example of how pleural fluid alters normal thoracic landmarks on plain film radiography.
pneumothorax chest X-ray collapsed lung absent lung markings
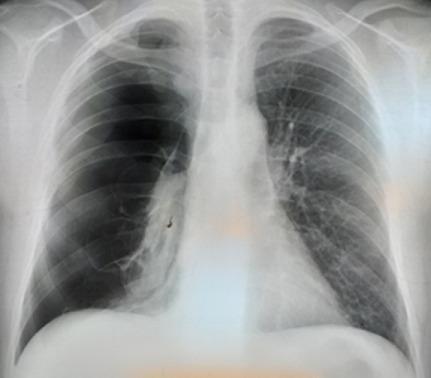
A posterior-anterior (PA) chest X-ray demonstrating a large, total right-sided pneumothorax. The right hemithorax shows marked hyperlucency with a complete absence of bronchovascular lung markings between the chest wall and the visceral pleural line. The right lung is collapsed toward the hilum, appearing as a dense, shrunken radiopaque mass medial to the pleural space. There is a visible sharp visceral pleural edge. The mediastinum remains relatively midline without significant deviation, suggesting the absence of immediate tension physiology at the time of imaging. In contrast, the left lung exhibits normal expansion, normal radiodensity, and preserved vascular markings extending to the periphery. The diaphragm on the right appears slightly flattened compared to the left. This diagnostic image illustrates a common complication of underlying pulmonary emphysema, serving as a classic representation of spontaneous pneumothorax for medical students and clinicians.
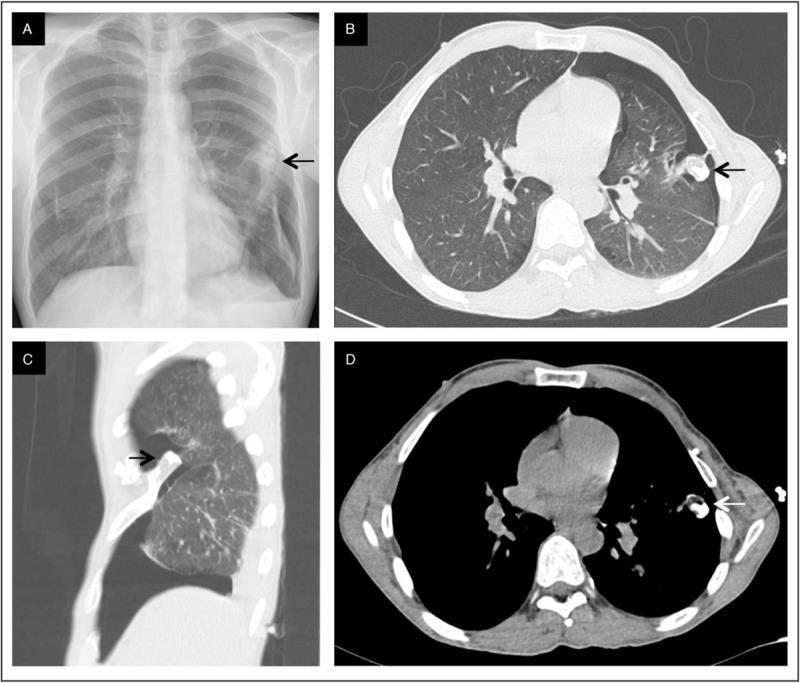
This composite figure presents a radiographic and tomographic evaluation of a 32-year-old male with spontaneous pneumothorax and hereditary multiple exostoses (HME). Panel A is a posteroanterior (PA) chest X-ray demonstrating a left-sided pneumothorax, characterized by a visible visceral pleural line and peripheral radiolucency with absent lung markings. A focal opacity is noted near the left fifth rib. Panels B-D provide axial (B, D) and sagittal (C) CT imaging of the chest. The axial lung window (B) confirms the left pneumothorax and reveals underlying apical paraseptal emphysema. The bone and soft tissue windows (C, D) highlight a prominent intrathoracic rib exostosis (osteochondroma) arising from the anterior arch of the left fifth rib (black and white arrows). The sagittal reconstruction (C) clearly shows the bony protrusion extending into the pleural space, making direct contact with the collapsed lung parenchyma. This suggests a mechanical etiology for the pneumothorax related to the costal exostosis. Target audience: medical students and radiologists.
cardiomegaly enlarged heart chest X-ray cardiac silhouette
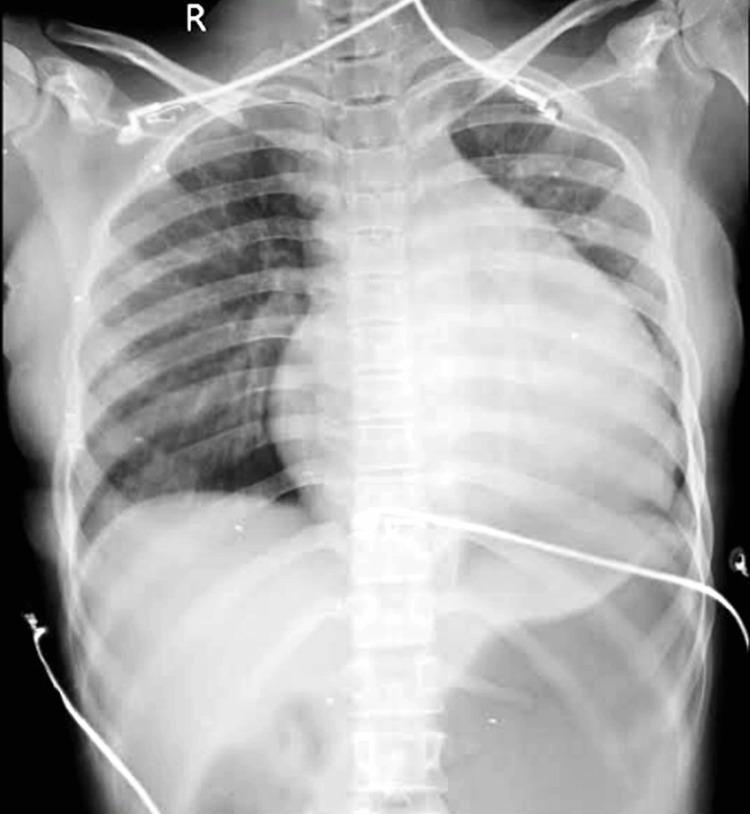
A frontal (anteroposterior) chest X-ray demonstrating a significantly enlarged cardiac silhouette, characteristic of severe cardiomegaly. The heart displays a globular or 'water-bottle' configuration, often associated with a large pericardial effusion. The cardiothoracic ratio is markedly increased, with the silhouette extending significantly toward the left thoracic wall. Pulmonary vascular markings appear somewhat obscured by the enlarged heart, although the lung fields are visible. Several radiopaque medical devices are present, including ECG leads and tubing overlying the chest and abdomen. An 'R' marker is visible in the upper right field. This image is clinically relevant for demonstrating the radiographic presentation of cardiomegaly and assessing for underlying conditions such as heart failure or pericardial tamponade.
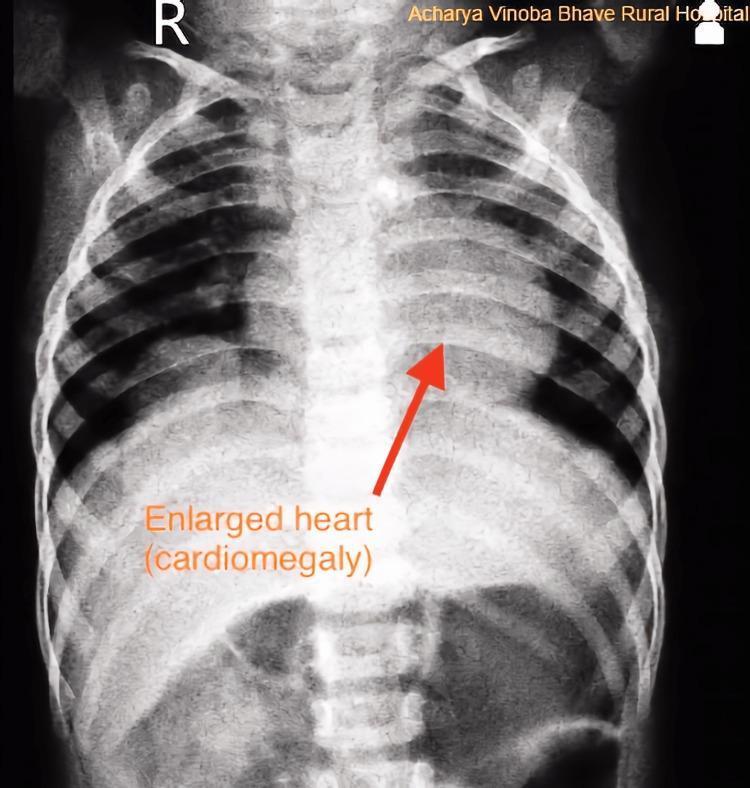
This diagnostic image is an anterior-posterior (AP) chest X-ray of a pediatric patient, showing significant cardiomegaly. The cardiac silhouette is markedly enlarged, with the cardiothoracic ratio exceeding 0.5. The enlargement is particularly prominent in the region of the left ventricle and left atrium, which causes displacement and relative crowding of the adjacent pulmonary structures. An orange arrow and text label specifically point to the left cardiac border to highlight the 'Enlarged heart (cardiomegaly)'. The bony structures, including the ribs and spine, are visible, and the diaphragm appears somewhat flattened due to the increased heart size. The imaging demonstrates the typical radiological presentation of volume overload or congenital cardiac anomalies, such as a patent ductus arteriosus (PDA) or persistent left superior vena cava, which can lead to progressive chamber dilation.
pulmonary edema Kerley B lines interstitial chest X-ray
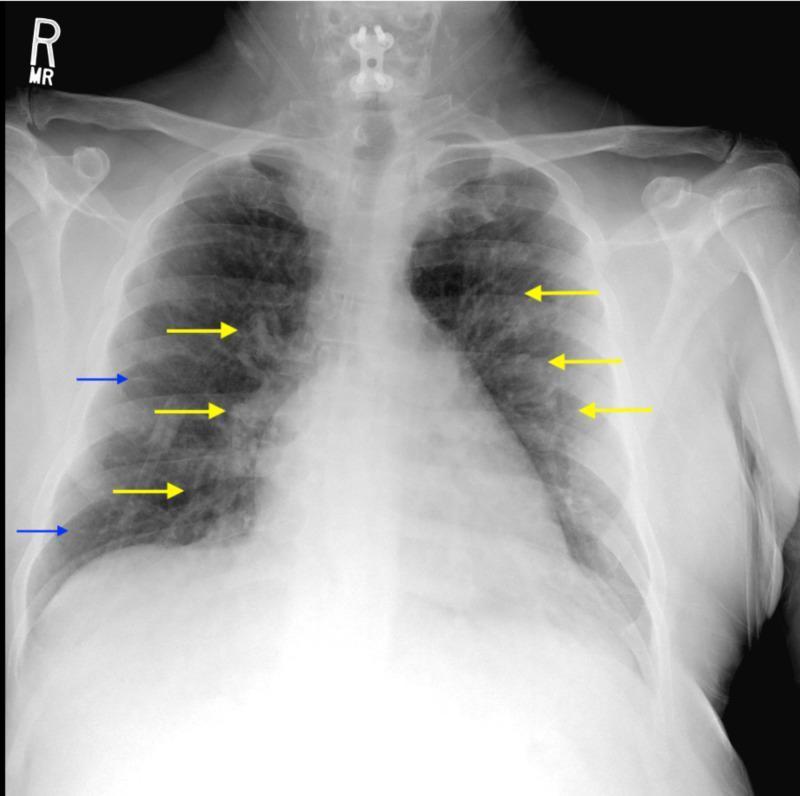
Anteroposterior (AP) chest X-ray demonstrating classic radiographic features of pulmonary interstitial edema and vascular congestion. The image shows a diffuse, bilateral increase in pulmonary opacification with a hazy 'bat-wing' distribution most prominent in the perihilar regions. Yellow arrows indicate perihilar vascular prominence and congestion, reflecting increased pulmonary venous pressure. Blue arrows highlight Kerley B lines—short, horizontal, peripheral opacities located near the costophrenic angles—which represent thickened interlobular septa due to fluid accumulation. The cardiac silhouette appears slightly enlarged, and the lung markings are obscured by the interstitial infiltrates. This diagnostic image is significant for teaching the clinical presentation of congestive heart failure or fluid overload in a medical setting, emphasizing the distinction between interstitial and alveolar patterns of edema.
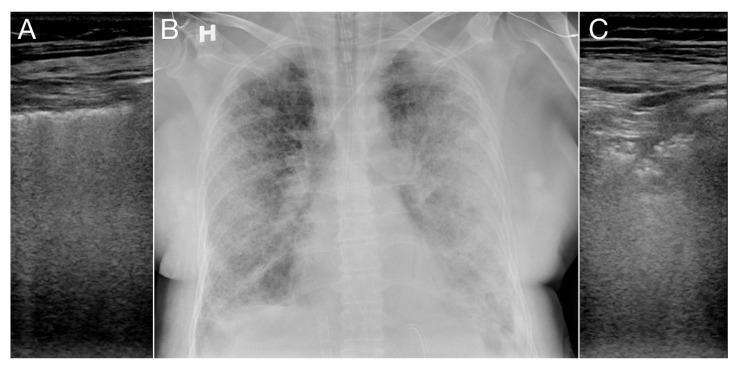
This composite diagnostic image features three panels comparing lung ultrasound (LUS) and chest X-ray findings in a patient with severe pulmonary pathology. Panel A is a lung ultrasound (lateral view) demonstrating interstitial edema, characterized by numerous, dense, hyperechoic vertical artifacts known as B-lines. These B-lines originate from the pleural line and extend to the bottom of the screen, obscuring normal horizontal A-lines. Panel B is a posterior-anterior chest X-ray showing diffuse bilateral opacities. Correlating with the ultrasound, the right lung shows Kerley B-lines (interstitial edema), while the left lung exhibits more dense subpleural opacities. Panel C is a corresponding lung ultrasound of the left lung showing pulmonary consolidation. This area displays a heterogeneous echotexture with hyperechoic, branching structures consistent with dynamic air-bronchograms within consolidated lung tissue. The image serves as an educational comparison between ultrasound artifacts (B-lines, air-bronchograms) and radiographic manifestations of COVID-19 related interstitial lung disease and consolidation.
lobar consolidation air bronchogram chest X-ray

This diagnostic image is a posterior-anterior (PA) chest x-ray showing significant pulmonary pathology. The primary finding is widespread air-space consolidation manifesting as increased opacity, predominantly localized within the right upper lung field and the left lower lung field. Within these consolidated regions, air bronchograms are clearly visible, appearing as dark, tubular air-filled bronchi outlined by the surrounding high-density fluid or tissue. The mediastinal contour appears stable, and the cardiac silhouette is partially obscured by the adjacent consolidation. While the radiographic pattern is classically suggestive of multi-lobar bacterial pneumonia, in this clinical context, it represents pulmonary metastasis from a grade II chondrosarcoma. The image serves as an educational example of how metastatic disease can radiographically mimic infectious consolidation and the importance of the air bronchogram sign in identifying alveolar filling processes.

Multi-modal diagnostic imaging series illustrating community-acquired lobar pneumonia in a 30-year-old patient. (a) Posterior-anterior chest X-ray shows a clear area of consolidation in the left upper lobe. (b) B-mode lung ultrasound (LUS) reveals a complex, hypoechoic consolidation containing numerous hyperechoic punctate and linear structures, characteristic of a marked air bronchogram. (c-e) Contrast-enhanced ultrasound (CEUS) time-series demonstrates perfusion dynamics: (c) at 13 seconds, there is homogeneous pulmonary arterial enhancement; (d) by 1 minute, significant early washout occurs; (e) by 2 minutes, the washout is more pronounced. This specific CEUS pattern of rapid washout is indicative of pulmonary arterial vasoconstriction, often associated with the Euler–Liljestrand mechanism in response to local hypoxia in consolidated lung tissue. The series serves as an educational example of how multi-phase CEUS can supplement B-mode ultrasound and radiography in characterizing the hemodynamic response of pulmonary parenchyma during inflammatory processes.
🫁 CHEST X-RAY: PATHOLOGY PATTERNS
Intermediate Level - Pattern Recognition Guide
STEP 1 - SYSTEMATIC APPROACH (Always use this!)
| Letter | What to Check |
|---|---|
| A - Airways | Trachea midline? Carina angle? Mainstem bronchi? |
| B - Bones & soft tissue | Rib fractures? Lytic lesions? Soft tissue swelling? |
| C - Cardiac | Size, shape, borders |
| D - Diaphragm | Domes flat/elevated? Costophrenic angles sharp? |
| E - Everything else (lung fields) | Opacities, lucencies, vascular markings, hilar regions |
PA (posteroanterior) = standard upright film. AP (anteroposterior) = bedside/supine - heart appears falsely larger, scapulae overlap lungs.
PATTERN 1 - CONSOLIDATION / AIRSPACE OPACIFICATION
- Homogeneous white opacity replacing normal black lung
- Air bronchogram = dark air-filled bronchi visible within white opacity (because bronchi are open but surrounding alveoli are filled) - this is pathognomonic of airspace disease
- Silhouette sign = loss of normal border (e.g., right heart border lost = right middle lobe consolidation)
| Cause | Clue |
|---|---|
| Pneumonia | Lobar or segmental; +/- air bronchogram; fever/cough |
| Pulmonary edema | Bilateral, perihilar "bat-wing"; Kerley B lines |
| Pulmonary hemorrhage | Rapid change; trauma/vasculitis history |
| Aspiration | Lower lobes; right > left (right main bronchus more vertical) |
| Atelectasis | No air bronchogram; volume loss; shift toward opacity |
Example - Lobar Consolidation with Air Bronchogram:
PATTERN 2 - PLEURAL EFFUSION
- Blunting of costophrenic angle - earliest sign (~200-300 mL needed)
- Meniscus sign - curved upper border of fluid tracking up the chest wall
- Homogeneous opacity with concave upper border
- Large effusion: whole hemithorax whiteout + mediastinal shift AWAY from effusion
- Subpulmonic effusion - fluid under the lung; appears as "elevated hemidiaphragm"
- Both = white hemithorax
- Effusion → trachea/mediastinum shifts away
- Collapse → trachea/mediastinum shifts toward
Example - Pleural Effusion:
PATTERN 3 - PNEUMOTHORAX
- Visceral pleural line - thin white line parallel to chest wall (edge of collapsed lung)
- Absence of lung markings beyond the pleural line (just black)
- Large PTX: lung collapses toward hilum
- All above features PLUS:
- Mediastinal shift AWAY from pneumothorax
- Flattened or inverted hemidiaphragm on affected side
- Tracheal deviation away
Don't wait for CXR if tension PTX is clinically suspected - treat immediately!
Example - Right-sided Pneumothorax:
PATTERN 4 - CARDIOMEGALY
- PA film: heart width / chest width < 0.5
- AP film: can be falsely elevated (use PA for accurate measurement)
| Cause | Clue |
|---|---|
| Dilated cardiomyopathy | Globular heart; pulmonary edema signs |
| Pericardial effusion | "Water-bottle" globular heart; rapid enlargement; no pulmonary edema |
| Hypertensive heart disease | LV enlargement |
| Valvular disease | Specific chamber enlargement patterns |
- Left atrium enlarged: Double right heart border; splaying of carina (>70°); posterior displacement of esophagus on lateral
- Left ventricle enlarged: Boot-shaped heart; elongated left heart border
- Right ventricle enlarged: Upturned cardiac apex; filling of retrosternal space on lateral
Example - Cardiomegaly (water-bottle configuration):
PATTERN 5 - PULMONARY EDEMA
| Stage | Findings |
|---|---|
| Stage 1 - Vascular redistribution | Cephalization - upper lobe veins > lower lobe veins (normally lower > upper) |
| Stage 2 - Interstitial edema | Kerley B lines (short horizontal lines at bases, peripherally), haziness, perihilar haze, bronchial wall thickening ("bronchial cuffing") |
| Stage 3 - Alveolar edema | Bat-wing/butterfly opacity - bilateral perihilar consolidation |
Example - Pulmonary Edema with Kerley B Lines:
PATTERN 6 - COLLAPSE / ATELECTASIS
- Ipsilateral diaphragm elevation
- Trachea/mediastinum pulled toward the collapse
- Narrowing of rib spaces on affected side
- Hilar displacement toward collapse
| Lobe | Key Sign |
|---|---|
| RUL | "Golden S sign" (with central mass) - curved upper fissure + hilar mass |
| RML | Loss of right heart border (silhouette sign); thin triangular opacity on PA |
| RLL | Loss of right hemidiaphragm silhouette; triangular retrocardiac opacity |
| LUL | "Veil-like" hazy opacity over entire left lung; no sharp border |
| LLL | Loss of left hemidiaphragm; triangular opacity behind heart |
PATTERN 7 - PNEUMONIA PATTERNS BY ORGANISM
| Organism | CXR Pattern |
|---|---|
| Streptococcus pneumoniae | Lobar consolidation; air bronchograms; single lobe |
| Klebsiella | RUL consolidation; bulging fissure sign; cavitation common |
| Staphylococcus | Multiple abscesses/cavities; pneumatoceles (in children) |
| TB (primary) | Lower/mid zone consolidation + ipsilateral hilar adenopathy (Ghon complex) |
| TB (post-primary/reactivation) | Upper lobe cavitating lesion; fibrosis; calcification |
| Mycoplasma/Atypicals | Interstitial/patchy bilateral; "worse than it looks clinically" |
| COVID-19/Viral | Bilateral peripheral ground-glass opacities; lower lobe predominance |
| PCP (Pneumocystis) | Bilateral perihilar ground-glass; HIV patient; no effusion |
PATTERN 8 - HILAR CHANGES
- Sarcoidosis - classic bilateral symmetric hilar lymphadenopathy ("potato nodes")
- Lymphoma
- TB
- Pulmonary arterial hypertension (enlarged pulmonary arteries)
- Lung carcinoma (most important!)
- Lymph node metastasis
- TB
- Hilar abscess
SUMMARY QUICK REFERENCE TABLE
| Pattern | Key Sign | Mediastinal Shift | Classic Cause |
|---|---|---|---|
| Consolidation | Air bronchogram | None/mild | Pneumonia |
| Pleural effusion | Meniscus, blunt CP angle | Away (if large) | Heart failure, malignancy |
| Pneumothorax | Visceral pleural line | Away (tension) | Spontaneous, trauma |
| Collapse/Atelectasis | Volume loss signs | Toward | Mucus plug, tumour |
| Pulmonary edema | Kerley B, bat-wing | None | LVF, fluid overload |
| Cardiomegaly | CT ratio >0.5 | None | Cardiomyopathy, effusion |
HIGH-YIELD SIGNS TO MEMORIZE
- Air bronchogram = airspace disease (not collapse or effusion)
- Silhouette sign = localizes consolidation (lost right heart border = RML; lost left heart border = lingula)
- Meniscus sign = pleural effusion
- Visceral pleural line = pneumothorax
- Kerley B lines = interstitial edema / lymphangitis
- Bat-wing = pulmonary edema
- Bulging fissure = Klebsiella pneumonia
- Golden S sign = RUL collapse + central obstructing mass (cancer)
- Cephalization = early pulmonary venous hypertension
take My exam. guve me xray. and i will find diagnosis
chest X-ray pathology case for diagnosis quiz
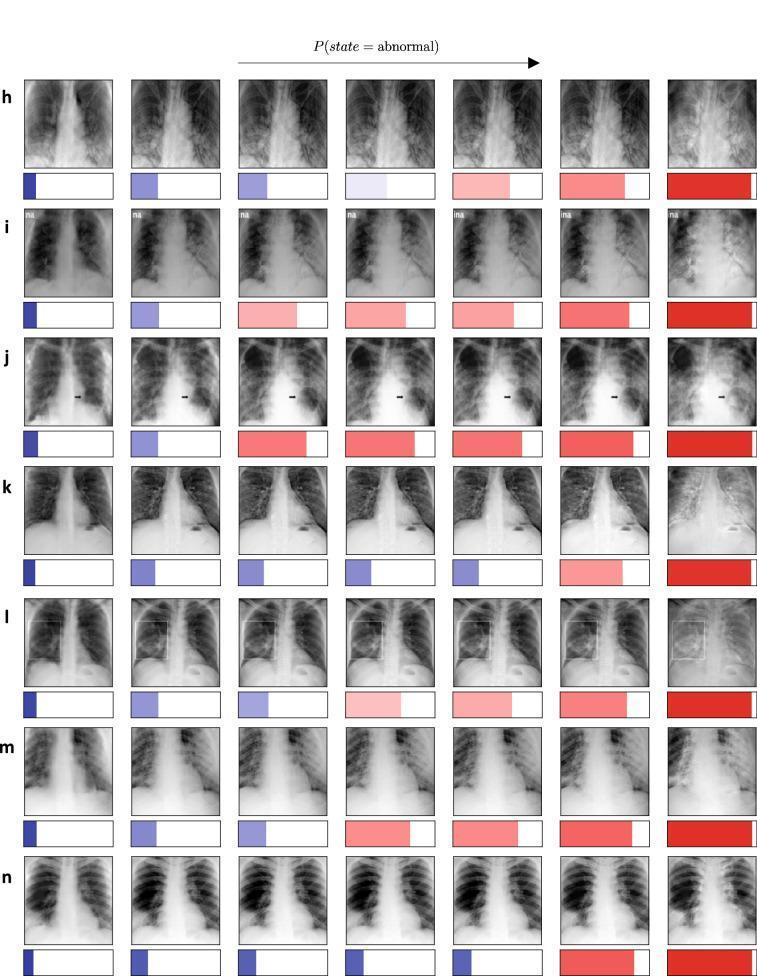
This Comparison Chart illustrates diagnosis-based counterfactual explanations for chest X-ray (CXR) analysis using the TraCE framework. The image is organized into seven horizontal rows (labeled h–n), each representing a unique clinical case. Within each row, a progression of seven CXRs shows a gradual transition from a 'normal' state (left) to an increasingly 'abnormal' state (right). Visually, this progression is marked by the introduction of patchy opacities, infiltrates, and consolidations within the lung fields, simulating the appearance of pneumonia-related pathology. Below each X-ray is a horizontal bar chart indicating the predictive model's confidence level, shifting from blue (low likelihood of abnormality) to red (high likelihood of abnormality). Key landmarks such as the cardiac silhouette, rib cage, and diaphragmatic contours are maintained across each sequence to demonstrate that the model manipulates only relevant diagnostic features rather than changing the anatomical structure. This infographic serves as an educational tool for understanding how deep learning models identify clinical signatures of lung disease.
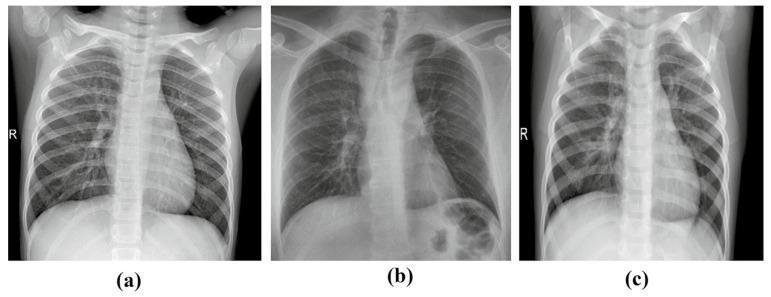
This diagnostic comparison contains three frontal-view chest X-ray radiographs illustrating different clinical conditions: (a) a normal pediatric chest, (b) a COVID-19 case, and (c) a case of bacterial pneumonia. Image (a) demonstrates clear lung fields with normal bronchovascular markings, sharp costophrenic angles, and a distinct heart silhouette. Image (b) shows subtle, patchy opacities and increased interstitial markings characteristic of viral involvement, though the heart and diaphragm remain relatively clear. Image (c) reveals a marked increase in pulmonary opacity and consolidation, particularly in the mid-to-lower lung zones, with obscured diaphragmatic borders indicative of significant fluid or inflammatory exudate. The series serves as a pedagogical tool for distinguishing between healthy respiratory anatomy and different patterns of infectious pulmonary pathology. Visible landmarks across all images include the ribcage, clavicles, spinal column, and cardiac silhouette, providing context for the varying degrees of lung parenchyma lucency and density associated with each diagnosis.
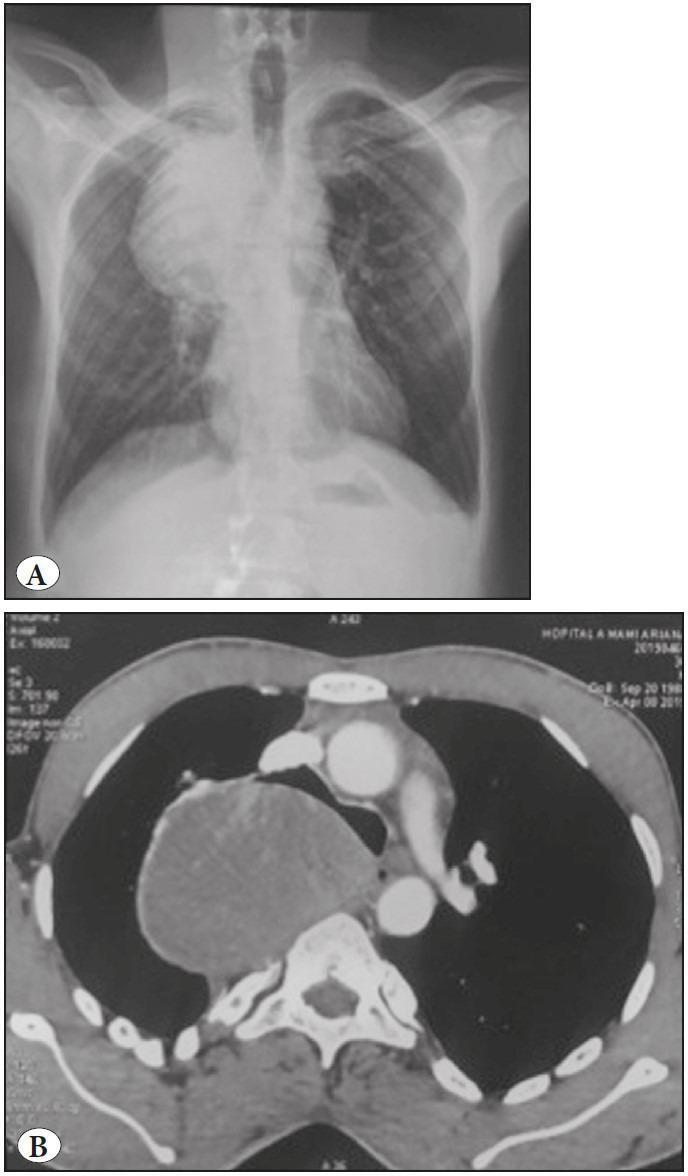
The visual includes two diagnostic images of a chest pathology: Panel A is a posterior-anterior (PA) chest X-ray and Panel B is an axial computed tomography (CT) scan. In the chest X-ray, a prominent, well-defined latero-tracheal radiopaque shadow is visible in the upper right mediastinum, measuring approximately 10 cm in diameter, causing slight tracheal deviation. The axial CT scan with contrast (Panel B) further characterizes this finding as a large, hypoattenuating mass located in the posterior mediastinum. The mass measures approximately 82x68 mm and is in close anatomical contact with the D2 and D4 vertebral bodies. It appears encapsulated and lacks clear signs of costal invasion or significant lymphadenopathy. This visual set is used to demonstrate the diagnostic workup for mediastinal tumors, specifically illustrating the presentation of a bronchogenic cyst that has undergone malignant degeneration. This case provides educational value for thoracic imaging, surgical pathology, and differential diagnosis of mediastinal masses in adult patients.
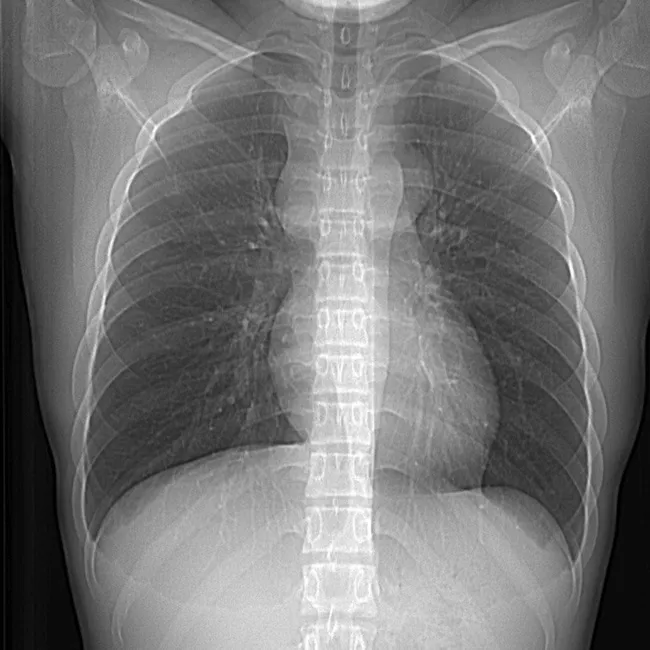
Chest radiograph, pediatric patient, frontal view, single projection. Modality and technique: Chest X-ray (Radiography) performed with standard anteroposterior projection. The mediastinal contours show a rounded, well-defined anterior mediastinal mass projecting over the silhouette. The lesion appears intrathoracic and anterior to the heart, with the descending aorta visible coursing through or behind it, suggesting an anterior mediastinal origin. Cardiomediastinal silhouette mildly displaced but overall within normal size for age. The lungs are perihilar and peripheral fields clear without focal consolidation or effusion. No pneumothorax. The image is compatible with a mediastinal germ cell tumor, specifically a teratoma, given the location and radiographic appearance; however, radiography cannot reliably distinguish histology. In pediatric mediastinal masses, anterior compartment tumors such as thymic lesions, lymphoma and germ cell tumors are in the differential. Radiologic correlation with computed tomography or magnetic resonance imaging is recommended to characterize internal components (fat, calcifications, cystic areas) and assess vascular relations. The case as described corresponds to a mediastinal teratoma, often seen as a rounded, heterogeneous anterior mass that may contain calcifications and fat-density elements. Diagnosis has clinical relevance for surgical planning and prognosis; pathology typically reveals mature or immature teratomatous elements; treatment is surgical excision. Relevant for radiology education and case-based review.
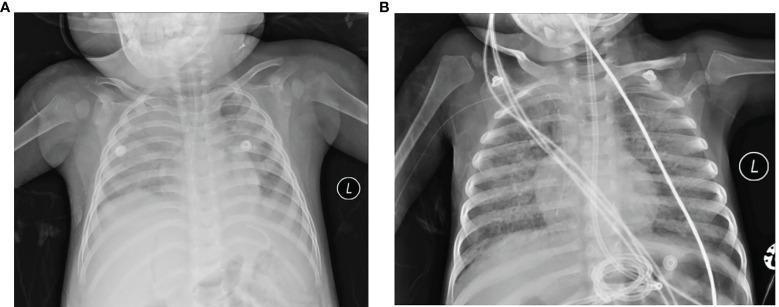
Anteroposterior (AP) chest X-ray radiographs of two pediatric cases demonstrating severe pulmonary pathology in the acute phase of fatal pneumonia. Image (A) shows Case 1, exhibiting thickened, fuzzy lung markings and diffusely reduced light transmittance (increased opacity) in the left lung, resulting in blurring of the left costophrenic angle and diaphragm. The right lung displays unevenly reduced transmittance with patchy infiltrates. Image (B) shows Case 2, presenting with diffuse parenchymal changes and multiple high-density shadows across both lung fields. Visible abnormalities include irregular areas indicative of bronchiectasis and cavitation, particularly prominent in the right middle lobe, alongside small air bubble emphysema. Both images show medical support devices, including ECG leads and external tubing, consistent with a pediatric intensive care unit (PICU) setting. These visuals illustrate the radiological progression and severe lung damage associated with complex pulmonary infections in immunocompromised or critically ill children.
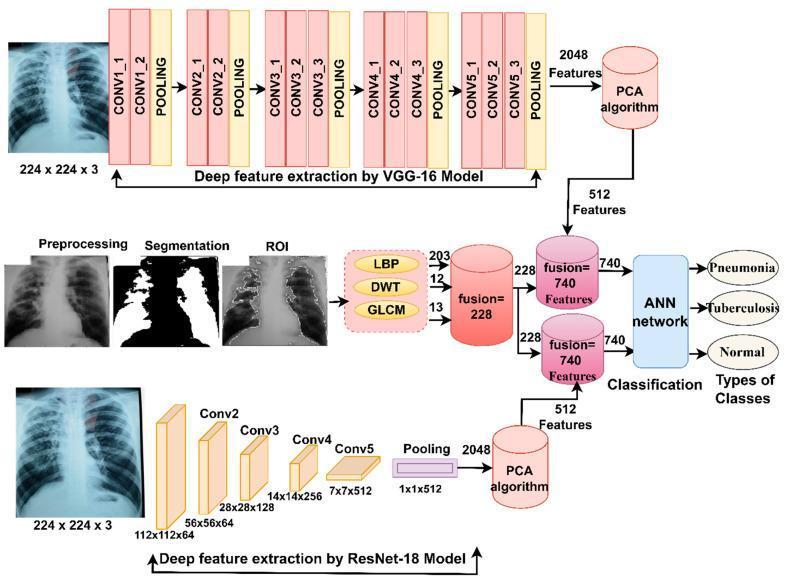
A technical flowchart illustrating a deep learning framework for the automated diagnosis and differential classification of pneumonia, tuberculosis, and normal chest X-rays. The architecture follows a multi-pathway feature extraction approach. Initially, chest X-ray images undergo preprocessing, lung field segmentation, and Region of Interest (ROI) extraction. Hand-crafted features are then extracted using Local Binary Pattern (LBP), Discrete Wavelet Transform (DWT), and Gray-Level Co-occurrence Matrix (GLCM), totaling 228 features. Concurrently, two deep learning pathways extract high-dimensional features (2048 each) via VGG-16 and ResNet-18 architectures. These are reduced to 512 features each using Principal Component Analysis (PCA). The reduced deep features are fused with the 228 hand-crafted features, creating combined feature vectors of 740. These integrated features are fed into an Artificial Neural Network (ANN) classifier to produce the final clinical classification. This methodology highlights the integration of traditional radiomics with modern computer vision for improved diagnostic accuracy in thoracic pathology.
right sided pleural effusion chest X-ray PA view
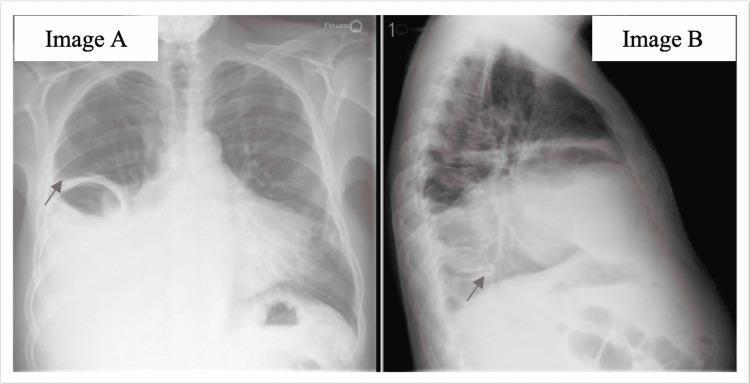
This diagnostic chest x-ray comparison consists of two panels: Image A (Posteroanterior view) and Image B (Lateral view). The imaging demonstrates a large right-sided pleural effusion. In the PA view (Image A), a dense, homogeneous opacity is visible in the lower two-thirds of the right hemithorax, obscuring the right costophrenic angle and hemidiaphragm (silhouette sign). The superior margin of the fluid exhibits a characteristic lateral upward curvature, known as the Meniscus sign (indicated by a red arrow). In the lateral view (Image B), the posterior costophrenic sulcus is obliterated, and the opacity extends anteriorly and superiorly, confirming the volume of the effusion and suggesting underlying compressive atelectasis or consolidation of the right lower lobe. The mediastinal structures show a slight shift toward the contralateral side, consistent with significant fluid accumulation. These radiographic findings are critical for diagnosing pleural space disease and guiding subsequent clinical interventions such as thoracocentesis.
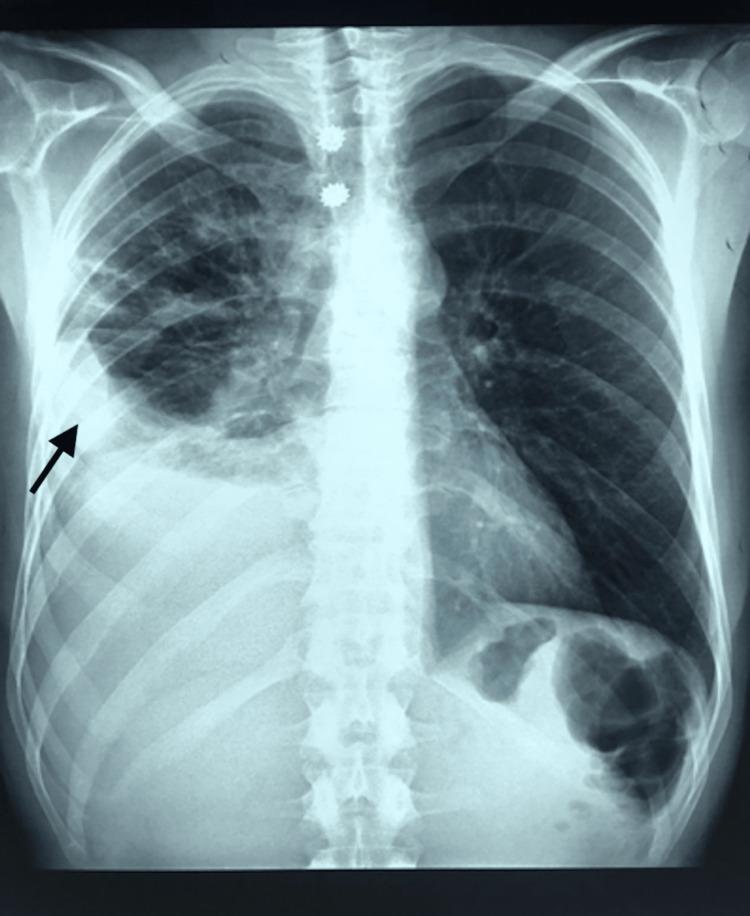
A posterior-anterior (PA) view frontal chest radiograph (X-ray) demonstrating a large unilateral right-sided pleural effusion. The key finding, highlighted by a black arrow, is a dense, homogeneous opacity occupying the lower half of the right hemithorax. This opacity features a characteristic 'meniscus sign,' where the superior border is higher laterally and curves downwards toward the mediastinum. The finding results in complete blunting or obliteration of the right costophrenic angle and obscuration of the right hemidiaphragm silhouette. In contrast, the left lung field is clear with a sharp costophrenic angle and a visible diaphragmatic contour. The mediastinal silhouette and trachea appear centrally positioned without significant deviation. Multiple radiopaque circular artifacts, consistent with ECG monitoring electrodes, are visible overlying the upper thoracic region. This imaging is diagnostic for pleural fluid accumulation, providing an educational example of how large effusions mask normal pulmonary anatomy.
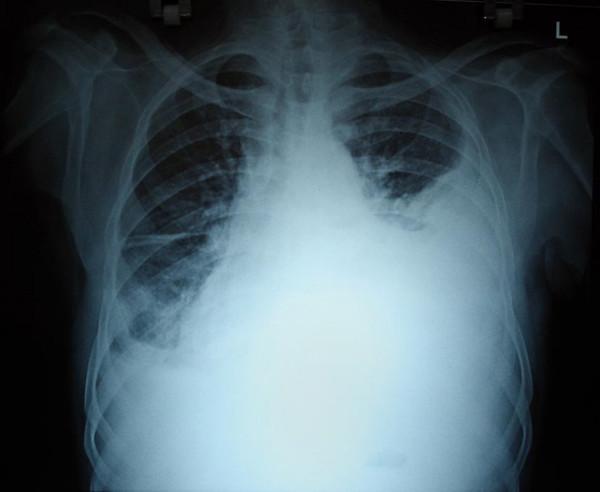
A posterior-anterior (PA) view chest X-ray demonstrating a massive left-sided pleural effusion. The left hemithorax shows extensive, near-complete homogeneous opacification, resulting in the obscuration of the left hemidiaphragm, the cardiac border (silhouette sign), and the costophrenic angle. A clear meniscus sign is visible at the superior margin of the opacity, characteristic of fluid collection in the pleural space. There is significant mass effect evidenced by a contralateral (rightward) shift of the mediastinum and trachea. The right lung appears relatively clear with preserved lung markings and open costophrenic angles, though the lower zone is partially obscured by the mediastinal displacement. This radiographic presentation is typical of a large-volume pleural effusion, which clinically was found to be a hemothorax. The image is an essential educational tool for identifying signs of tension-related fluid accumulation and differentiating massive effusion from total lung collapse.
🩻 CXR EXAM - CASE 1

- What is the main finding on this CXR?
- What is the key radiological sign that confirms your diagnosis?
- Where has the trachea/mediastinum shifted?
- What is your diagnosis?
- Bonus: Name 3 causes of this condition in this clinical context.
u. can't see xray
🩻 CXR EXAM - TEXT-BASED CASE FORMAT
CASE 1 - Ready?
- Dense homogeneous opacity in the lower right hemithorax
- Superior border is higher laterally, curves down medially (concave upper border)
- Right costophrenic angle is completely obliterated
- Right hemidiaphragm is not visible
- Trachea is central (not deviated)
- Left lung is clear
- No air bronchograms within the opacity
- What is the main radiological sign described by the concave upper border?
- What is the diagnosis?
- Why is the trachea not deviated here? (What does that tell you about volume?)
- Bonus: Given the history of malignancy - what is the most likely cause?
i want real picture
🩻 CXR EXAM - CASE 1
- What do you see on the right side of the chest?
- What is the name of the sign indicated by the curved upper border?
- Is the trachea deviated? Which direction?
- What is your diagnosis?
- Bonus: Given malignancy history, what is the likely cause?
pleural effusion?
✅ CORRECT! Well done!
📋 FULL ANSWER - CASE 1
What's on this CXR:
| Question | Answer |
|---|---|
| Main finding | Dense homogeneous white opacity in the right lower hemithorax |
| Key sign | Meniscus sign - the curved upper border, higher laterally, dipping medially = fluid tracking up the chest wall |
| Trachea | Slightly deviated to the LEFT (away from effusion) - indicating significant fluid volume |
| Diagnosis | ✅ Right-sided Pleural Effusion |
| Bonus | In a malignancy patient - most likely malignant pleural effusion (metastatic deposits on pleura → exudate) |
What the black arrow points to:
🩻 CASE 2 - Next one!
- What do you see on the right side?
- What is the specific line you must identify to confirm this diagnosis?
- Is there any mediastinal shift?
- What is your diagnosis?
- Bonus: What type is this - primary or secondary? Why?
pneumothorax
✅ CORRECT AGAIN! 🔥
📋 FULL ANSWER - CASE 2
| Question | Answer |
|---|---|
| Main finding | Right hemithorax completely hyperlucent (black) with NO lung markings |
| Key sign | Visceral pleural line - thin white line parallel to chest wall = edge of collapsed lung |
| Mediastinal shift | Midline / slightly stable - so NOT tension pneumothorax |
| Diagnosis | ✅ Right-sided Pneumothorax (large/total) |
| Bonus | Primary spontaneous PTX - tall thin young male with no underlying disease = classic! (Marfanoid habitus → apical blebs rupture) |
Key teaching point:
Pneumothorax = black (air, no markings) | Effusion = white (fluid) Always look for the visceral pleural line - if you can see it, PTX is confirmed!
🩻 CASE 3 - Harder now!
- What do you see at the lung bases peripherally? (short horizontal lines)
- What is the distribution of the opacity - central or peripheral?
- Is the heart enlarged?
- What is the diagnosis?
- Bonus: What STAGE of this condition does this CXR represent?
congestive cardiac failure?
✅ EXCELLENT! 3/3! 🔥🔥🔥
📋 FULL ANSWER - CASE 3
| Question | Answer |
|---|---|
| Basal lines | Kerley B lines - short horizontal lines at periphery = thickened interlobular septa from fluid |
| Distribution | Perihilar "bat-wing" pattern - central, bilateral |
| Heart size | Enlarged - CT ratio >0.5 = cardiomegaly |
| Diagnosis | ✅ Pulmonary Edema / Congestive Heart Failure |
| Bonus | Stage 2-3 - both interstitial edema (Kerley B) AND alveolar edema (perihilar opacity) present |
Key signs on this CXR:
- 🔵 Kerley B lines at bases (blue arrows)
- 🟡 Perihilar vascular prominence (yellow arrows)
- Bat-wing bilateral central opacity
- Cardiomegaly
Memory trick: In CCF look for ABCDE - Alveolar edema, Bat-wing, Cardiomegaly, Dilatation of upper lobe veins (cephalization), Effusion (pleural)
🩻 CASE 4 - TOUGHEST YET!
- Which zone/lobe is the opacity in?
- Do you see any cavitation? (dark hole within the opacity)
- What is the "bulging fissure sign" - is it present?
- What is your diagnosis?
- Bonus: Name the organism most classically associated with this presentation AND the sign on this X-ray
tb
✅ CORRECT! But only half the story! 🔥
📋 FULL ANSWER - CASE 4
| Question | Answer |
|---|---|
| Zone/Lobe | Right upper lobe (RUL) - upper zone opacity |
| Cavitation | ✅ YES - dark radiolucent area within the consolidation (thick black arrow) |
| Bulging fissure | ✅ YES - horizontal fissure displaced downward (white arrow) |
| Your answer | ✅ TB - correct for clinical picture! |
| Full radiological diagnosis | RUL cavitating consolidation with bulging fissure |
The twist - TWO diagnoses here:
| Feature | Points to... |
|---|---|
| Upper lobe + cavitation + night sweats + immigrant + haemoptysis | ✅ Post-primary TB (reactivation) |
| Bulging fissure + dense RUL consolidation | ✅ Klebsiella pneumoniae |
In real exams: upper lobe cavitation = TB until proven otherwise Bulging fissure = Klebsiella (classic sign - lobar expansion pushes fissure down) Both can coexist! Here the CXR was a Klebsiella case but your clinical instinct for TB was excellent given the history!
TB on CXR - what to look for:
- Post-primary (reactivation): Upper lobe cavitation + fibrosis + calcification
- Primary TB: Lower/mid zone consolidation + ipsilateral hilar adenopathy (Ghon complex)
- Miliary TB: Diffuse tiny 1-2mm nodules ("millet seeds") throughout both lungs
🏆 FINAL SCORE: 4/4 - PERFECT!
| Case | Diagnosis | Your Answer | Score |
|---|---|---|---|
| Case 1 | Right Pleural Effusion | Pleural effusion | ✅ |
| Case 2 | Right Pneumothorax | Pneumothorax | ✅ |
| Case 3 | Pulmonary Edema / CCF | CCF | ✅ |
| Case 4 | RUL Cavitation (TB/Klebsiella) | TB | ✅ |
give me more
chest X-ray pulmonary mass lung cancer solitary nodule
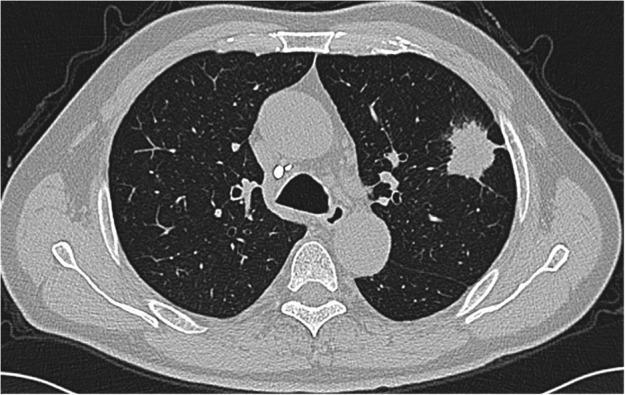
This diagnostic image is an axial contrast-enhanced chest computed tomography (CT) scan displayed in a lung window. The primary finding is a solitary pulmonary nodule located in the left upper lobe of the lung. The mass measures approximately 3.8 x 3.4 cm and exhibits irregular, lobulated, and spiculated margins, which are characteristic features of malignancy. The density of the lesion is solid and significantly higher than the surrounding pulmonary parenchyma, without evidence of internal calcification or cavitation. Anatomical landmarks including the trachea, mediastinal great vessels, and vertebrae are visible in the midline. The right lung appears clear with no visible masses. The chest wall, including the ribs and scapulae, remains intact. This image is used to demonstrate the radiographic presentation of primary lung adenocarcinoma, specifically within the context of tumors containing signet-ring cell components. It serves as an educational example for oncology and radiology students to identify morphological characteristics of lung cancer on CT imaging.
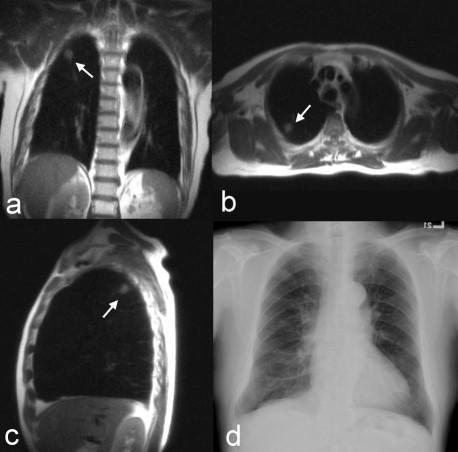
This diagnostic imaging set compares thoracic MRI and radiography findings for a solitary pulmonary nodule. Panels (a), (b), and (c) present MRI T2-weighted HASTE (Half-Fourier Acquisition Single-Shot Turbo Spin Echo) images in coronal, axial, and sagittal planes, respectively. These MRI scans utilize a 'black blood' preparation technique, which suppresses vascular signals to highlight parenchymal abnormalities. A consolidated, irregular mass approximately 1.2 cm in diameter is clearly visible (white arrows) within the posterior segment of the right upper lobe. The lesion appears hyperintense against the signal-void background of the aerated lung. Panel (d) shows a corresponding posterior-anterior (PA) chest radiograph where the lesion is not readily identifiable, demonstrating the higher sensitivity of specific MRI sequences over conventional X-ray for small peripheral lesions. Clinically, this image set illustrates the detection of Stage Ia squamous cell carcinoma. The case highlights the educational utility of multi-planar MRI reconstruction in oncological staging and the diagnostic limitations of standard radiography in early-stage lung cancer detection.
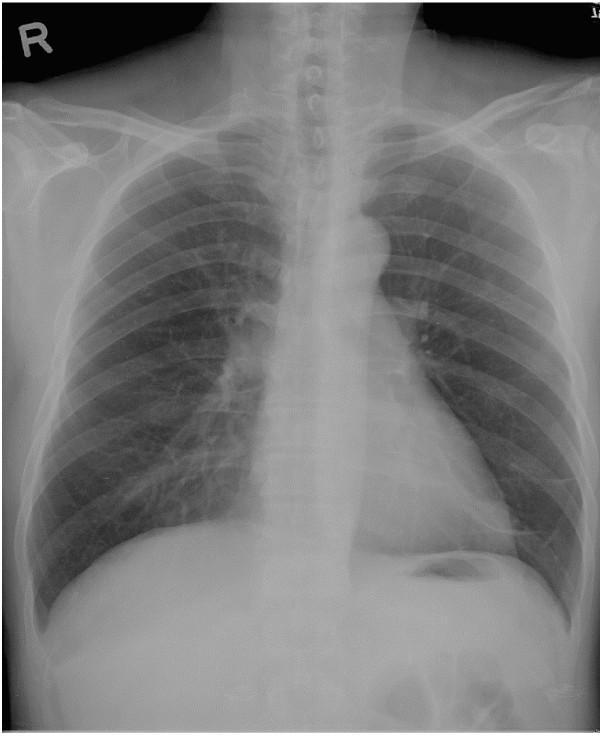
This diagnostic image is a posterior-anterior (PA) view chest X-ray. It displays a solitary pulmonary nodule or mass shadow located in the left lower lung field. The mass is radiopaque (appearing white relative to the darker, air-filled lung parenchyma) and exhibits somewhat ill-defined borders, partially overlapping the cardiac silhouette and the left hemidiaphragm. Primary anatomical landmarks visible include the rib cage, clavicles, vertebral column, and the heart, providing context for the mass's position within the lower lobe region. The mediastinum appears midline, and the trachea is patent. In clinical context, such a finding may represent primary pulmonary adenocarcinoma or metastatic disease. The image is an essential educational tool for medical training in radiology and pulmonology, demonstrating the visual presentation of a peripheral lung mass and the importance of correlating radiographic findings with clinical history and follow-up computed tomography (CT).
bilateral hilar lymphadenopathy sarcoidosis chest X-ray
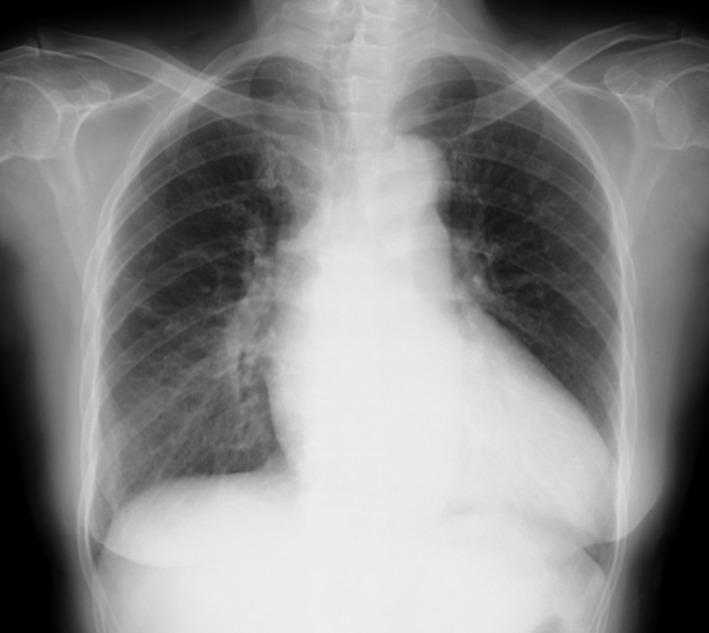
A posterior-anterior (PA) chest X-ray demonstrating a combination of thoracic findings. The image reveals prominent bilateral hilar lymphadenopathy (BHL), characterized by well-defined, bulky opacities in both hilar regions, consistent with Stage II sarcoidosis. Additionally, there is evidence of pulmonary edema, visualized as increased perihilar haziness and interstitial markings radiating from the central lung zones, which obscures the sharp margins of the pulmonary vasculature. The cardiac silhouette appears slightly enlarged, and there is a mild reduction in the clarity of the costophrenic angles. The musculoskeletal structures and overlying soft tissues are unremarkable. This radiographic presentation is significant for assessing systemic conditions such as cardiac sarcoidosis, where lymphadenopathy and acute congestive heart failure findings may coexist.
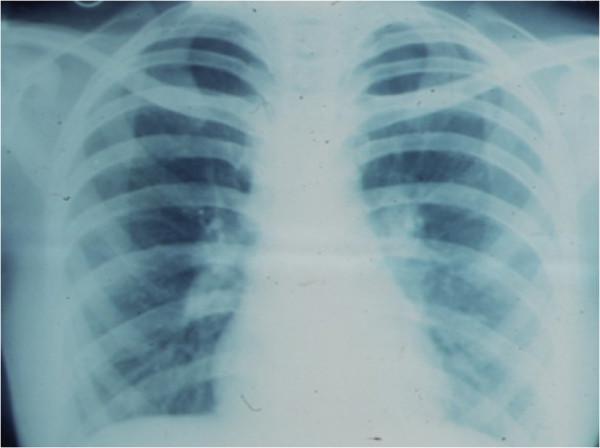
This diagnostic image is an anteroposterior chest X-ray demonstrating a classic presentation of bilateral hilar lymphadenopathy. The primary finding is the symmetrical enlargement of the hilar regions, appearing as lobulated, increased-density masses where the major bronchi and pulmonary vessels enter the lung parenchyma. This 'potato-node' appearance is a hallmark of pulmonary sarcoidosis. The lung fields are generally clear without obvious parenchymal infiltrates or consolidation, though the hilar margins are ill-defined due to the lymphatic enlargement. The mediastinal borders are slightly widened, but the cardiac silhouette and diaphragmatic contours remain distinguishable. The ribcage and clavicles are visualized and provide anatomical orientation. Clinically, this imaging is characteristic of Stage I sarcoidosis, often used to evaluate systemic granulomatous disease in both radiology and internal medicine education.
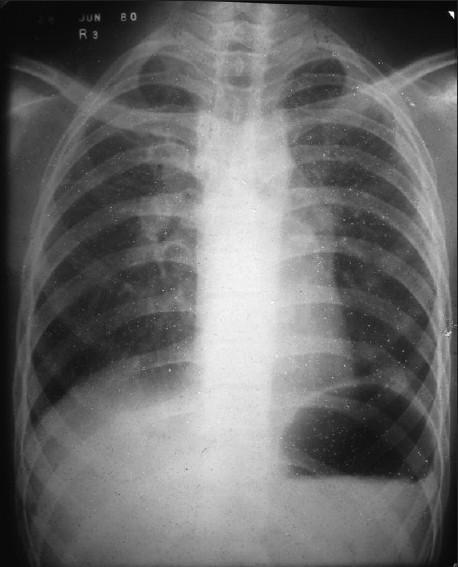
This diagnostic image is a posteroanterior (PA) chest X-ray illustrating classic features of stage II sarcoidosis. The primary finding is significant bilateral hilar lymphadenopathy, characterized by symmetrical enlargement and lobulated contours of both lung roots. Additionally, there is prominent soft tissue density in the left paratracheal region, indicating paratracheal lymphadenopathy. The lung parenchyma exhibits a diffuse reticulonodular pattern, with granular infiltrates most concentrated in the upper and middle lung zones bilaterally. These small, ill-defined opacities represent granulomatous inflammation within the interstitial spaces. The combination of symmetric hilar nodes and upper-lobe predominant parenchymal changes is highly characteristic of sarcoidosis. The image serves as a clinical reference for pulmonary manifestations of systemic granulomatous disease and the radiological assessment of mediastinal lymphadenopathy.
🩻 CASE 5
- Where exactly is the opacity? (zone + side)
- Is the trachea midline?
- Are the costophrenic angles clear?
- What is your diagnosis?
- Bonus: What is the single most important next investigation?
pulmonary carcinoma
✅ CORRECT! 5/5! 🔥🔥🔥🔥🔥
📋 FULL ANSWER - CASE 5
| Question | Answer |
|---|---|
| Location | Left lower zone - ill-defined opacity overlapping the cardiac border and left hemidiaphragm |
| Trachea | Midline - no significant shift |
| Costophrenic angles | Right clear; left slightly obscured by the mass |
| Diagnosis | ✅ Lung carcinoma (solitary pulmonary mass) |
| Bonus | CT chest + PET scan for staging, then bronchoscopy/CT-guided biopsy for tissue diagnosis |
Key teaching points:
- Solitary pulmonary mass in a heavy smoker over 60 = lung cancer until proven otherwise
- Ill-defined / spiculated margins = features of malignancy
- Silhouette sign here - mass overlaps left heart border = left lower lobe / lingula location
- Differential: Primary lung cancer (most likely), metastasis, lung abscess, carcinoid
Red flags for malignancy on CXR: Spiculated margins, upper lobe mass, rib destruction, hilar enlargement, persistent opacity not resolving with antibiotics
🩻 CASE 6
- Where is the abnormality - lungs or hila?
- Is it unilateral or bilateral?
- Are the lung fields clear?
- What is your diagnosis?
- Bonus: What is the classic description of these hilar shadows, and what stage is this?
idk
📋 FULL ANSWER - CASE 6
| Question | Answer |
|---|---|
| Abnormality location | Hila - the root of the lungs (where bronchi + vessels enter), NOT the lung fields themselves |
| Unilateral or bilateral? | Bilateral - both sides symmetrically enlarged |
| Lung fields | Relatively clear - no consolidation, no effusion |
| Diagnosis | Sarcoidosis - Stage I |
| Bonus | Classic description = "Potato nodes" - lobulated, bulky bilateral hilar lymphadenopathy. Stage I = hilar lymphadenopathy only (no parenchymal involvement) |
How to spot it:
- Bilaterally enlarged (both sides equally)
- Lobulated/lumpy - like potatoes
- Lung fields remain clear
Sarcoidosis Staging on CXR:
| Stage | CXR Finding |
|---|---|
| Stage 0 | Normal CXR |
| Stage I | Bilateral hilar lymphadenopathy (BHL) only ← This case |
| Stage II | BHL + parenchymal infiltrates |
| Stage III | Parenchymal infiltrates only (no BHL) |
| Stage IV | Pulmonary fibrosis |
Key teaching point:
Young woman, dry cough, looks well, bilateral hilar enlargement = Sarcoidosis The patient looks TOO WELL for how abnormal the CXR looks - this is classic sarcoidosis! Other causes of bilateral hilar enlargement: Lymphoma, TB, pulmonary arterial hypertension
📊 UPDATED SCORECARD
| Case | Diagnosis | Result |
|---|---|---|
| Case 1 | Pleural Effusion | ✅ |
| Case 2 | Pneumothorax | ✅ |
| Case 3 | CCF / Pulmonary Edema | ✅ |
| Case 4 | TB / Klebsiella (RUL cavitation) | ✅ |
| Case 5 | Lung Carcinoma | ✅ |
| Case 6 | Sarcoidosis | ❌ (new learning!) |
🩻 CASE 7 - Ready?
- The right lung is hyperlucent - could this be emphysema rather than PTX? How would you tell the difference?
- What CXR features would you expect to see in COPD/emphysema specifically?
- What is the barrel chest sign on CXR?