Here is your complete, comprehensive answer to all topics. I'll present each one in exam-ready format with the correct number of points.
BIOCHEMISTRY COMPREHENSIVE NOTES
Referenced from: Lippincott's Biochemistry 8th Ed., Harper's Illustrated Biochemistry 32nd Ed., Basic Medical Biochemistry (Marks) 6th Ed., Harper's Biochemistry
SECTION 1: LIPID METABOLISM
1. DIGESTION AND ABSORPTION OF DIETARY LIPIDS (10 Marks - 25 Points)
Overview
- Average daily lipid intake: ~78 g/day; >90% is triacylglycerol (TAG/TG)
- Remainder: cholesterol, cholesteryl esters, phospholipids, free fatty acids
- Digestion is sequential: Mouth → Stomach → Small Intestine
A. DIGESTION
1. Mouth/Stomach Phase
- Lingual lipase (from serous glands under tongue) begins digestion; acid-stable (pH 4-6)
- Gastric lipase (from gastric mucosa) continues digestion; mainly hydrolyzes short- and medium-chain FA (≤12C)
- Together account for only ~10% of total lipid digestion
- Critical in infants and patients with pancreatic insufficiency (Cystic Fibrosis)
- Stomach churning physically breaks lipid into small droplets (coarse emulsion)
2. Small Intestinal Phase - Emulsification
6. CCK (Cholecystokinin) released from duodenal I-cells → contracts gallbladder → releases bile salts into duodenum
7. Secretin (from S-cells) → stimulates pancreas to secrete HCO₃⁻ → neutralizes pH to 6-7 for enzyme activity
8. Bile salts (amphipathic; conjugated with glycine or taurine) coat lipid droplets → stable fine emulsion → dramatically increases surface area for enzyme action
3. Pancreatic Enzyme Action
| Enzyme | Substrate | Product |
|---|
| Pancreatic lipase | TAG | 2-MAG + 2 FFA (at C1, C3) |
| Colipase (cofactor) | Displaces bile salts from lipid surface | Restores lipase activity |
| Cholesteryl ester hydrolase | Cholesteryl esters | Cholesterol + FFA |
| Phospholipase A₂ | Phospholipids (at C2) | Lysophospholipid + FFA |
- Colipase is secreted as procolipase → activated by trypsin; essential cofactor for lipase
- Pancreatic lipase cleaves TAG at C1 and C3 positions → 2-MAG + 2 FFA
- Orlistat (anti-obesity drug) inhibits both gastric and pancreatic lipases
B. ABSORPTION
4. Micelle Formation
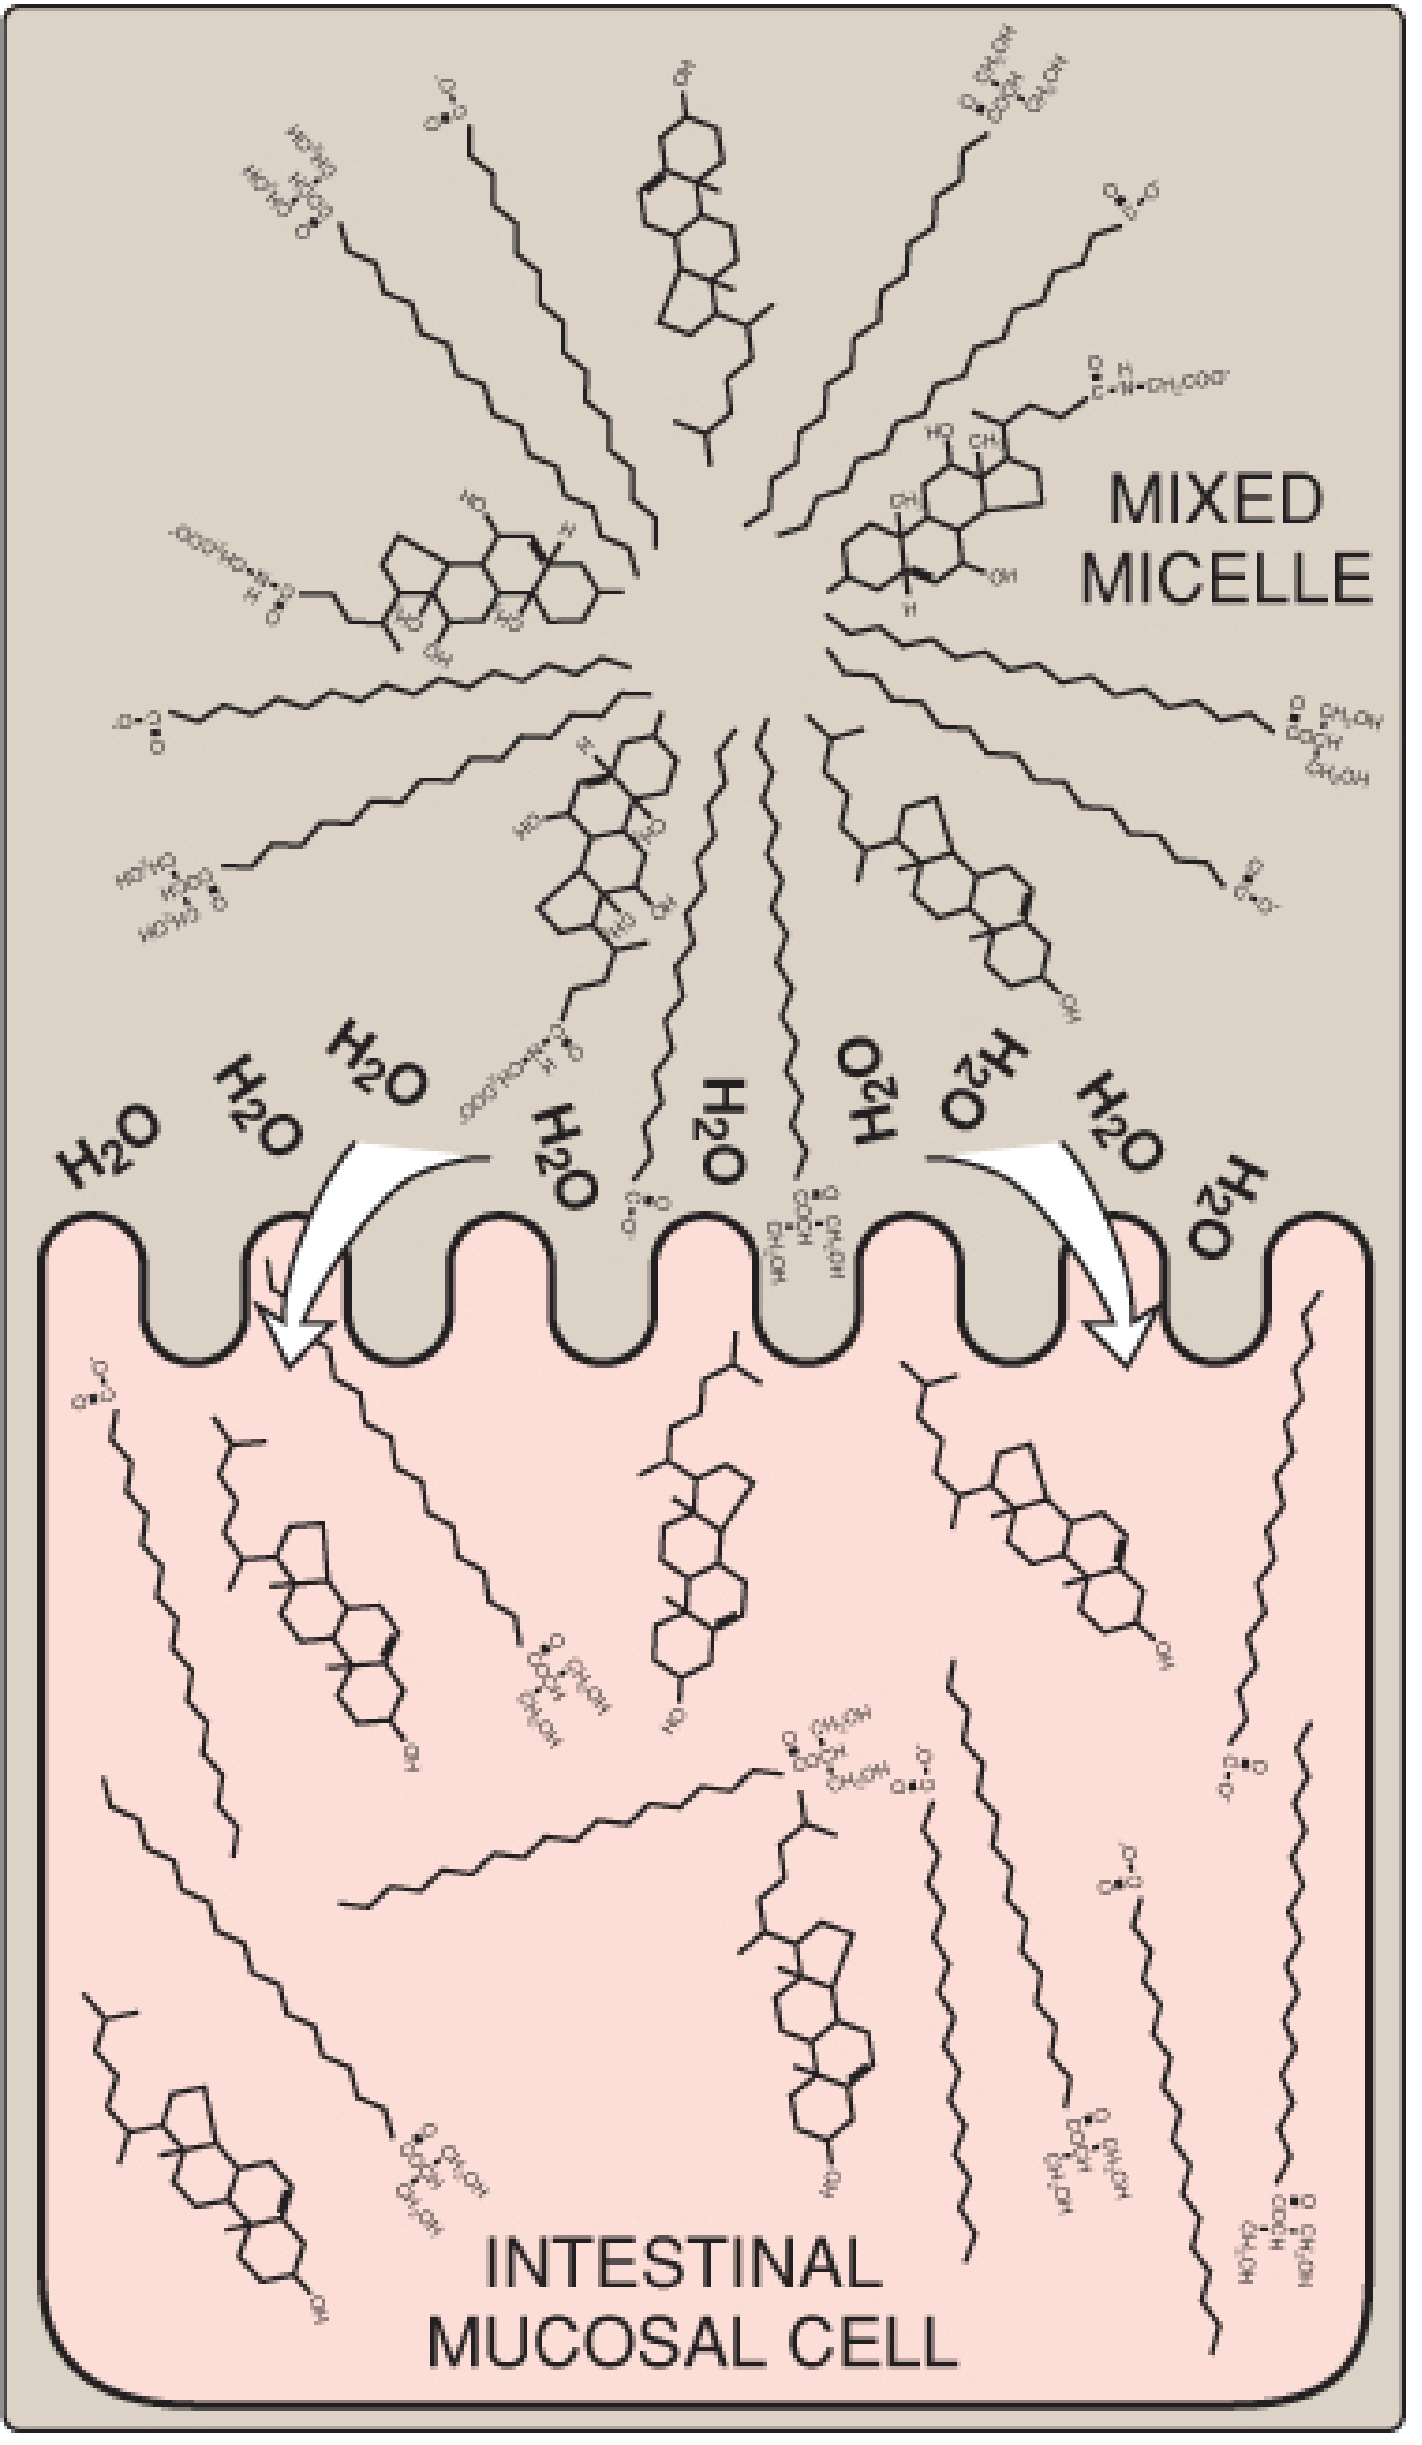
12. Products (2-MAG, FFA, free cholesterol, lysophospholipids) combine with bile salts → form mixed micelles
13. Mixed micelles: disc-shaped, ~50Å diameter; hydrophobic core, hydrophilic exterior
14. Fat-soluble vitamins A, D, E, K also transported in micelles
15. Micelles diffuse through unstirred water layer → reach brush-border of enterocytes
16. Lipid molecules diffuse into enterocytes (micelles themselves are NOT absorbed)
17. Bile salts left behind → reabsorbed in terminal ileum → enterohepatic circulation (<5% lost in feces)
5. Cholesterol Absorption
18. Cholesterol absorbed via NPC1L1 (Niemann-Pick C1-Like 1) transporter in brush border
19. Ezetimibe inhibits NPC1L1 → reduces cholesterol absorption → cholesterol-lowering drug
6. Short and Medium-Chain FA
20. Short/medium-chain FA (≤12C) are water-soluble → absorbed without micelles → directly enter portal blood bound to albumin → to liver (bypass lymphatics)
C. RESYNTHESIS AND CHYLOMICRON FORMATION
7. Re-synthesis in Enterocytes (SER)
21. Long-chain FA activated: FA + CoA → Fatty acyl-CoA (thiokinase)
22. 2-MAG pathway: 2-MAG + 2 Acyl-CoA → TAG (MAG acyltransferase + DAG acyltransferase)
23. TAG + ApoB-48 + phospholipids + cholesterol esters + fat-soluble vitamins → Chylomicrons
24. Requires Microsomal TG Transfer Protein (MTP); released by exocytosis → lacteals (lymphatics) → thoracic duct → left subclavian vein
25. In blood: nascent chylomicrons acquire ApoE and ApoCII from HDL → mature chylomicrons
D. DISORDERS OF LIPID DIGESTION & ABSORPTION
| Disorder | Mechanism | Consequence |
|---|
| Pancreatic insufficiency (CF, pancreatitis) | ↓ Lipase/colipase | Steatorrhea |
| Bile salt deficiency (ileal resection) | No micelle formation | Fat-soluble vitamin deficiency, steatorrhea |
| Abetalipoproteinemia | No ApoB-48 → no chylomicrons | Fat accumulates in enterocytes |
| Familial chylomicronemia (Type I HLP) | LPL or ApoCII deficiency | Fasting hyperchylomicronemia, pancreatitis |
| Zollinger-Ellison syndrome | Excess H⁺ → inactivates lipase | Steatorrhea, duodenal ulcers |
Steatorrhea = excess fat in feces; caused by any disruption from emulsification to chylomicron secretion.
2. BETA-OXIDATION OF PALMITIC ACID AND ENERGETICS (10 Marks - 25 Points)
Overview
- Beta-oxidation = major catabolic pathway for fatty acids
- Occurs in the mitochondrial matrix
- Also called the Knoop pathway
- FA yield 9 kcal/g (vs 4 kcal/g for carbs/protein)
A. ACTIVATION OF FATTY ACIDS (Cytosol)
- Free FA are metabolically inert → must be activated to fatty acyl-CoA
- Reaction: FA + CoA + ATP → Fatty acyl-CoA + AMP + PPi
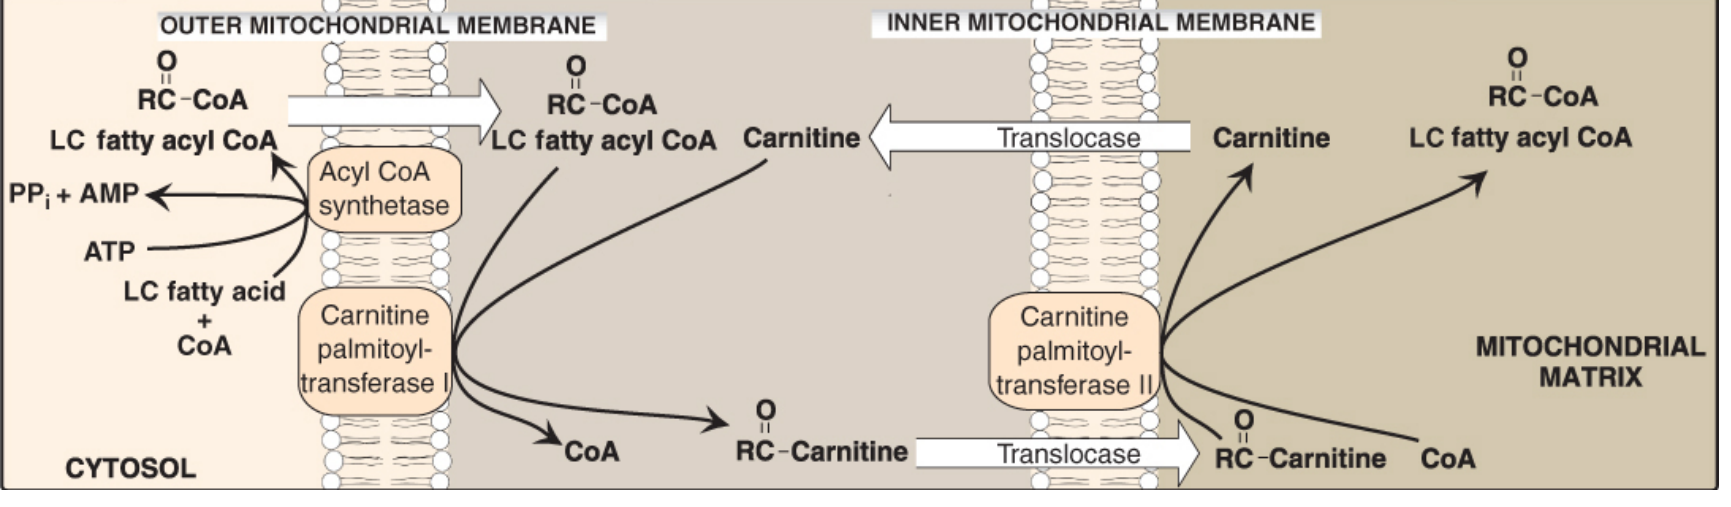
- Enzyme: Fatty acyl-CoA synthetase (Thiokinase) on outer mitochondrial membrane
- Costs 2 ATP equivalents (ATP → AMP, not ADP; PPi → 2Pi driven by pyrophosphatase)
B. CARNITINE SHUTTLE (Transport into Mitochondria)
- Long-chain fatty acyl-CoA cannot cross the inner mitochondrial membrane (IMM) directly
- Step 1: Fatty acyl-CoA + Carnitine → Acylcarnitine + CoA
Enzyme: CPT-I (Carnitine Palmitoyltransferase I) - on outer face of IMM
- Step 2: Acylcarnitine transported across IMM by carnitine-acylcarnitine translocase
- Step 3: Acylcarnitine + CoA → Fatty acyl-CoA + Carnitine
Enzyme: CPT-II on inner face of IMM
- Key Regulation: Malonyl-CoA inhibits CPT-I → prevents simultaneous synthesis + oxidation (avoids futile cycling)
- Short/medium-chain FA (≤12C) do NOT need the carnitine shuttle
C. THE FOUR STEPS OF BETA-OXIDATION (One Cycle)
Mnemonic: O-H-O-T (Oxidation → Hydration → Oxidation → Thiolysis)
| Step | Reaction | Enzyme | Cofactor |
|---|
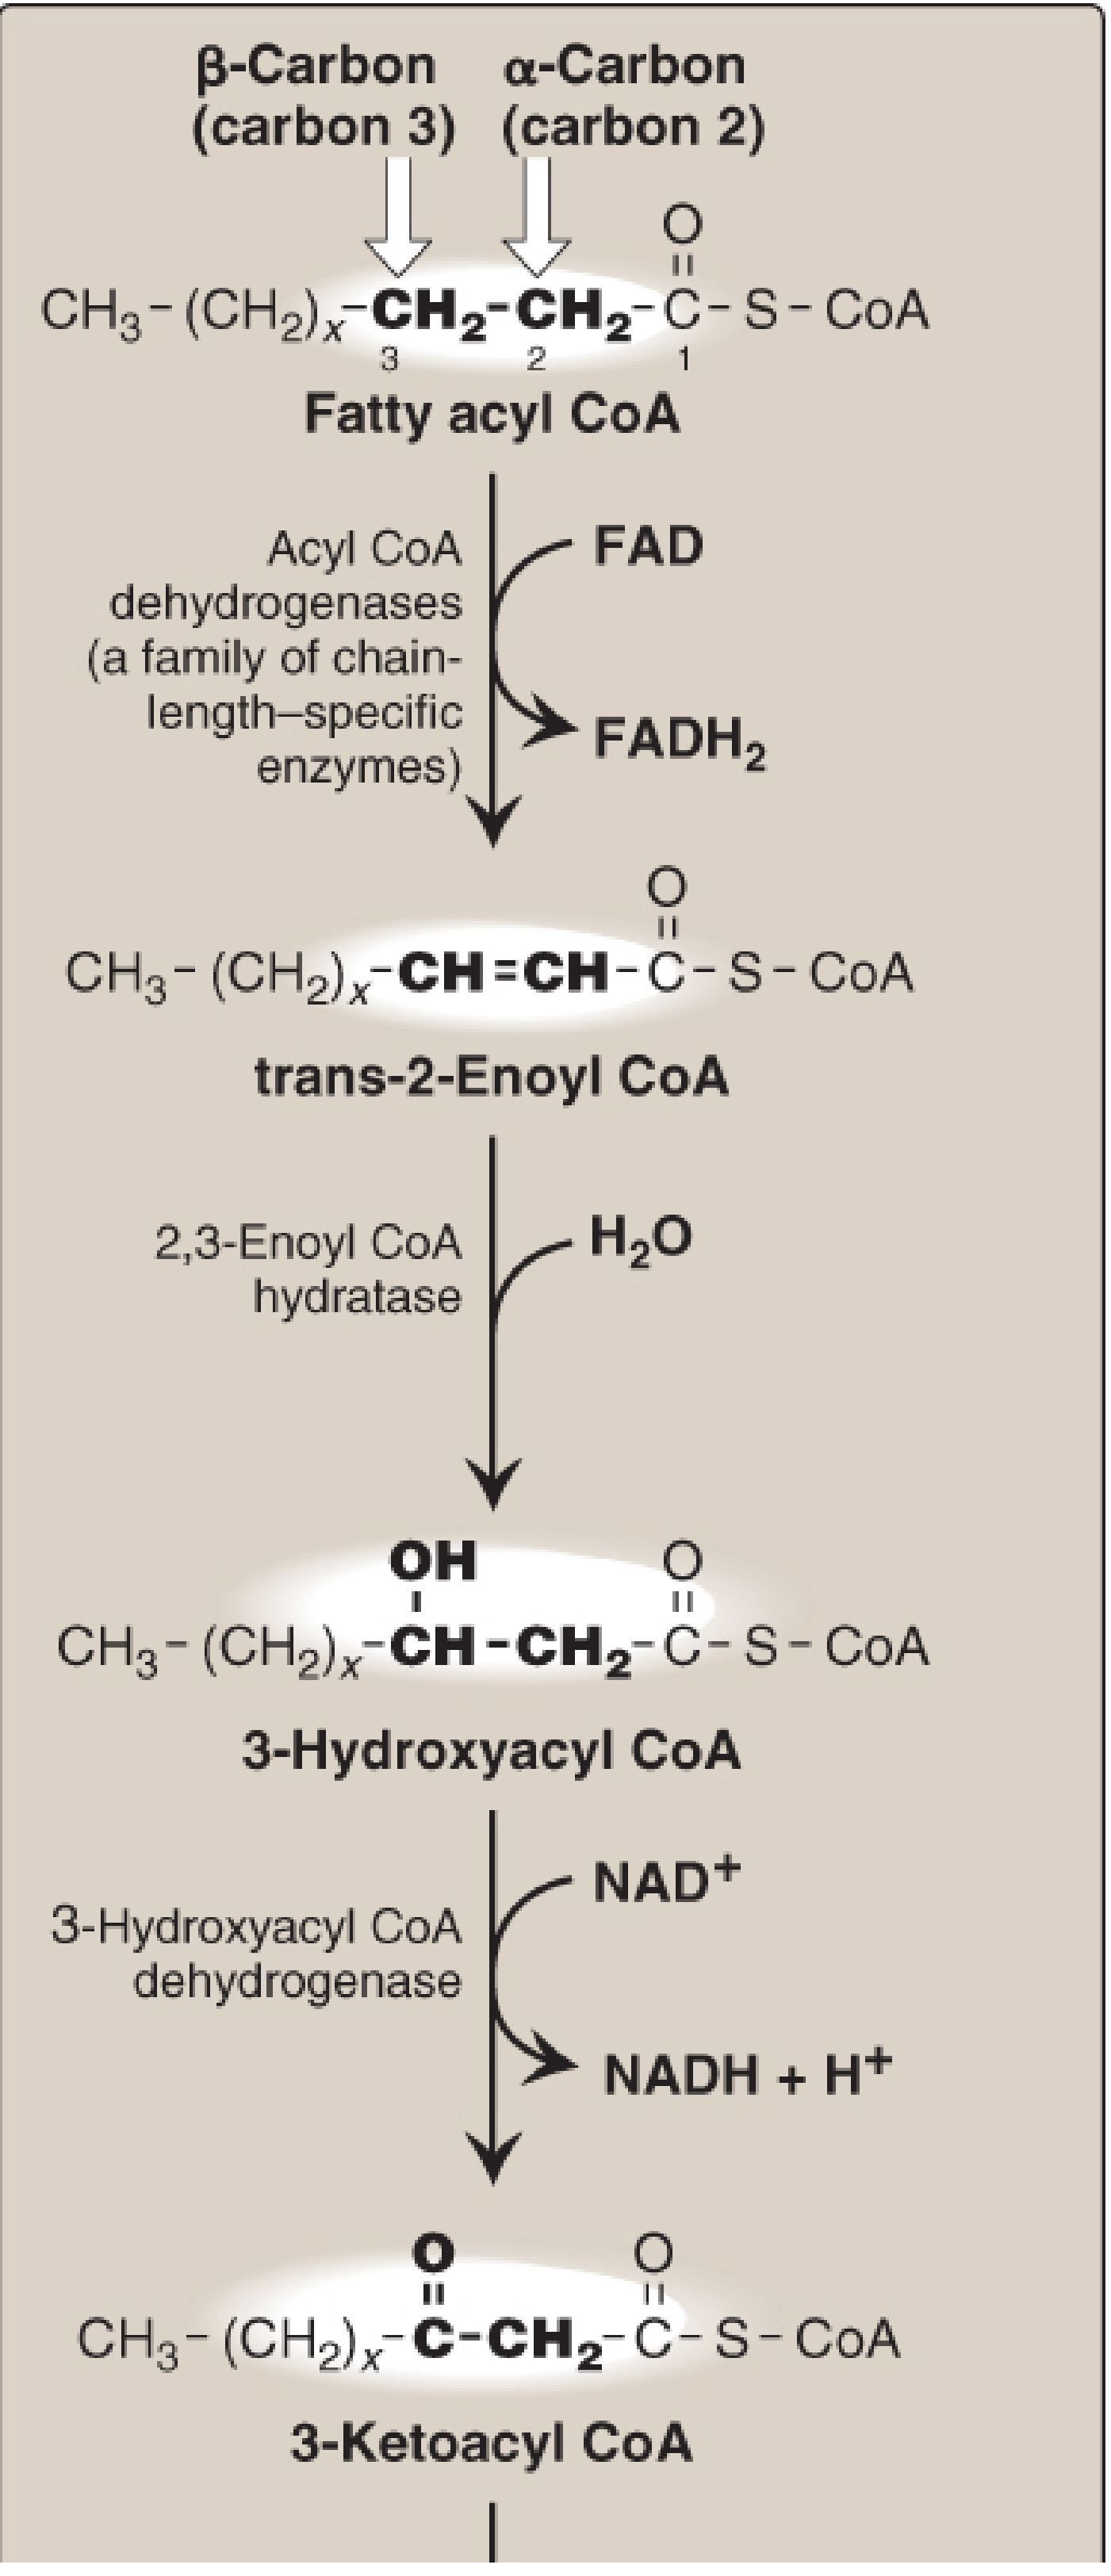
| 1. Oxidation (Dehydrogenation) | Acyl-CoA → trans-Δ²-Enoyl-CoA | Acyl-CoA dehydrogenase (VLCAD, LCAD, MCAD, SCAD) | FAD → FADH₂ |
| 2. Hydration | trans-Enoyl-CoA → L-3-Hydroxyacyl-CoA | 2,3-Enoyl-CoA hydratase | H₂O |
| 3. Oxidation (Dehydrogenation) | L-3-Hydroxyacyl-CoA → 3-Ketoacyl-CoA | L-3-Hydroxyacyl-CoA dehydrogenase | NAD⁺ → NADH |
| 4. Thiolysis | 3-Ketoacyl-CoA + CoA → Acyl-CoA (n-2C) + Acetyl-CoA | β-Ketothiolase (Thiolase) | CoA |
- Each cycle shortens chain by 2 carbons and yields: 1 FADH₂ + 1 NADH + 1 Acetyl-CoA
D. BETA-OXIDATION OF PALMITATE (C16:0)
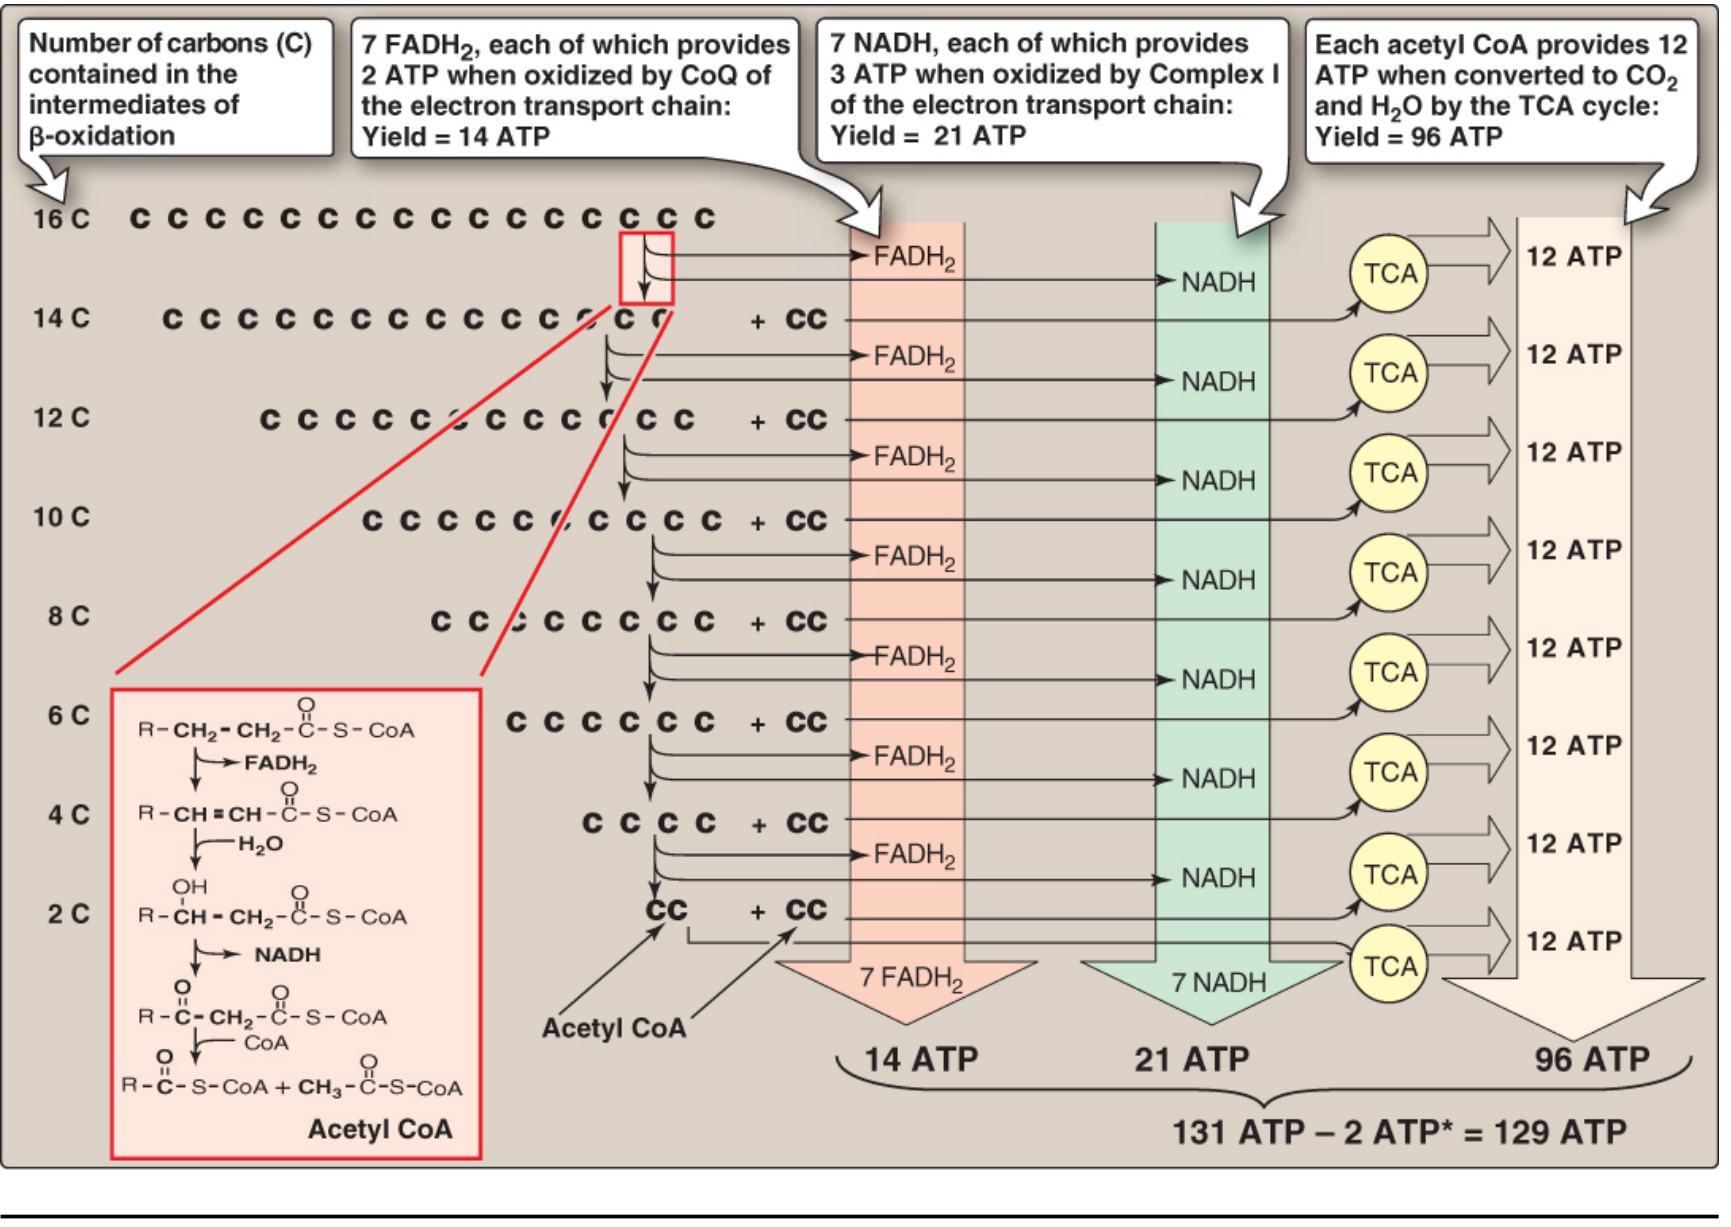
- Palmitate (C16:0) → 7 cycles of beta-oxidation
- Number of cycles = (n/2) - 1 = (16/2) - 1 = 7 cycles
- Acetyl-CoA produced = n/2 = 8 molecules
E. ENERGETICS OF PALMITATE OXIDATION
| Product | Quantity | ATP Yield |
|---|
| FADH₂ | 7 | 7 × 1.5 = 10.5 ATP |
| NADH | 7 | 7 × 2.5 = 17.5 ATP |
| Acetyl-CoA → TCA cycle | 8 | 8 × 10 = 80 ATP |
| Gross Total | | 108 ATP |
| Activation cost | -2 ATP | |
| NET TOTAL | | = 106 ATP |
Classic exam answer (Lippincott): Using older conventions → Net = 129 ATP
- Fatty acids yield more ATP per gram than any other fuel (most reduced molecule)
F. SPECIAL CASES OF BETA-OXIDATION
- Unsaturated FA (odd double bond): Needs 3,2-Enoyl-CoA isomerase (e.g., oleic acid 18:1Δ9)
- Unsaturated FA (even double bond): Needs isomerase + NADPH-dependent 2,4-dienoyl-CoA reductase (e.g., linoleic acid 18:2)
- Odd-chain FA: Final product is propionyl-CoA → succinyl-CoA (requires Vitamin B12 and biotin); only glucogenic FA product
- Peroxisomal β-oxidation: For VLCFA (≥22C); FADH₂ → H₂O₂ (no ATP from first step); catalase degrades H₂O₂
G. DISORDERS OF BETA-OXIDATION
- MCAD deficiency (most common): Medium-chain acyl-CoA dehydrogenase deficient → hypoketotic hypoglycemia; acylcarnitinuria; can be fatal; 1:14,000 births
- Primary carnitine deficiency: OCTN2 transporter defect → urinary carnitine loss → myopathy
- CPT-I deficiency: Cannot oxidize LCFA; severe hypoglycemia during fasting; hepatic failure
- CPT-II deficiency: Muscle weakness, myoglobinuria after exercise
- Zellweger syndrome: Peroxisome biogenesis defect → VLCFA accumulate in blood/tissues
- X-linked adrenoleukodystrophy: VLCFA transporter defect in peroxisomal membrane
3. SYNTHESIS OF LONG-CHAIN FATTY ACIDS (De Novo Lipogenesis) (10 Marks - 25 Points)
Overview
- Occurs when excess carbohydrate or protein is consumed
- Primary site: Liver (also lactating mammary glands; minor in adipose)
- Location: Cytosol (opposite of beta-oxidation which is in mitochondria)
- End product: Palmitate (C16:0)
- Requires NADPH (reductive) and ATP (endergonic)
- Activated by high insulin/glucagon ratio (fed state)
COMPARISON TABLE: Synthesis vs. Degradation
| Feature | Synthesis (Lipogenesis) | Degradation (β-Oxidation) |
|---|
| Location | Cytosol | Mitochondria |
| Shuttle used | Citrate (mito→cytosol) | Carnitine (cytosol→mito) |
| Coenzyme | NADPH | NAD⁺, FAD |
| 2-carbon donor/product | Malonyl-CoA | Acetyl-CoA |
| Activated by | High insulin, high energy | Low insulin, starvation |
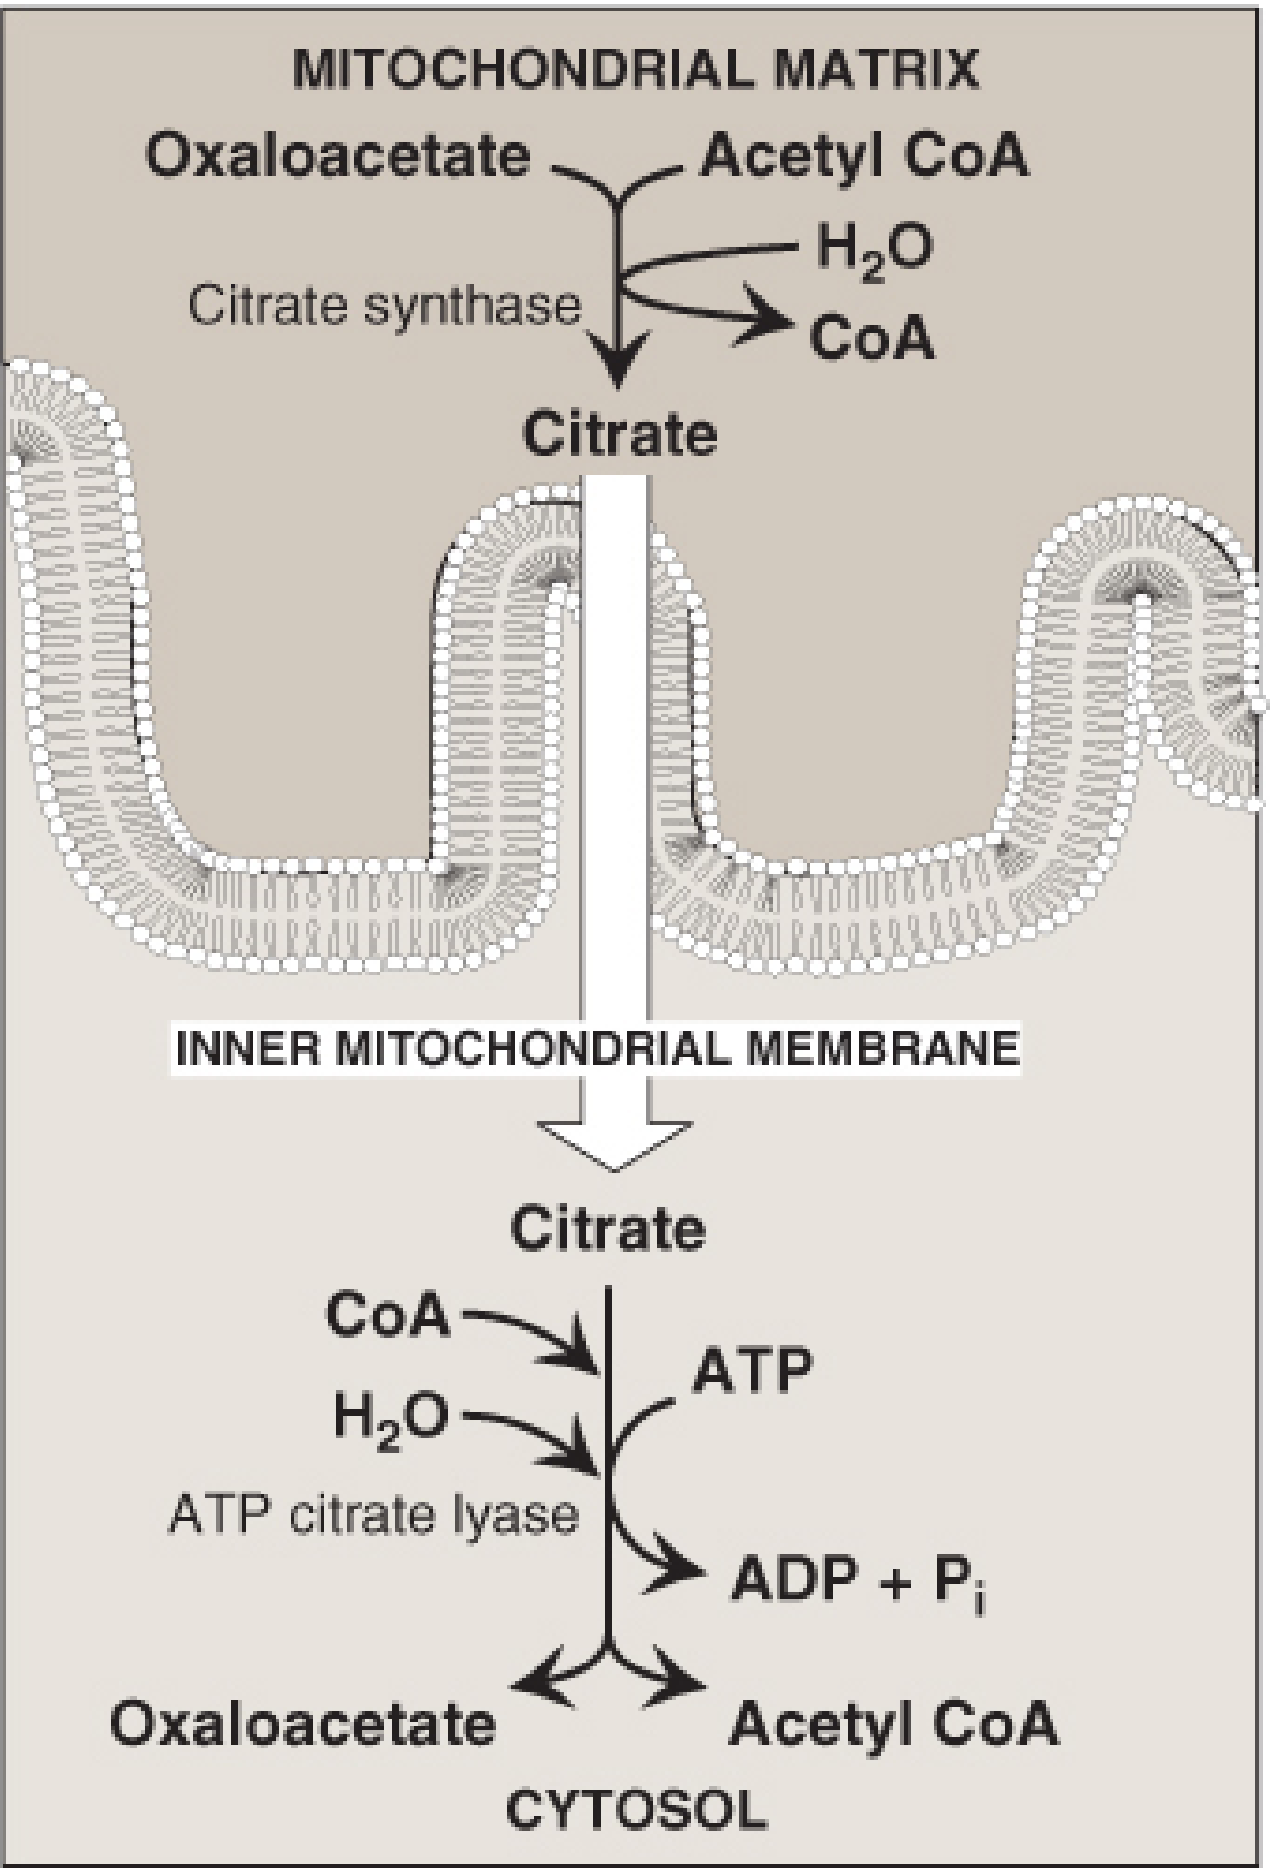
A. STEP 1: CITRATE SHUTTLE (Transfer of Acetyl-CoA to Cytosol)
- Mitochondrial acetyl-CoA cannot cross IMM directly
- Acetyl-CoA + OAA → Citrate (citrate synthase in matrix)
- Citrate exits via tricarboxylate transporter to cytosol
- In cytosol: Citrate → Acetyl-CoA + OAA by ATP-citrate lyase
- OAA recycled: OAA → Malate (NADH) → Pyruvate + NADPH (malic enzyme) → re-enters mitochondria
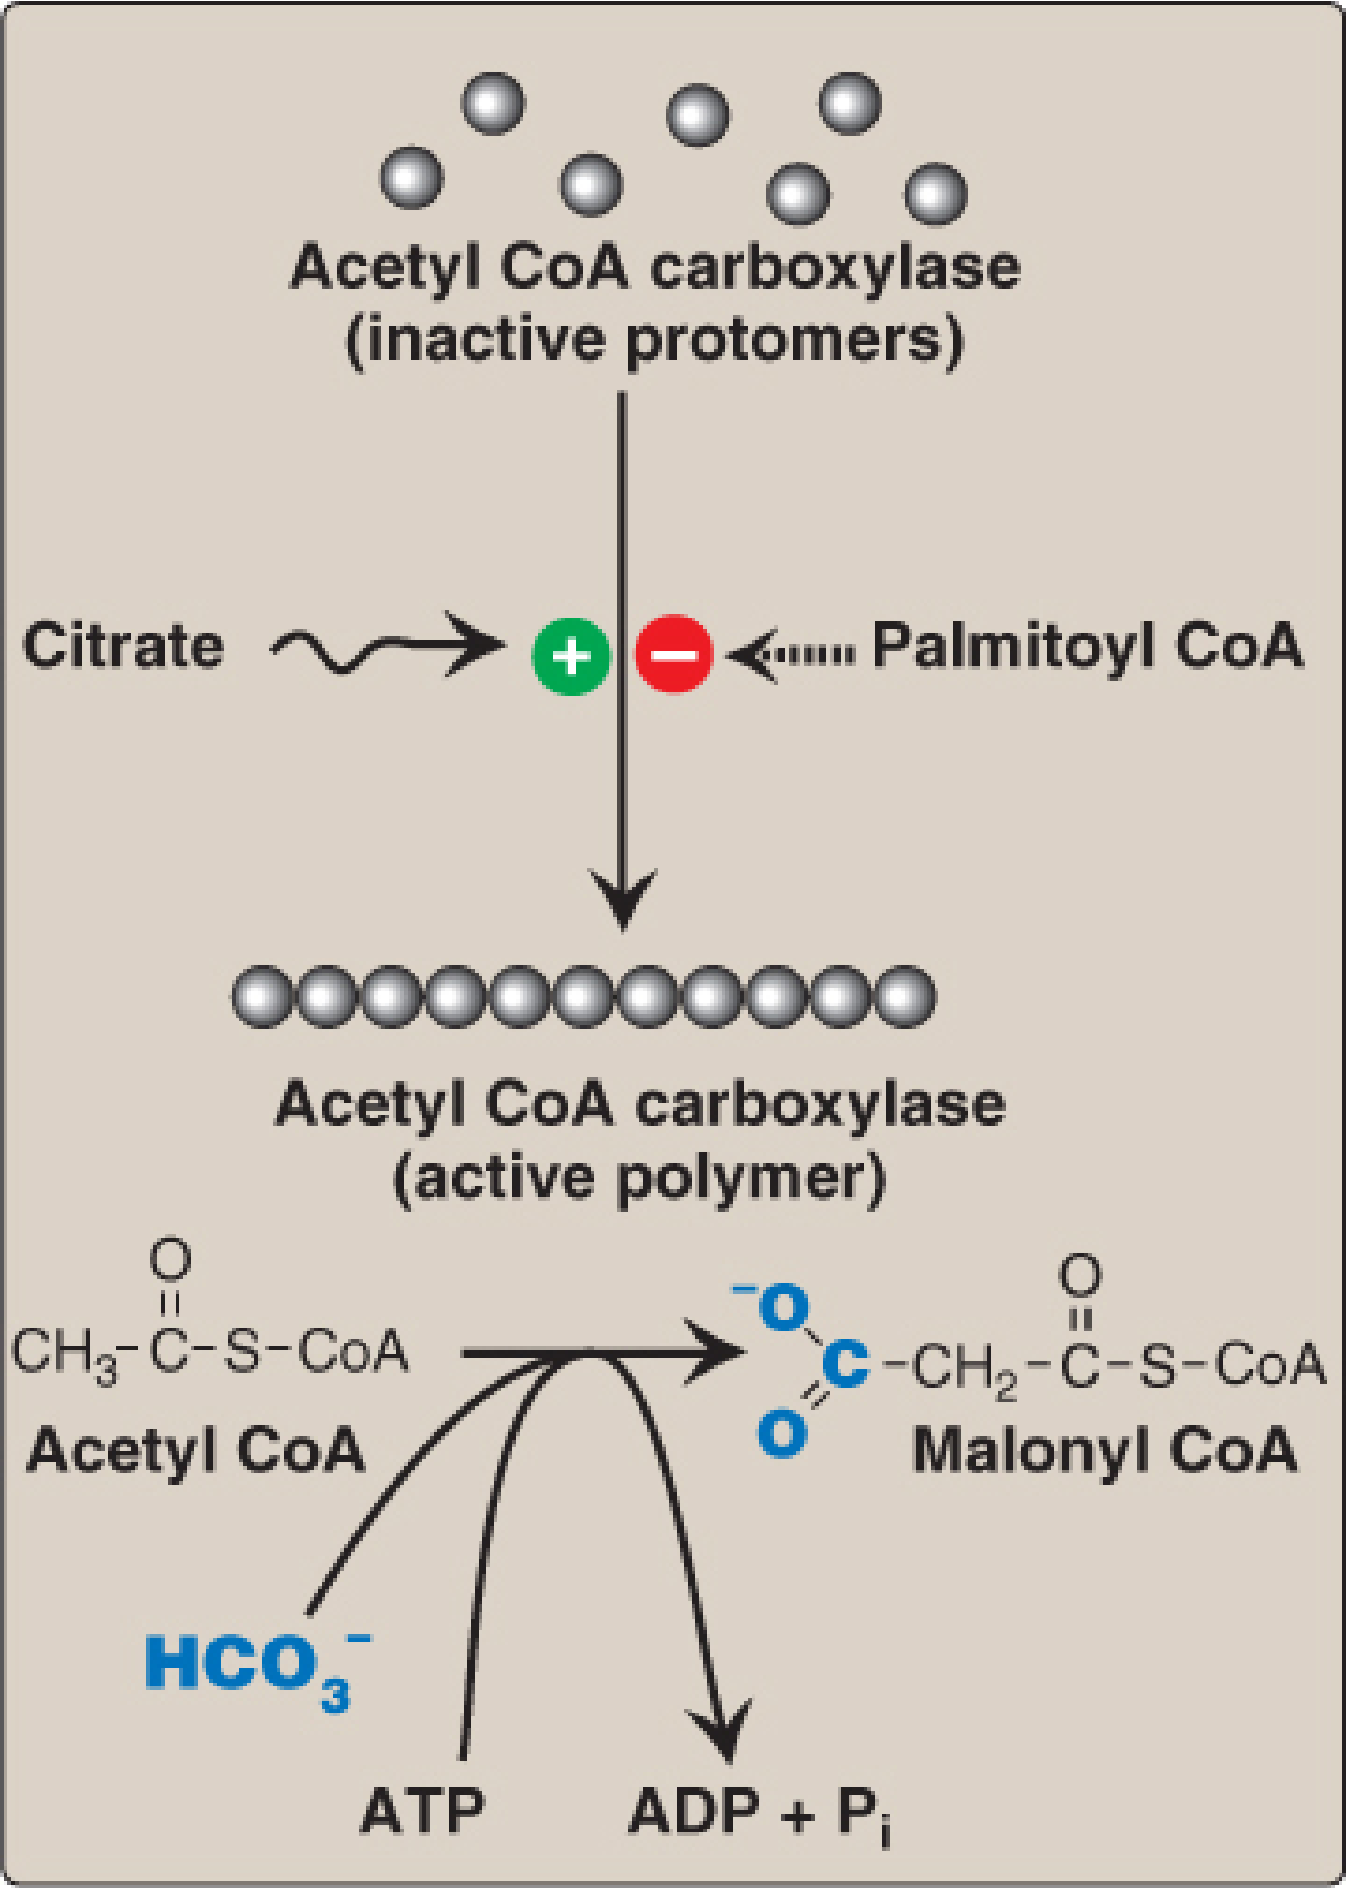
B. STEP 2: ACETYL-CoA → MALONYL-CoA (Rate-Limiting Step)
- Enzyme: Acetyl-CoA Carboxylase (ACC) - biotin-dependent
- Reaction: Acetyl-CoA + HCO₃⁻ + ATP → Malonyl-CoA + ADP + Pi
- This is the committed, rate-limiting step of fatty acid synthesis
- Regulation of ACC:
- Allosteric activation by citrate (polymerizes inactive monomers → active polymer)
- Allosteric inhibition by palmitoyl-CoA (end-product feedback; causes depolymerization)
- Covalent inactivation by AMPK phosphorylation (in fasting/low energy; triggered by glucagon/epinephrine)
- Covalent activation by dephosphorylation (insulin-stimulated phosphatase in fed state)
- Metformin activates AMPK → inhibits ACC → lowers plasma TAG (clinical use in T2DM)
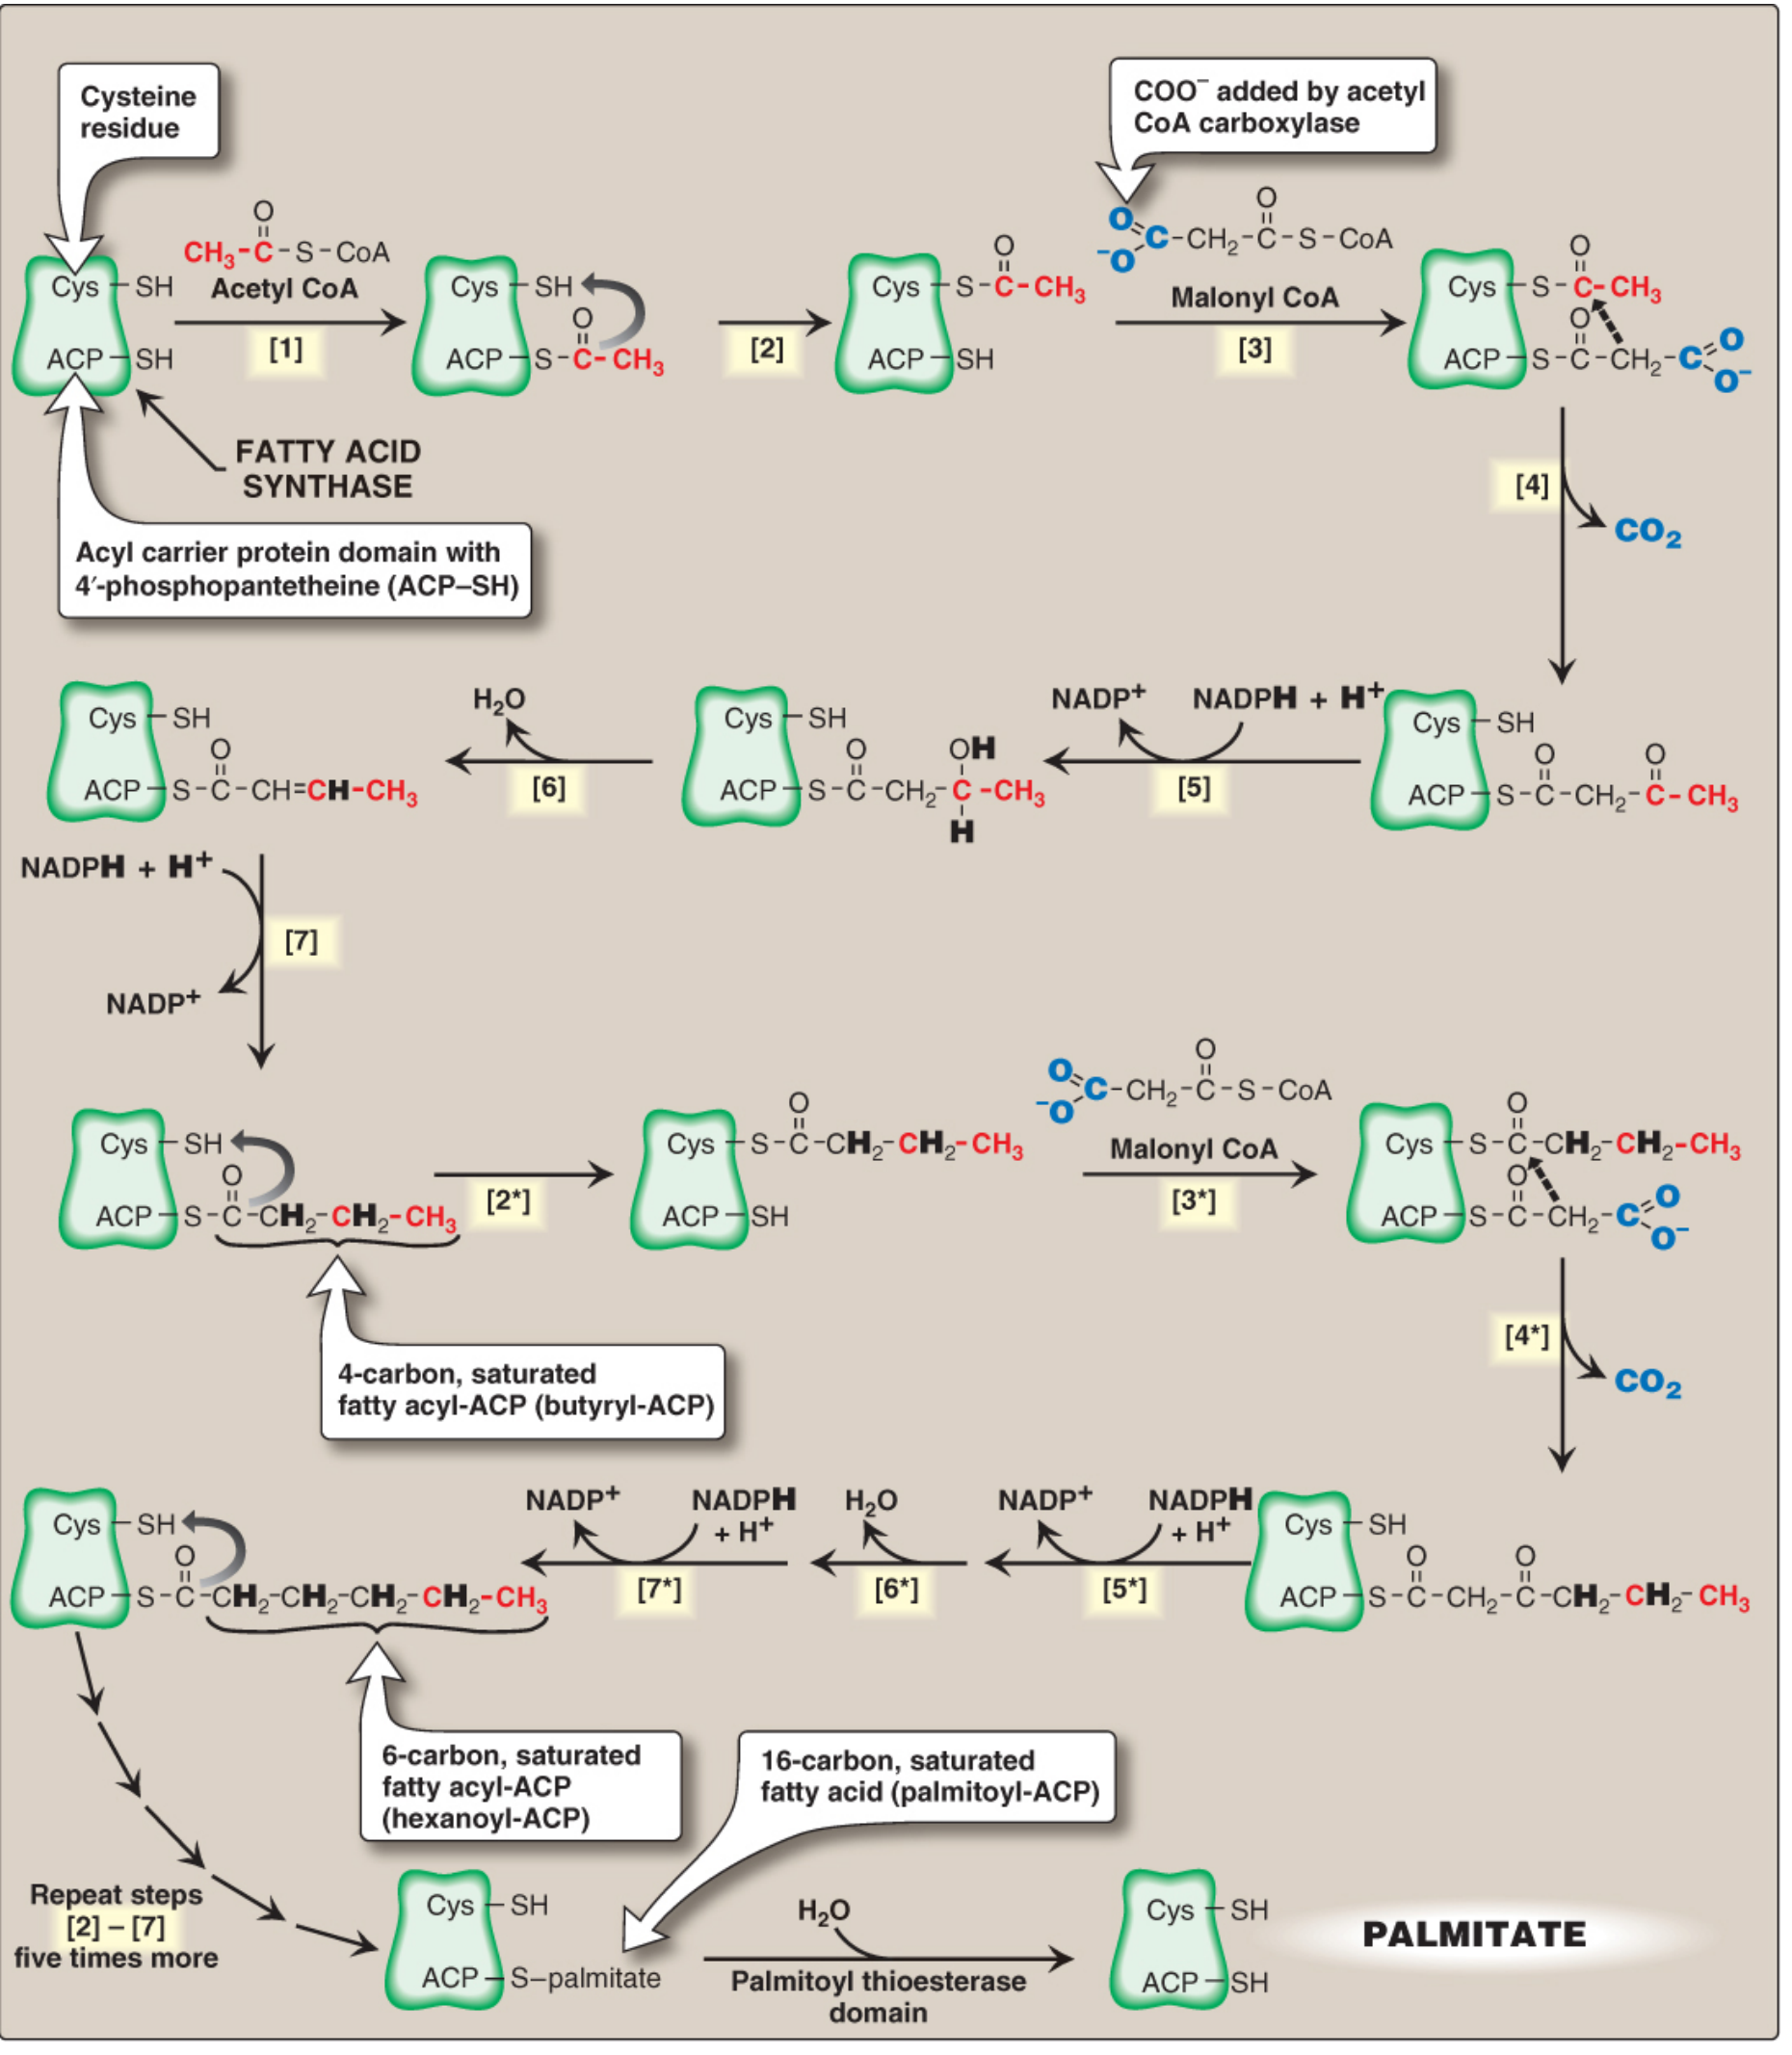
C. STEP 3: FATTY ACID SYNTHASE (FAS) CYCLE
- FAS: Multifunctional homodimeric enzyme; each monomer has 6 enzymatic domains + ACP domain
- ACP (Acyl Carrier Protein) contains 4'-phosphopantetheine (from Vitamin B5/Pantothenic acid) with -SH group that carries the growing chain
- Each cycle adds 2 carbons from malonyl-CoA:
- Condensation: Acetyl (Cys-SH) + Malonyl (ACP-SH) → Acetoacetyl-ACP + CO₂ (CO₂ from ACC is released → thermodynamically irreversible)
- Reduction: β-keto group reduced (NADPH → NADP⁺) → β-hydroxyacyl-ACP
- Dehydration: H₂O removed → trans-Δ²-enoyl-ACP
- Second Reduction: Double bond reduced (NADPH → NADP⁺) → Butyryl-ACP
- 7 cycles of FAS → Palmitoyl-ACP (C16) → Thioesterase cleaves → Free Palmitate
- Overall equation: 8 Acetyl-CoA + 7 ATP + 14 NADPH → Palmitate + 8 CoA + 7 ADP + 7 Pi + 14 NADP⁺
D. NADPH SOURCES
- 14 NADPH required per palmitate synthesized:
- Pentose phosphate pathway (PPP): 2 NADPH per glucose-6-P (major source)
- Malic enzyme: Malate + NADP⁺ → Pyruvate + CO₂ + NADPH
E. ELONGATION AND DESATURATION
- Elongation beyond C16: Occurs in Smooth ER; uses malonyl-CoA as 2C donor; NADPH as reductant → stearate (C18), VLCFA for brain myelin
- Desaturation: SER; Δ4, Δ5, Δ6, Δ9 desaturases; requires O₂, NADH, cytochrome b5; adds double bond usually between C9-C10 → oleic acid (18:1Δ9)
- Humans cannot insert double bonds beyond C9 toward ω-end → need dietary essential FA
F. ESSENTIAL FATTY ACIDS
- Linoleic acid (18:2, Δ9,12; ω-6) and α-Linolenic acid (18:3, Δ9,12,15; ω-3) are ESSENTIAL
- From plant oils; must be supplied in diet
- Linoleic acid → Arachidonic acid (20:4) (by elongation + desaturation) → precursor of prostaglandins, thromboxanes, leukotrienes (eicosanoids)
- α-Linolenic acid → EPA (20:5) and DHA (22:6) - omega-3 FA important for neurological development
- Essential FA deficiency: Dry, scaly dermatitis (disrupted skin water barrier)
- Reciprocal regulation: Malonyl-CoA (product of lipogenesis) inhibits CPT-I → prevents simultaneous synthesis and oxidation (no futile cycle)
4. KETONE BODIES - SYNTHESIS, UTILIZATION, KETOSIS (10 Marks - 25 Points)
Overview
- Ketone bodies = water-soluble products of incomplete FA oxidation; made in liver mitochondria only
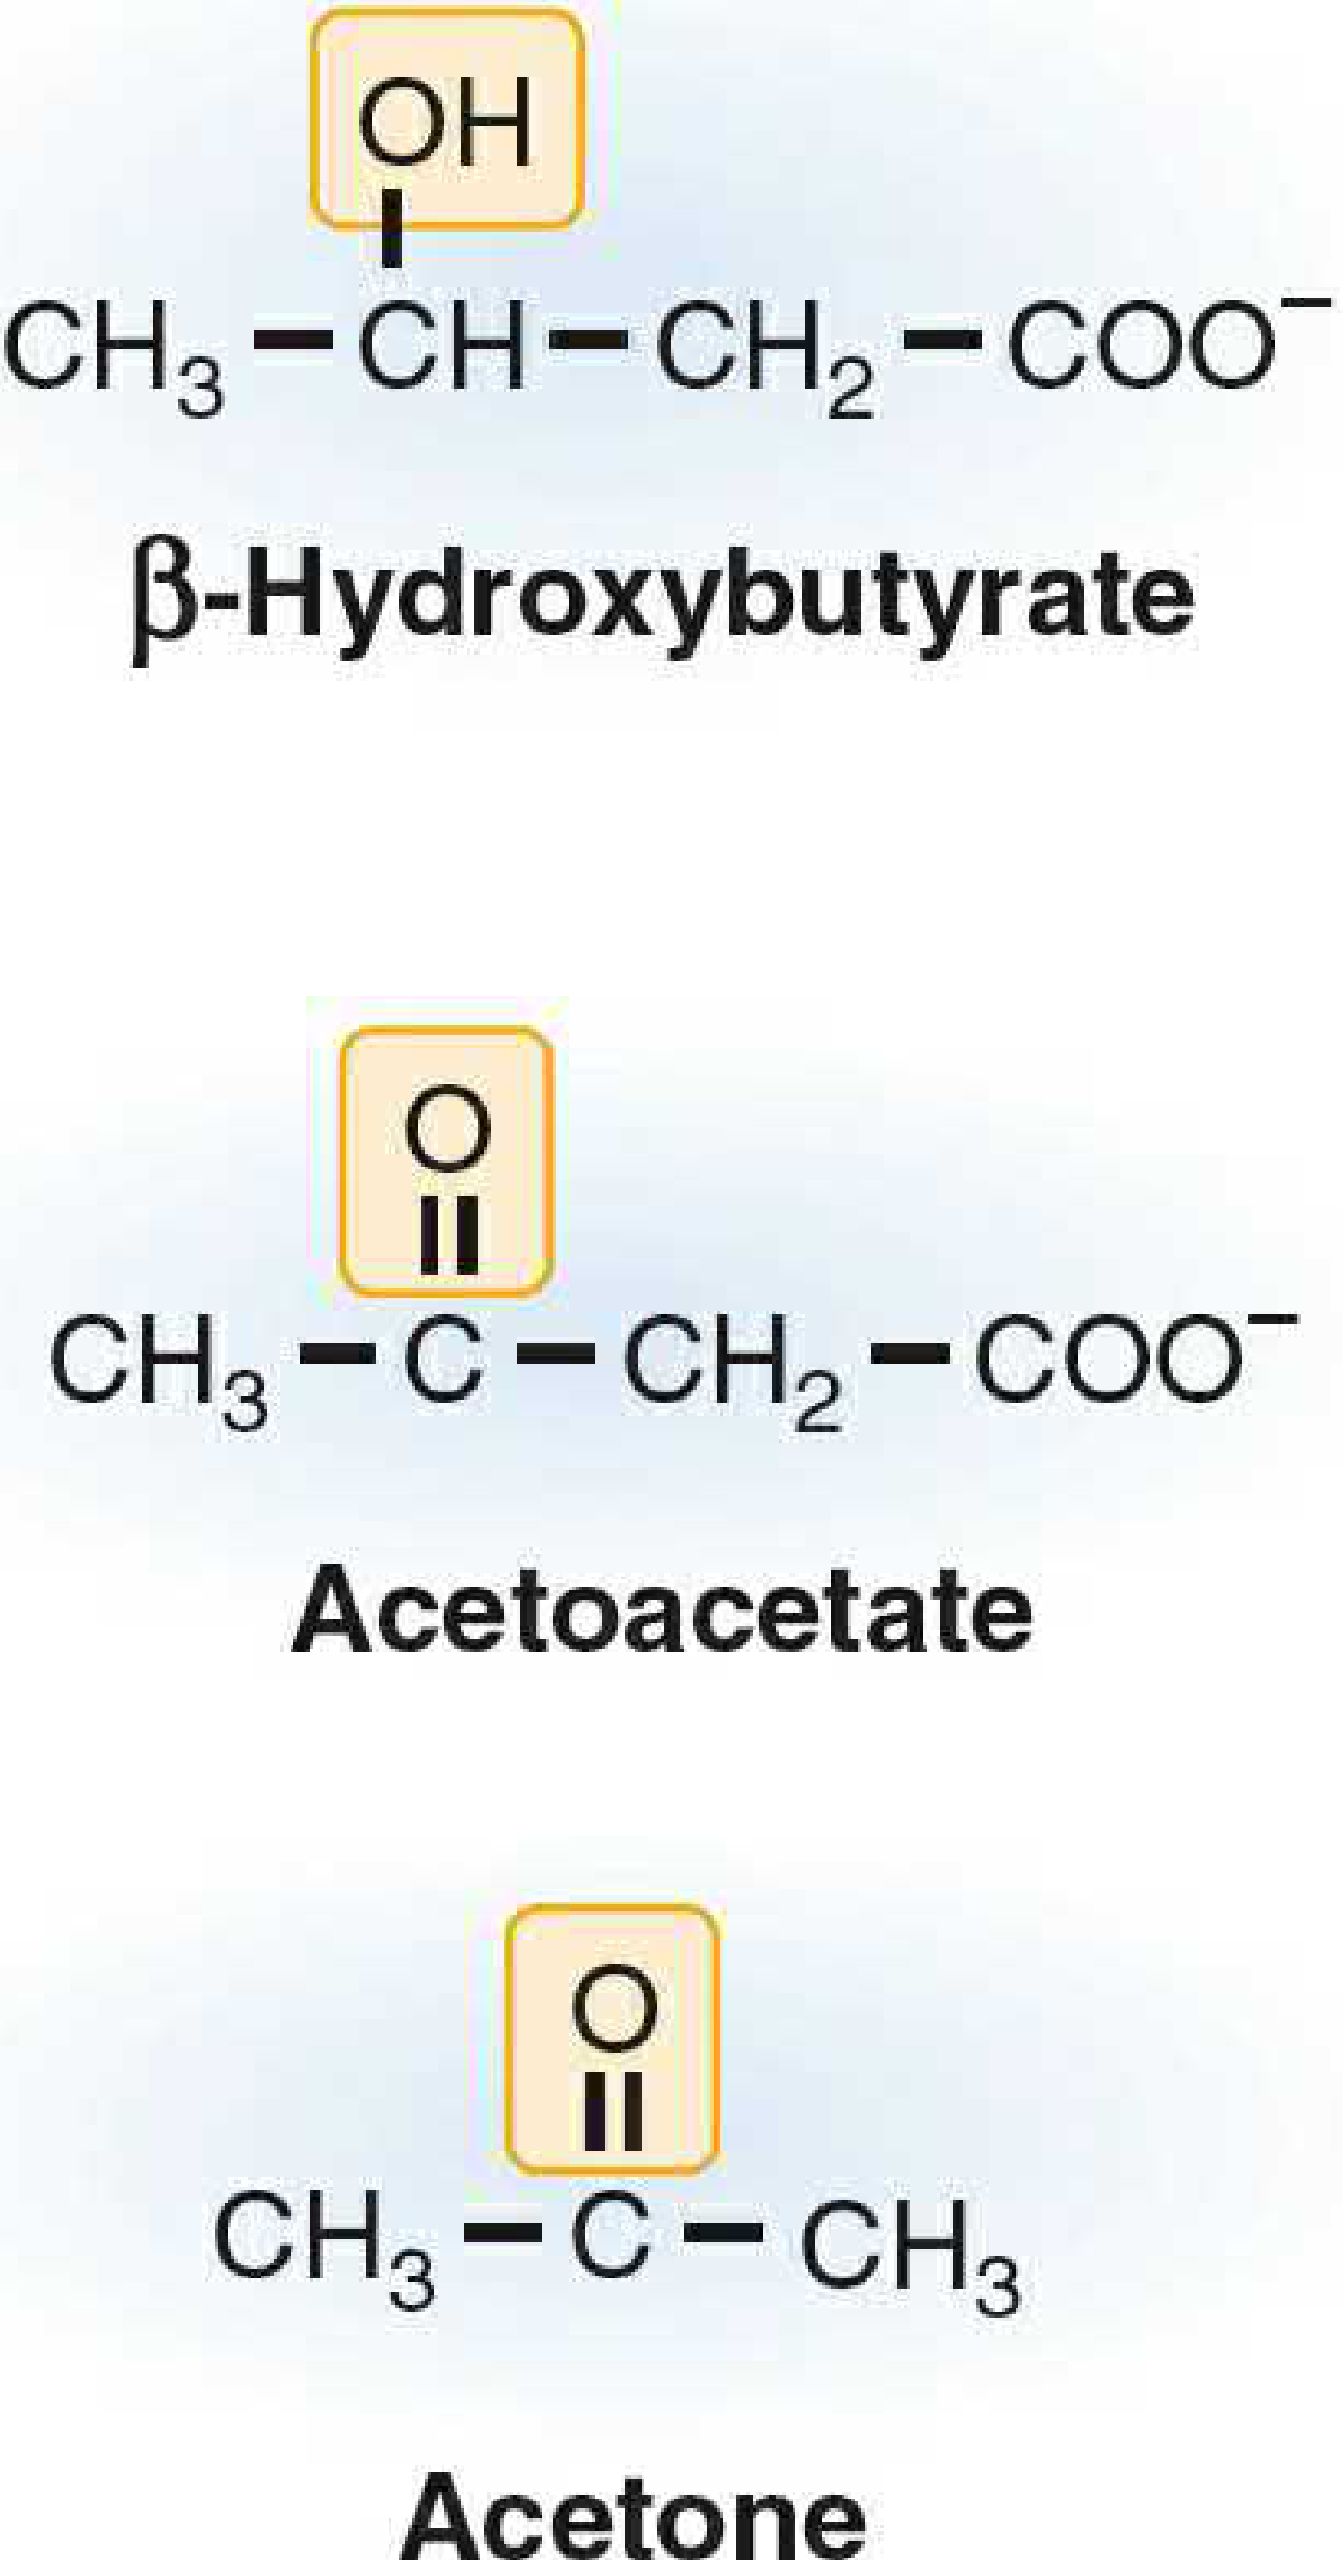
- Three ketone bodies:
- Acetoacetate (organic acid; functional fuel)
- β-Hydroxybutyrate (3-hydroxybutyrate) - most abundant in blood; NOT technically a ketone!
- Acetone - volatile; non-metabolized; exhaled; "fruity breath" in DKA
- Normal blood ketones: <0.2 mM (fed state)
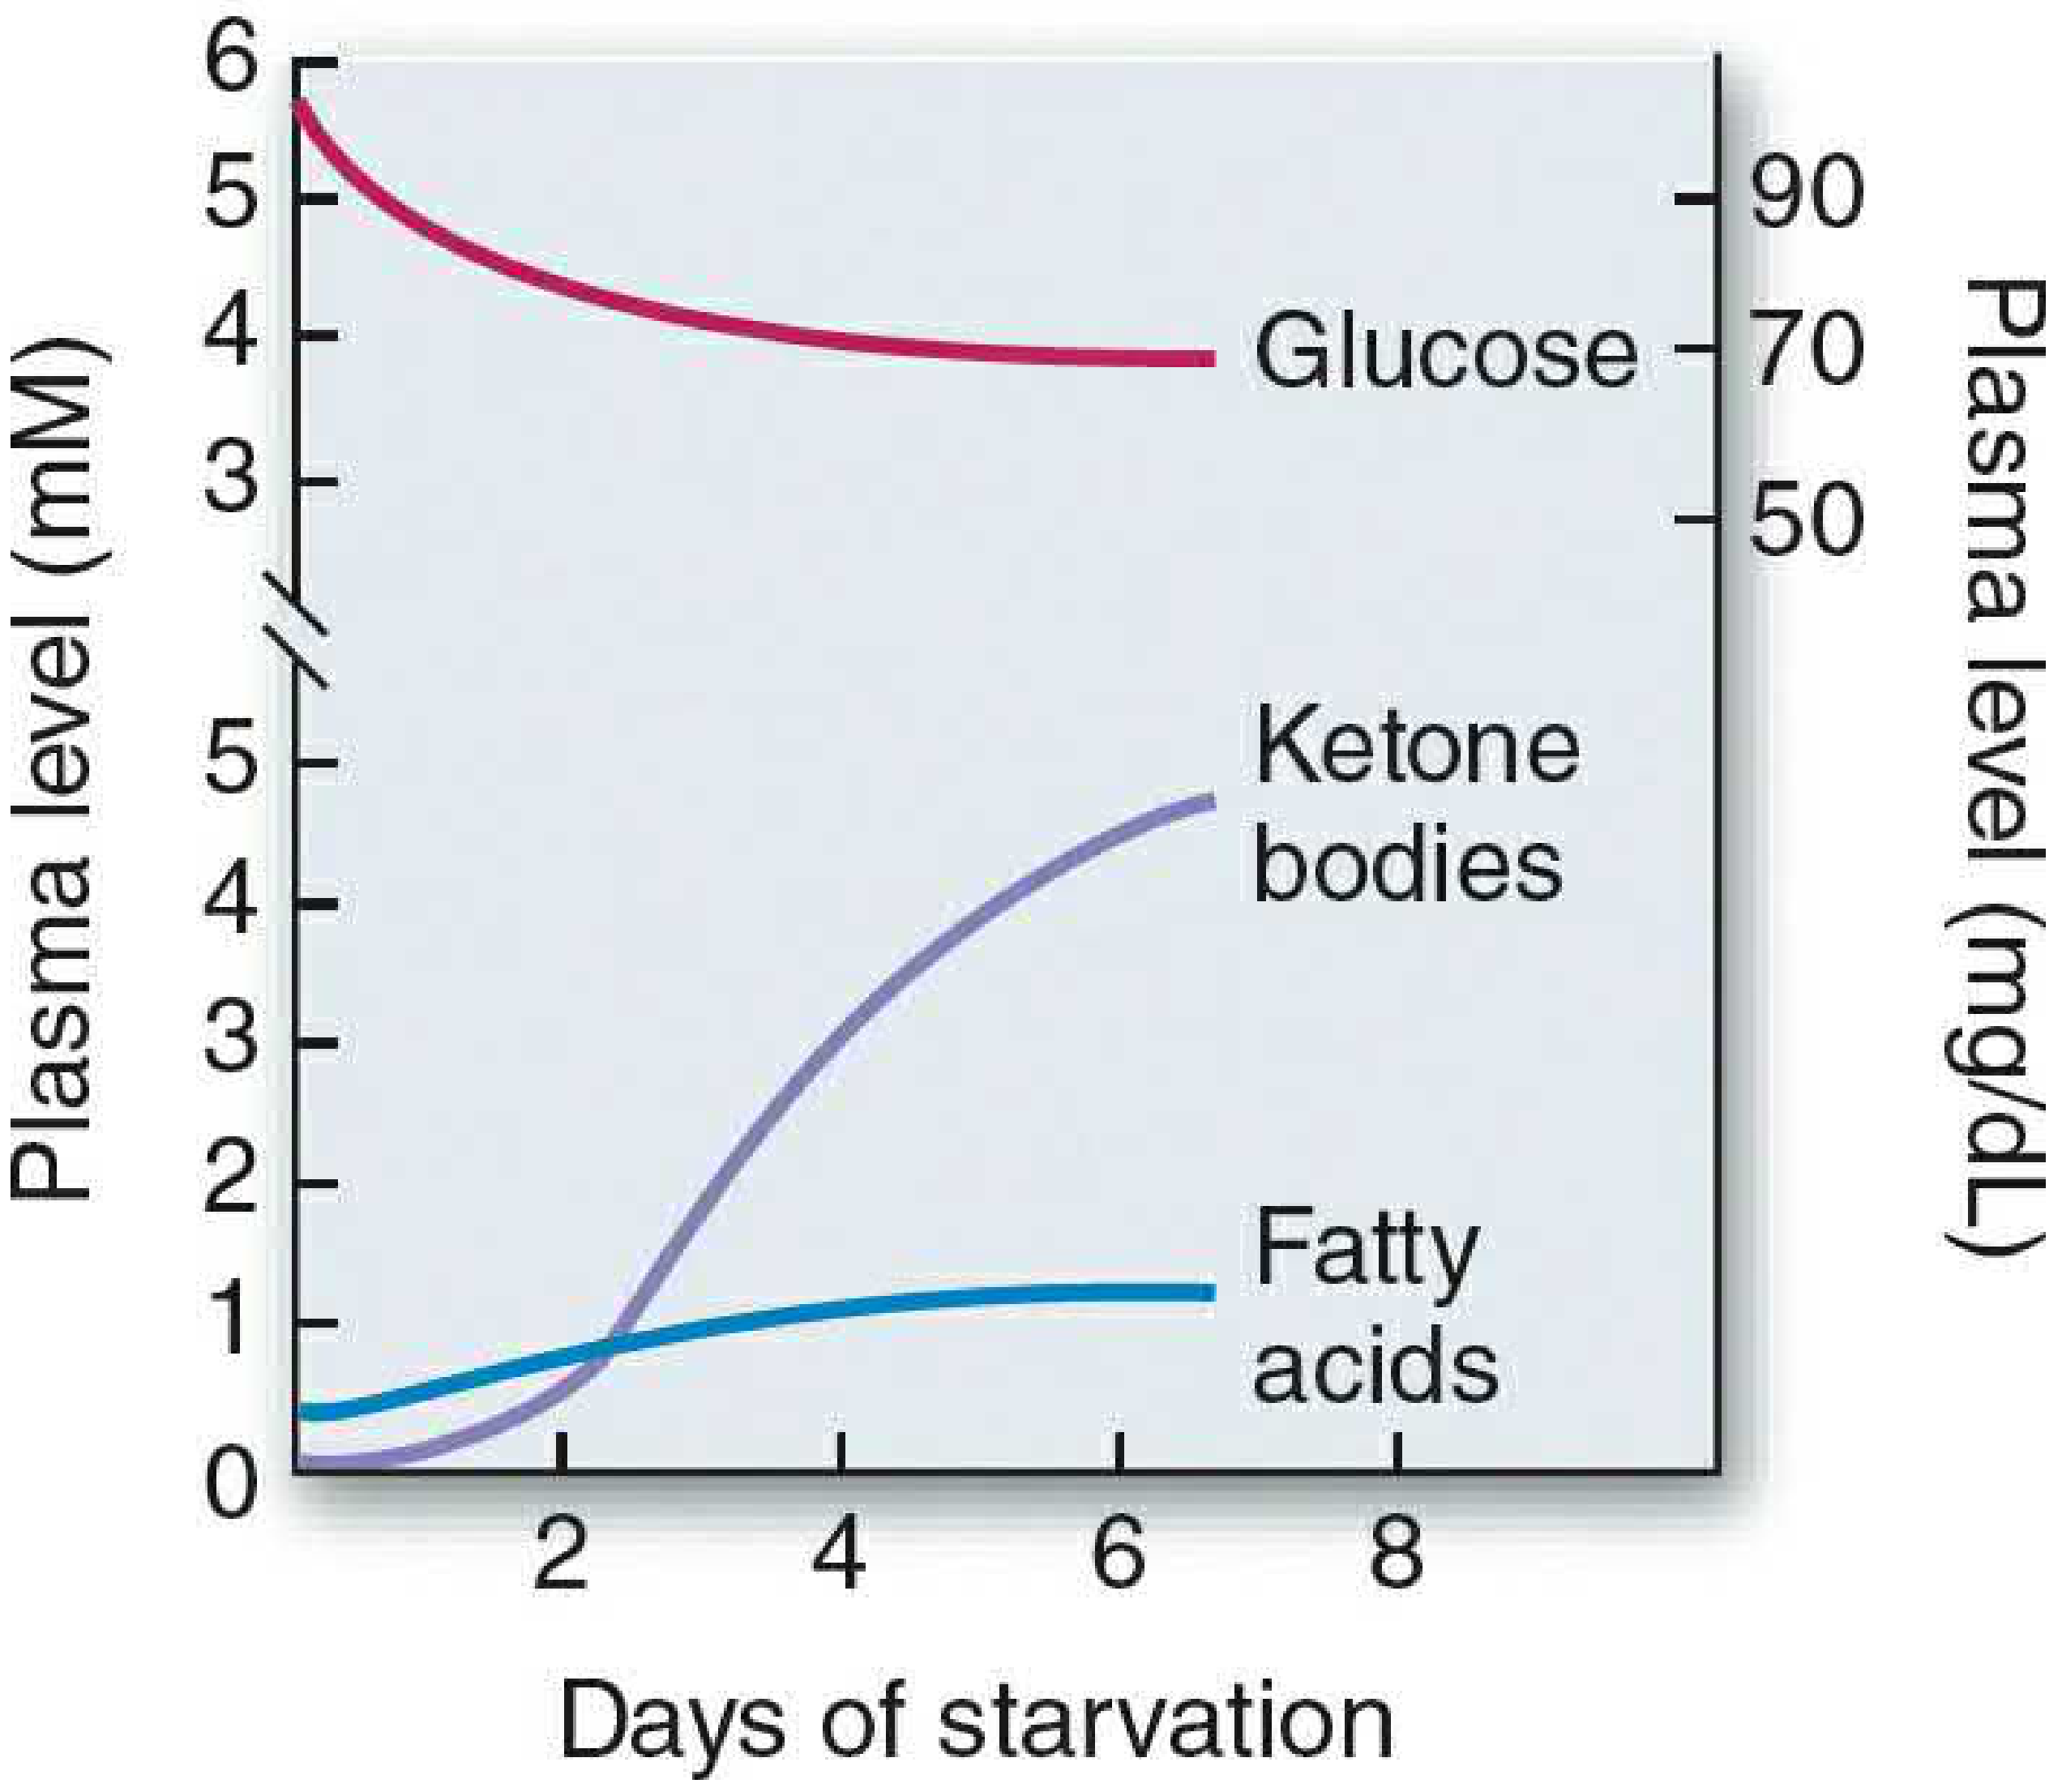
- Prolonged fasting: 4-5 mM; DKA: 8-15 mM
A. CONDITIONS FAVORING KETOGENESIS
- Low insulin / High glucagon ratio (fasting, starvation, uncontrolled diabetes)
- Elevated plasma FFA from adipose lipolysis
- High hepatic acetyl-CoA (from β-oxidation) that overwhelms TCA cycle capacity
- Decreased OAA availability - diverted to gluconeogenesis; high NADH from β-oxidation shifts OAA → malate
- Decreased malonyl-CoA (low ACC activity) → CPT-I released from inhibition → FA enter mitochondria freely
B. SYNTHESIS OF KETONE BODIES (KETOGENESIS) - Liver Mitochondria Only
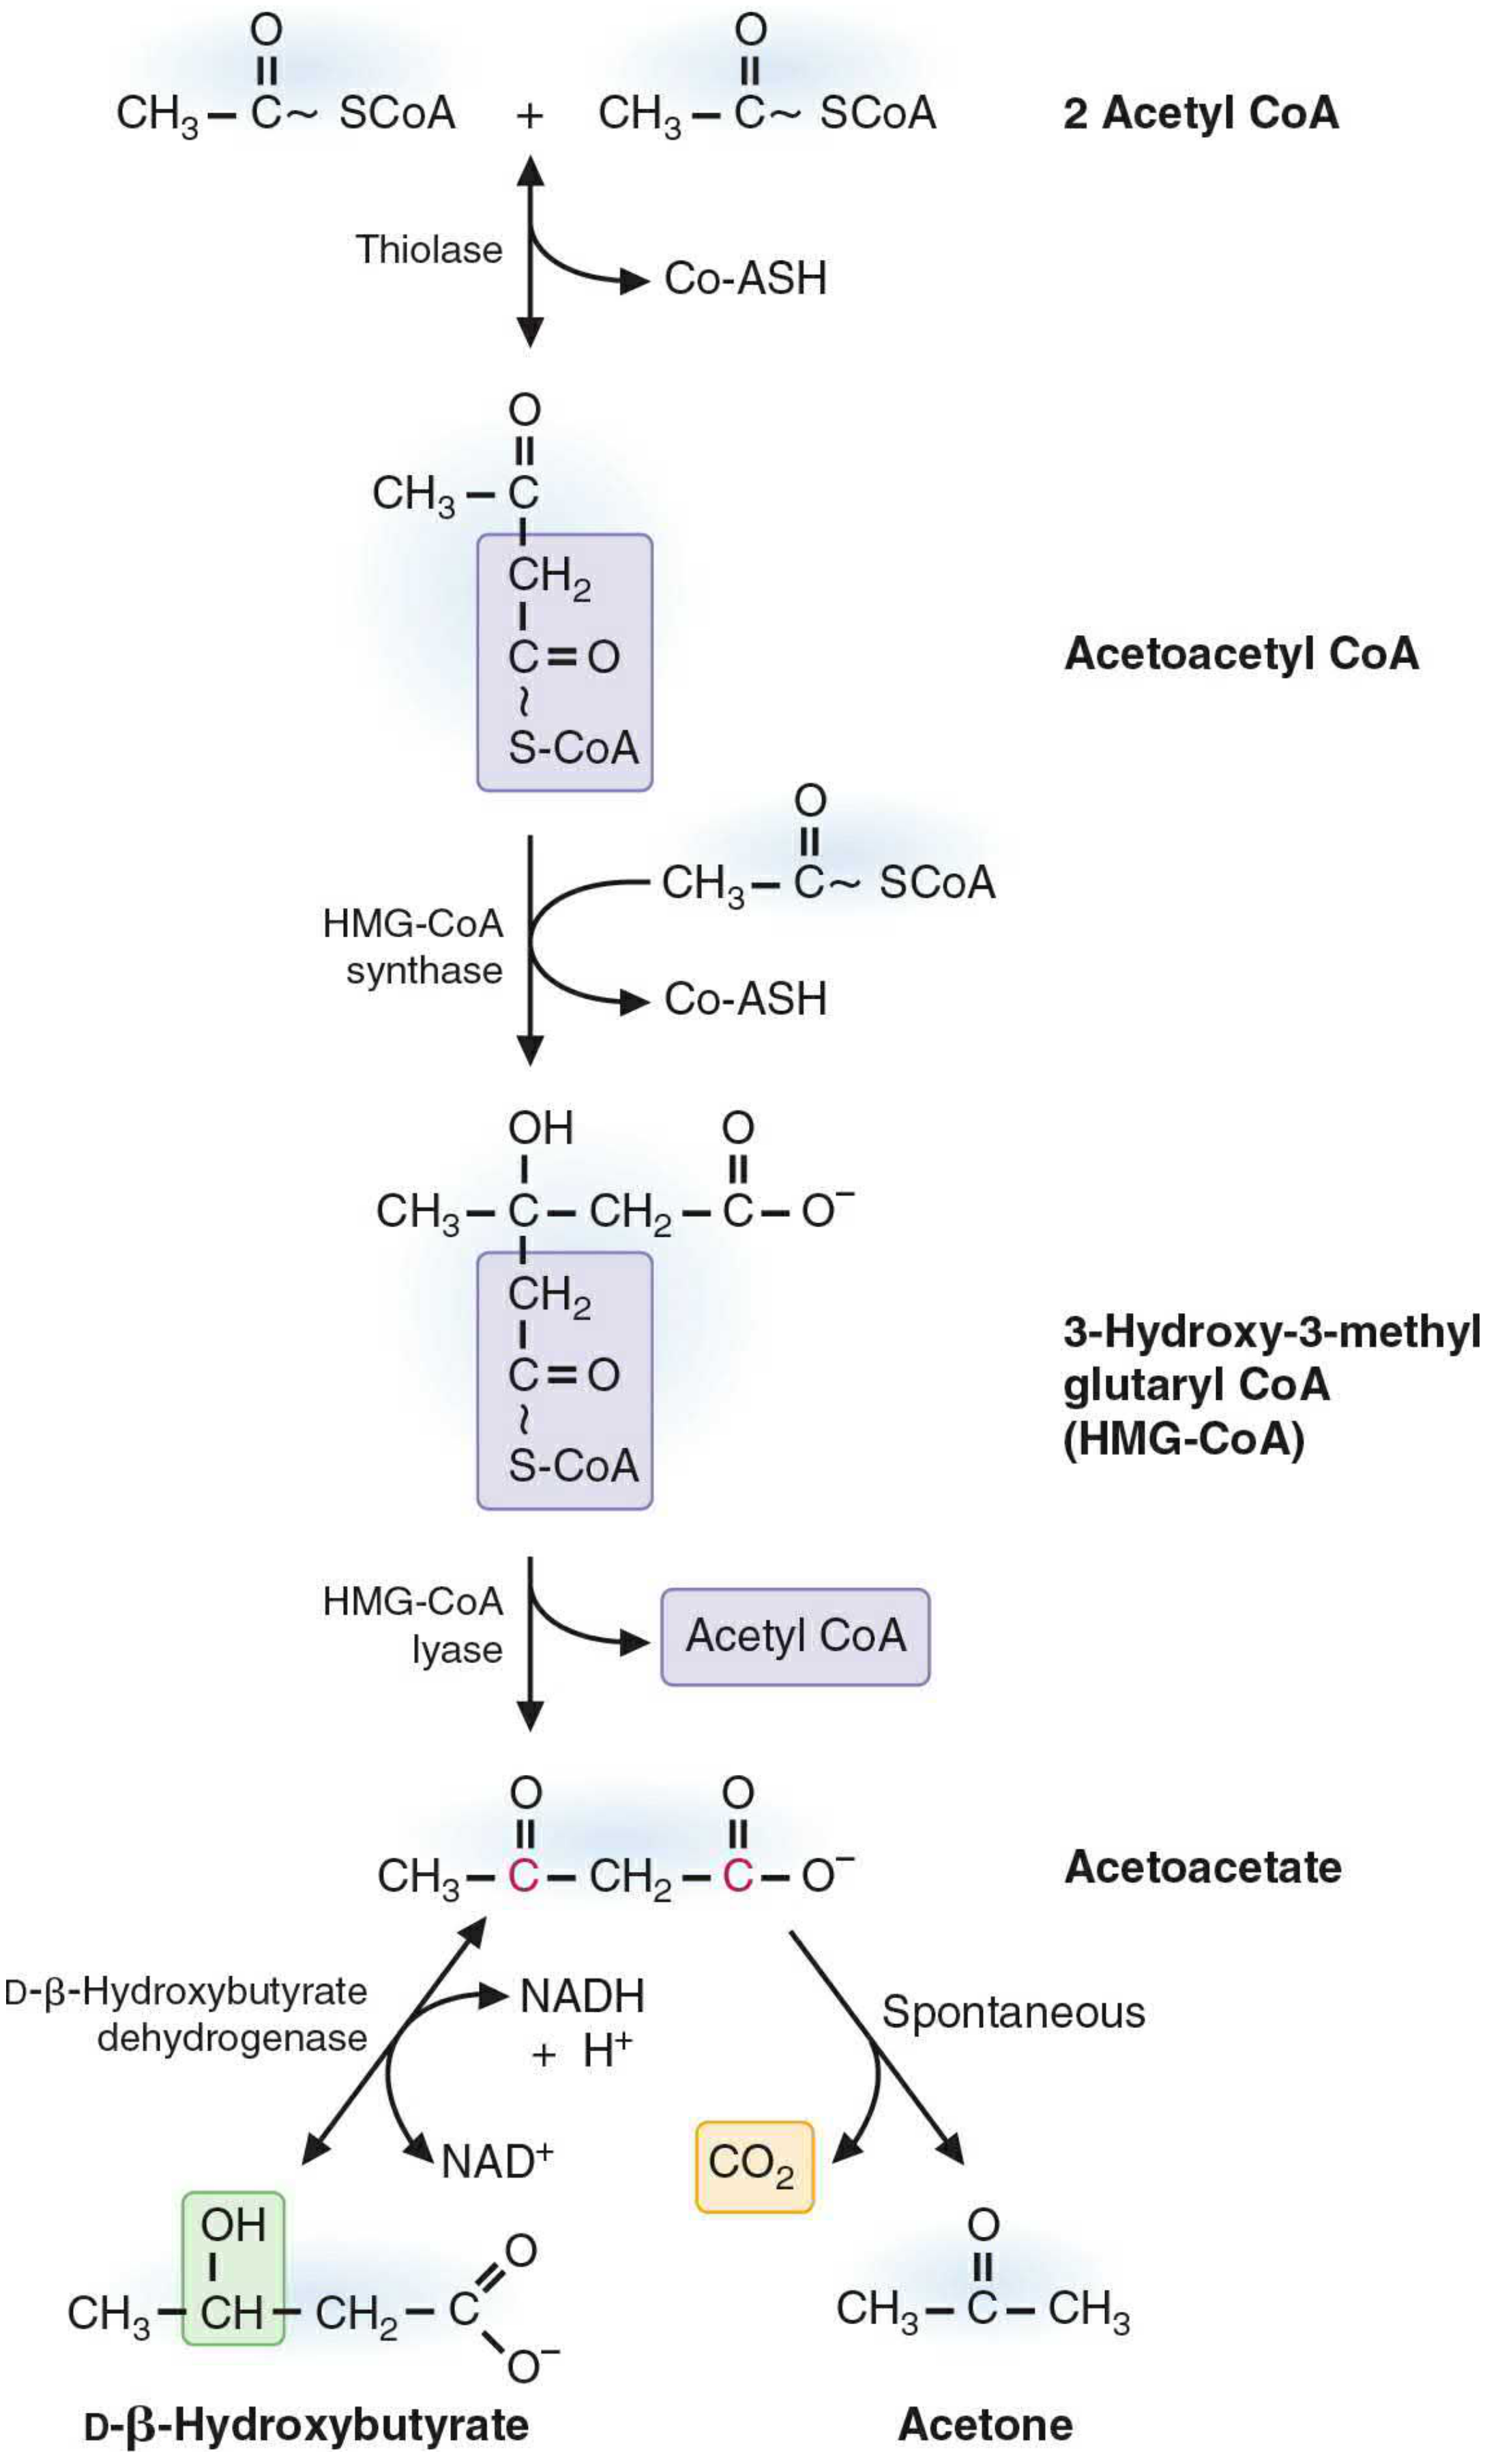
- Step 1: 2 Acetyl-CoA → Acetoacetyl-CoA + CoA (thiolase, reversal)
- Step 2 (Rate-Limiting): Acetoacetyl-CoA + Acetyl-CoA → HMG-CoA (3-Hydroxy-3-Methylglutaryl-CoA)
Enzyme: Mitochondrial HMG-CoA synthase - present in significant amounts only in liver (this is why only liver makes ketone bodies)
- Step 3: HMG-CoA → Acetoacetate + Acetyl-CoA
Enzyme: HMG-CoA lyase
- Step 4a (Reduction): Acetoacetate + NADH → β-Hydroxybutyrate + NAD⁺
Enzyme: β-Hydroxybutyrate dehydrogenase (D-specific)
During active β-oxidation: high NADH → β-OH predominates (ratio ~3:1 β-OH:acetoacetate)
- Step 4b (Spontaneous): Acetoacetate → Acetone + CO₂ (nonenzymatic decarboxylation; explains fruity odor)
C. UTILIZATION OF KETONE BODIES (Extrahepatic Tissues)
- Tissues that USE ketone bodies: Skeletal muscle, heart, brain (prolonged starvation), kidney cortex, intestinal mucosa
- Tissues that CANNOT use ketone bodies:
- Liver - lacks succinyl-CoA acetoacetate CoA transferase (thiophorase)
- RBC - no mitochondria
- Step 1 (in extrahepatic tissue): β-Hydroxybutyrate + NAD⁺ → Acetoacetate + NADH
- Step 2 (KEY STEP): Acetoacetate + Succinyl-CoA → Acetoacetyl-CoA + Succinate
Enzyme: Succinyl-CoA acetoacetate CoA transferase (Thiophorase) - ABSENT in liver!
- Step 3: Acetoacetyl-CoA + CoA → 2 Acetyl-CoA (thiolase)
- 2 Acetyl-CoA → TCA cycle → ATP
- Energy yield: 1 mol acetoacetate → ~19 ATP; 1 mol β-hydroxybutyrate → ~21.5 ATP
D. THREE CRUCIAL REGULATORY STEPS (Harper's)
- Control point 1: Lipolysis in adipose tissue → controls FFA supply to liver (regulated by insulin/glucagon/catecholamines)
- Control point 2: CPT-I activity → malonyl-CoA inhibits CPT-I; in fasting: malonyl-CoA falls → CPT-I active → β-oxidation ↑ → ketogenesis ↑
- Control point 3: OAA availability in TCA cycle: low OAA → acetyl-CoA cannot enter TCA → diverted to HMG-CoA → ketone bodies
E. KETOSIS AND KETOACIDOSIS
| State | Blood Ketones | Features |
|---|
| Normal fasting | <0.2 mM | Physiological |
| Prolonged fasting | 4-5 mM | Mild ketonemia |
| Ketosis | >2 mM | Fasting, low-carb diet |
| DKA (Type 1 DM) | 8-15 mM | Severe metabolic acidosis |
- DKA: Absolute insulin deficiency + excess glucagon → massive lipolysis + ketogenesis → plasma glucose >500 mg/dL → osmotic diuresis → dehydration
- Kussmaul respiration: Deep, rapid breathing to eliminate CO₂ and compensate for acidosis
- Fruity breath odor = exhaled acetone
F. PHYSIOLOGICAL IMPORTANCE
- Alternative fuel during starvation - brain uses ketone bodies (spares glucose for RBCs)
- After 2-3 days starvation: ketone bodies supply 60-70% of brain's energy → protein sparing (less gluconeogenesis needed → less muscle protein degradation → survival extended)
5. TRIGLYCERIDE (TG) SYNTHESIS (2 Marks - 8 Points)
- TAG synthesis occurs in liver (exports via VLDL) and adipose tissue (storage); also intestine (chylomicrons)
- Requires: Glycerol-3-phosphate (backbone) + Fatty acyl-CoA derivatives
- Glycerol-3-phosphate sources:
- Liver: From DHAP (glycolysis) OR free glycerol + ATP (glycerol kinase)
- Adipose: ONLY from DHAP; lacks glycerol kinase → can only make TG in fed state when glucose is available
- PATHWAY (via Phosphatidic Acid):
- Step 1: Glycerol-3-P + Acyl-CoA → Lysophosphatidic acid (GPAT; sn-1 position)
- Step 2: LPA + Acyl-CoA → Phosphatidic acid (LPAAT; sn-2; usually unsaturated FA)
- Step 3: PA → Diacylglycerol (DAG) + Pi (Phosphatidic acid phosphohydrolase/Lipin)
- Step 4: DAG + Acyl-CoA → Triacylglycerol (DGAT; sn-3; committed final step)
- Phosphatidic acid is the branch point - also precursor for all glycerophospholipids
- In intestine: 2-MAG pathway used (2-MAG + 2 FA-CoA → TAG via MAG acyltransferase + DGAT)
- Liver TAG packed with ApoB-100 → VLDL for export
- Fatty liver (hepatic steatosis): Occurs when TAG synthesis > VLDL secretion (e.g., in alcoholism: high NADH → ↑ glycerol-3-P → ↑ TG synthesis + ↓ β-oxidation + ↓ VLDL secretion)
6. METABOLISM IN STARVATION (2 Marks - 8 Points)
-
Timeline of starvation:
- 0-12 hours: Glycogenolysis; liver glycogen (80-300g) depleted in 20-30 hrs
- 12-40 hours: Gluconeogenesis becomes primary glucose source; fat mobilization begins
- After 3 days: Ketogenesis dominant; brain adapts to use ketone bodies
-
Hormonal changes: ↓ Insulin + ↑ Glucagon + ↑ Epinephrine/Cortisol → catabolic state
-
Liver: Glycogenolysis → Gluconeogenesis (from lactate, alanine, glycerol) → β-Oxidation → Ketogenesis
-
Adipose: Lipolysis activated (ATGL → HSL → MAG lipase); releases FFA (major fuel) + Glycerol (→ liver GNG)
-
Muscle: Oxidizes FA (spares glucose); releases alanine (→ liver GNG); Alanine-glucose (Cahill) cycle; also uses ketone bodies in prolonged starvation
-
Brain: Normal - uses only glucose; after 2-3 days - switches to ketone bodies; provides protein-sparing effect
-
RBC: Always require glucose (anaerobic glycolysis; no mitochondria); produce lactate → Cori cycle → liver gluconeogenesis
-
KEY CONCEPT - Protein Sparing: Brain switching to ketones → less GNG needed → less muscle proteolysis → survival extended; protein degradation: 75 g/day early → 20 g/day in prolonged starvation
SECTION 2: LIPOPROTEIN METABOLISM
7. METABOLISM OF LIPOPROTEINS (5 Marks Each - 15 Points Each)
LIPOPROTEIN PROPERTIES TABLE
| Lipoprotein | Density | Size | Electrophoresis | TG% | Function |
|---|
| Chylomicrons | <0.930 | 75-1200 nm | Origin | 80-95% | Dietary lipid transport |
| VLDL | 0.930-1.006 | 30-80 nm | Pre-β | 55-80% | Endogenous lipid transport |
| IDL | 1.006-1.019 | 25-35 nm | Slow pre-β | 20-50% | VLDL remnant → LDL |
| LDL | 1.019-1.063 | 18-25 nm | β | 5-15% | Cholesterol delivery to cells |
| HDL₂ | 1.063-1.125 | 9-12 nm | α | 5-10% | Reverse cholesterol transport |
A. CHYLOMICRONS (5 Marks - 15 Points)
Origin: Intestinal enterocytes (small intestine)
Function: Transport dietary (exogenous) lipids from intestine to peripheral tissues
- Synthesized in enterocytes from absorbed dietary lipids (long-chain FA, MAG, cholesterol)
- Core: TAG (80-95%), cholesteryl esters; Shell: Phospholipids + ApoB-48
- Requires MTP (Microsomal TG Transfer Protein) for assembly
- ApoB-48 is unique to intestinal chylomicrons (48% of ApoB-100 length; cannot bind LDL receptor)
- Released by exocytosis → lacteals (intestinal lymphatics) → thoracic duct → left subclavian vein (too large for capillaries)
- In circulation: acquire ApoE (enables liver receptor binding) and ApoCII (activates LPL) from HDL → becomes MATURE chylomicron
- LPL (Lipoprotein Lipase) on capillary endothelium of muscle and adipose tissue activated by ApoCII → hydrolyzes TAG → FFA + glycerol
- FFA taken up by: muscle (oxidized for energy) OR adipocytes (re-esterified to TAG for storage)
- As TAG depletes: chylomicron shrinks → surface components (ApoA, ApoCII, phospholipids) transferred back to HDL
- Resulting chylomicron remnant (retains ApoB-48 + ApoE; TAG mostly gone; cholesterol-enriched) taken up by liver via ApoE receptor (hepatic remnant receptor) → endocytosed → hydrolyzed
- Cholesterol from remnants used by liver for VLDL synthesis, bile acid synthesis, or recycled
- Half-life of chylomicrons: ~1 hour in circulation
- Postprandial hyperlipidemia: Normal transient rise in chylomicrons after a meal (plasma appears milky)
- Familial LPL deficiency (Type I HLP): LPL absent → chylomicrons cannot be cleared → severe hypertriglyceridemia → pancreatitis; treat with very low-fat diet
- Abetalipoproteinemia: ApoB-48 absent → chylomicrons not formed → fat-soluble vitamin deficiency, spinocerebellar degeneration
B. VLDL (Very-Low-Density Lipoprotein) (5 Marks - 15 Points)
Origin: Liver hepatocytes
Function: Transport endogenous (liver-synthesized) lipids to peripheral tissues
- Synthesized in liver when excess carbohydrate or fat is consumed → hepatic de novo lipogenesis → excess acetyl-CoA → TAG
- Composition: TAG (55-80%), cholesterol esters, phospholipids + ApoB-100 (major structural apo; full-length; binds LDL receptor)
- Requires MTP for assembly (lomitapide inhibits MTP → used in familial hypercholesterolemia)
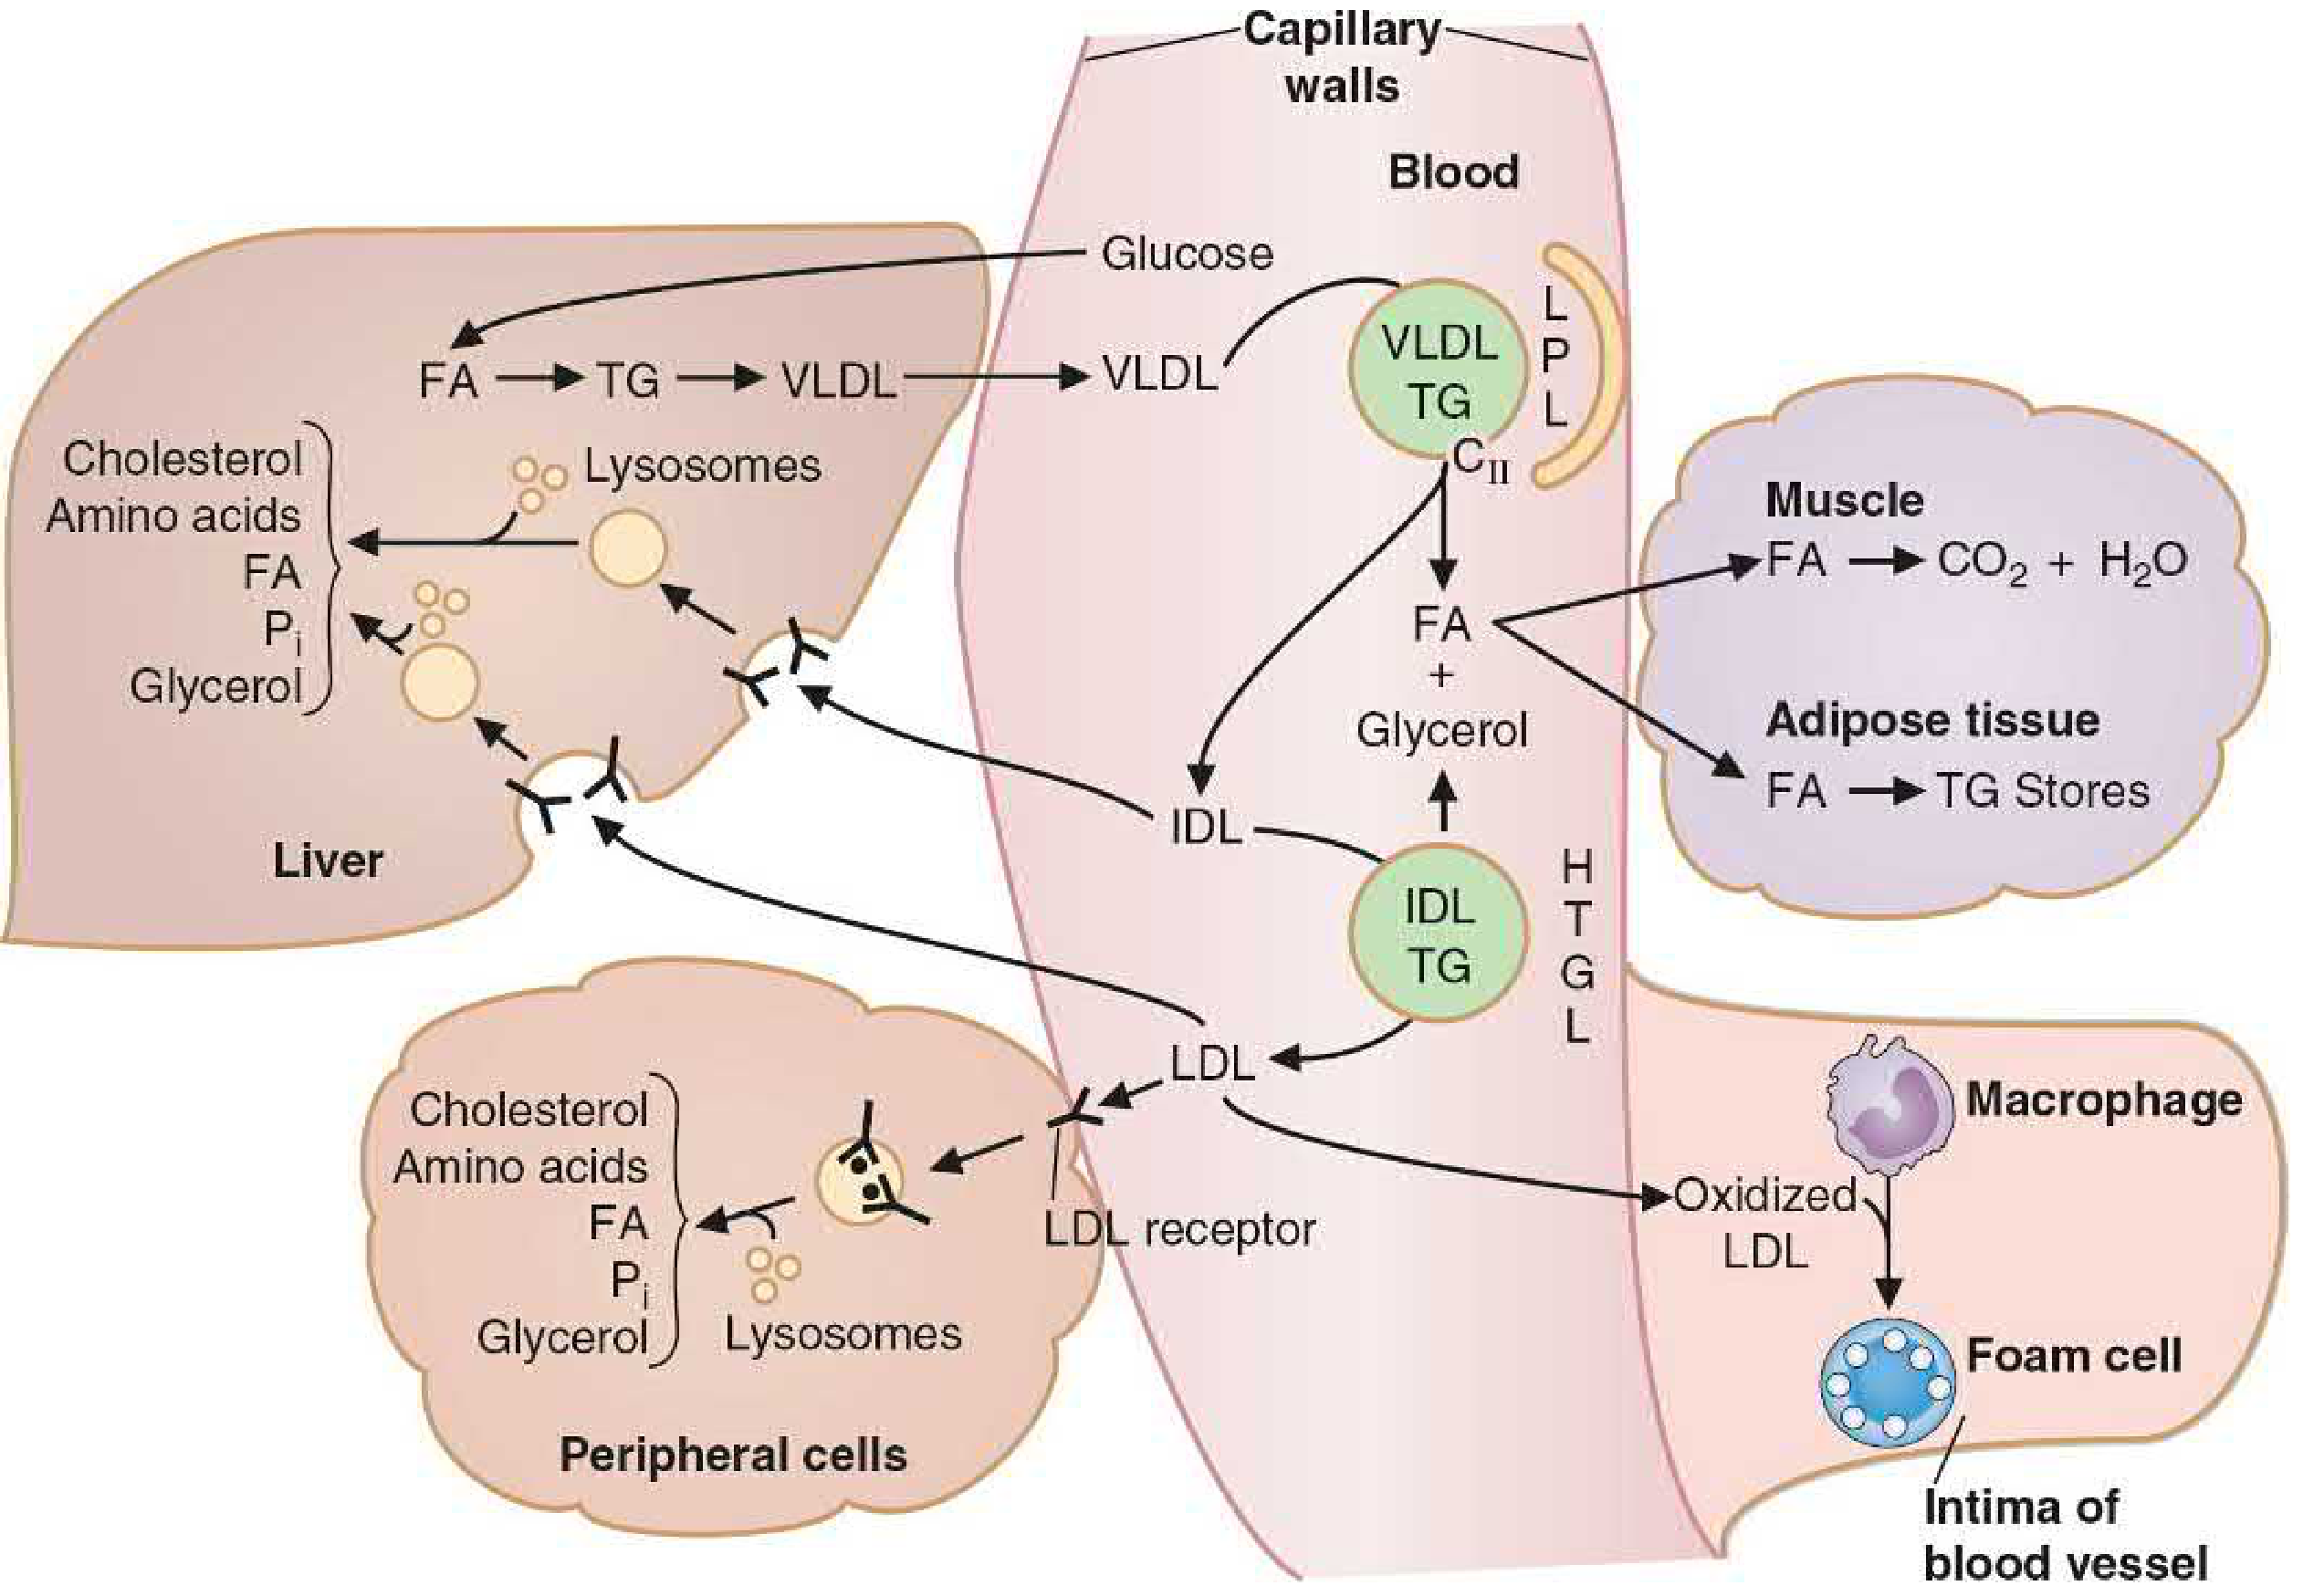
- Nascent VLDL secreted into bloodstream; acquires ApoE and ApoCII from circulating HDL → mature VLDL
- Transported to capillaries of skeletal muscle, cardiac muscle, adipose tissue
- LPL (activated by ApoCII) hydrolyzes VLDL TAG → FFA + glycerol
- FFA used by muscle (oxidation) or adipose (re-esterification to TAG for storage)
- As VLDL loses TAG → becomes IDL (Intermediate-Density Lipoprotein)
- ~50% of IDL cleared by liver via ApoE receptor (endocytosis)
- Remaining 50% of IDL further acted on by Hepatic Triglyceride Lipase (HTGL) → removes remaining TAG and phospholipids → becomes LDL (Low-Density Lipoprotein)
- LDL (ApoB-100 only; cholesterol-rich) → delivers cholesterol to peripheral cells via LDL receptor (ApoB-100/ApoE receptor)
- Excess LDL → oxidized LDL → taken up by macrophage scavenger receptors → foam cells → atherosclerosis
- Familial Combined Hyperlipidemia: ↑ ApoB-100 production → elevated VLDL + LDL + TG
- Type III Hyperlipoproteinemia (Dysbetalipoproteinemia): ApoE2 mutation → defective remnant clearance → IDL + chylomicron remnants accumulate
- Alcoholism → Fatty liver: High NADH (from ethanol oxidation) → ↑ glycerol-3-P → ↑ TG synthesis + ↓ FA oxidation + ↓ VLDL secretion → hepatic steatosis
C. HDL (High-Density Lipoprotein) (5 Marks - 15 Points)
Origin: Liver and intestine (nascent); assembled in plasma
Function: Reverse Cholesterol Transport (RCT) - transports cholesterol from peripheral tissues BACK to liver
- Nascent HDL (discoidal; "pre-β HDL") synthesized by liver and intestine; contains mainly ApoA-I (major structural apo of HDL) and phospholipids
- Also formed from surface remnants (ApoA, phospholipids) shed by chylomicrons and VLDL as they lose TAG
- ApoA-I activates LCAT (Lecithin-Cholesterol Acyltransferase) in plasma
- LCAT reaction: Lecithin (phosphatidylcholine) + free cholesterol → Cholesteryl ester + lysolecithin; cholesteryl ester is nonpolar → enters HDL core → HDL becomes spherical
- Free cholesterol collected from peripheral tissue membranes by:
- Passive aqueous diffusion down gradient
- SR-BI (Scavenger Receptor class B type I) on cells
- ABCA1 transporter (ATP-binding cassette transporter A1) - active efflux; Tangier disease = ABCA1 deficiency → no HDL → cholesterol accumulates in tissues
- As HDL accumulates cholesteryl esters → grows from HDL₃ (small, dense) → HDL₂ (large, buoyant)
- CETP (Cholesteryl Ester Transfer Protein): Transfers cholesteryl esters from HDL to VLDL/LDL in exchange for TG; HDL-C decreases; LDL-C increases
- Cholesterol delivered to liver via SR-BI receptor (selective uptake of cholesteryl esters without particle endocytosis) or after CETP transfer → via LDL receptor pathway
- Liver disposes cholesterol as bile acids or free cholesterol in bile
- HDL-C is inversely related to cardiovascular risk (higher HDL = more efficient RCT = less atherosclerosis)
- ApoA-I is the most important antiatherogenic apolipoprotein; activates LCAT; promotes RCT
- HDL also donates ApoE and ApoCII to nascent chylomicrons and VLDL in circulation
- Tangier disease: ABCA1 deficiency → no cholesterol efflux from cells → almost no HDL → cholesterol accumulates in tissues (tonsils turn orange) → premature atherosclerosis
- LCAT deficiency: No cholesteryl ester formation in HDL → HDL unstable → rapidly catabolized → very low HDL; corneal opacification, hemolytic anemia
- Drugs increasing HDL: Niacin (most effective), fibrates, exercise, statins (modest increase); CETP inhibitors (increase HDL but some failed to reduce CVD events)
SECTION 3: LIVER FUNCTION TESTS
8. VAN DEN BERGH REACTION (5 Marks - 15 Points)
Background - Bilirubin Metabolism
Before understanding the test, understand bilirubin:
- Bilirubin is the end product of heme catabolism (from hemoglobin, myoglobin, cytochromes)
- Heme → Biliverdin (heme oxygenase) → Unconjugated Bilirubin (biliverdin reductase)
- Unconjugated bilirubin (UCB): Water-insoluble; bound to albumin in plasma; cannot be filtered by kidney; does NOT appear in urine; can cross blood-brain barrier (kernicterus in neonates)
- UCB taken up by liver → conjugated with glucuronic acid (by UDP-glucuronyl transferase, UGT1A1) → Conjugated bilirubin (CB) = bilirubin diglucuronide
- Conjugated bilirubin: Water-soluble; secreted into bile; CAN appear in urine if regurgitated into blood (dark urine)
- In intestine: CB → Urobilinogen (bacterial action) → Urobilin (in urine/feces) → Stercobilin (brown color of feces)
The Van Den Bergh Reaction (1916)
- Principle: Bilirubin reacts with diazo reagent (diazotized sulfanilic acid) → purple/red azobilirubin complex (measured spectrophotometrically at 540 nm)
- Direct Van Den Bergh reaction: Performed without adding alcohol → detects CONJUGATED bilirubin only (water-soluble; reacts directly with diazo reagent)
- Indirect Van Den Bergh reaction: Performed after adding methanol/ethanol → solubilizes unconjugated bilirubin → detects UNCONJUGATED bilirubin (calculated as: Total - Direct = Indirect)
- Total bilirubin = Direct (conjugated) + Indirect (unconjugated)
- Normal values: Total bilirubin: 0.2-1.0 mg/dL; Direct: 0-0.3 mg/dL; Indirect: 0.2-0.7 mg/dL
- Jaundice appears clinically when total bilirubin exceeds 2.5-3.0 mg/dL
TYPES OF JAUNDICE AND THEIR REPORTS
| Type | Pre-hepatic (Hemolytic) | Hepatic (Hepatocellular) | Post-hepatic (Obstructive) |
|---|
| Cause | Excess RBC destruction | Hepatocyte damage | Bile duct obstruction |
| Examples | Malaria, G6PD deficiency, sickle cell | Viral hepatitis, cirrhosis | Gallstones, pancreatic cancer, cholestasis |
| Serum Unconjugated Bil | ↑↑↑ | ↑↑ | Normal |
| Serum Conjugated Bil | Normal | ↑↑ | ↑↑↑ |
| Urine Bilirubin | Absent (acholuric jaundice) | Present (mild) | Present (dark urine) |
| Urine Urobilinogen | ↑↑↑ (excess) | ↑ or ↓ | Absent |
| Stool Color | Normal/dark | Pale | Clay-colored (acholic stool) |
| ALT/AST | Normal | ↑↑↑ | Mildly ↑ |
| Alkaline Phosphatase | Normal | ↑ | ↑↑↑ |
| Van Den Bergh | Indirect +ve | Both +ve | Direct +ve |
- Conjugated bilirubin in urine = bilirubinuria = always pathological
- Absent urine urobilinogen in obstructive jaundice = bile cannot reach intestine = no urobilinogen formed
- Neonatal jaundice: UCB rises (UGT1A1 not fully active at birth + high RBC turnover) → phototherapy converts UCB to water-soluble isomers for excretion; if severe → kernicterus (UCB crosses BBB → brain damage)
9. GALACTOSE TOLERANCE TEST (5 Marks - 15 Points)
Background - Galactose Metabolism
- Galactose is derived primarily from lactose (milk sugar; lactase → glucose + galactose)
- Normal galactose metabolism:
- Galactose → Galactose-1-phosphate (Galactokinase + ATP)
- Galactose-1-P + UDP-Glucose ⇌ UDP-Galactose + Glucose-1-P (Gal-1-P Uridyl Transferase = GPUT)
- UDP-Galactose ⇌ UDP-Glucose (UDP-Galactose-4-epimerase)
- Glucose-1-P → Glucose-6-P → Glycolysis
- Liver is the primary organ for galactose metabolism (has galactokinase + GPUT)
The Galactose Tolerance Test (Bauer's Test)
- Principle: The liver's ability to remove galactose from blood is a measure of hepatocellular function and liver blood flow
- Procedure:
- Patient fasts overnight
- Oral galactose given: 40 g in 200 mL water (oral GTT) OR IV: 0.5 g/kg body weight
- Blood samples drawn at 30, 60, 90, 120 minutes
- Urine collected for 5 hours (galactosuria measured)
- Normal result: Blood galactose returns to normal by 2 hours; Urine galactose <3 g in 5 hours (oral test)
- Abnormal result (liver disease): Blood galactose elevated beyond 2 hours; urine galactose >3 g/5 hours
- Principle behind sensitivity: Since liver removes galactose efficiently (even with 20-30% hepatocyte loss), abnormal GTT indicates significant liver damage
- Results in disease:
- Hepatocellular damage (hepatitis, cirrhosis): Delayed clearance; excess galactosuria
- Obstructive jaundice: Usually normal (liver cells intact)
- Therefore, GTT helps distinguish hepatocellular from obstructive jaundice
- Galactosemia (inherited): GPUT deficiency → Gal-1-P accumulates → cataracts, mental retardation, jaundice, E. coli sepsis in neonates; screen: Guthrie test (positive for reducing sugar in urine by Benedict's but negative with glucose oxidase strip)
- Classic galactosemia: Autosomal recessive; GPUT deficiency; most severe form
- Galactokinase deficiency: Galactose → galactitol (aldose reductase) → accumulates in lens → cataracts only (no mental retardation)
- Uses of test: Early detection of hepatocellular damage; assess liver reserve before surgery; monitor progress of liver disease treatment
- IV galactose test is more accurate than oral (avoids absorption variability)
- Limitation: Replaced in modern practice by serum aminotransferases (ALT/AST) and imaging, but still conceptually important
10. TESTS FOR HEPATOCELLULAR DAMAGE (2 Marks - 8 Points)
Tests that detect damage/necrosis of liver parenchyma (hepatocytes):
- Serum ALT (Alanine Aminotransferase, SGPT): Most specific marker of hepatocellular damage; elevated several days BEFORE jaundice appears; rises first in viral hepatitis; normal: 7-56 U/L
- Serum AST (Aspartate Aminotransferase, SGOT): Less specific (also elevated in heart/muscle damage); normal: 10-40 U/L; AST:ALT ratio >2:1 suggests alcoholic hepatitis
- Serum LDH (Lactate Dehydrogenase): Elevated in hepatocellular damage; not specific (also elevated in hemolysis, MI, muscle damage)
- Serum Alkaline Phosphatase (ALP): Elevated in obstructive jaundice more than hepatocellular damage; also high in bone disease
- Serum Gamma-GT (GGT): Elevated in alcoholic liver disease; sensitive marker of alcohol abuse; also elevated in obstructive disease
- Prothrombin Time (PT): Prolonged in acute liver damage (liver synthesizes clotting factors II, VII, IX, X - vitamin K dependent); sensitive indicator of hepatic synthetic function
- Serum Albumin: Low in chronic liver disease (cirrhosis) → reflects impaired hepatic synthetic function; normal: 3.5-5.0 g/dL
- Serum Total Protein and A:G Ratio: Total protein may be normal but albumin falls and globulins rise → A:G ratio reverses (<1:1) in cirrhosis; normally A:G ~1.5-2.5:1
11. BSP EXCRETION TEST (Bromsulphalein Test) (2 Marks - 8 Points)
- BSP (Bromsulphthalein/Sulfobromophthalein): Synthetic organic dye; used to test liver's ability to remove and excrete foreign compounds from blood
- Principle: Like bilirubin, BSP is taken up by hepatocytes, conjugated with glutathione, and excreted into bile. This tests all steps of hepatic excretion
- Procedure:
- Inject 5 mg/kg BSP IV as a single bolus
- Collect blood at 45 minutes post-injection
- Normal: <10% BSP retained at 45 minutes (i.e., >90% cleared)
- Abnormal: >10% retention = impaired hepatic excretion
- Results:
- Hepatocellular damage (hepatitis, cirrhosis): ↑ BSP retention (>10%)
- Obstructive jaundice: ↑ BSP retention (bile cannot flow)
- Dubin-Johnson syndrome: BSP retention initially normal then RISES after 45 min (90-120 min) due to reflux back from hepatocytes → characteristic late rise pattern
- Rotor syndrome: Persistent BSP retention without secondary rise (unlike DJS)
- Sensitivity: More sensitive than bilirubin for early hepatocellular damage
- Status: Now largely obsolete in clinical practice (replaced by serum aminotransferases) due to risk of anaphylactic reactions; mainly historical/exam importance
SECTION 4: RENAL FUNCTION TESTS
12. CREATININE CLEARANCE TEST (5 Marks - 15 Points)
Background
- Creatinine is the end product of creatine/phosphocreatine metabolism in muscle
- Creatinine is freely filtered at the glomerulus, not reabsorbed by tubules, and only minimally secreted (small amount) → makes it a nearly ideal marker of GFR
- Blood creatinine is more specific than urea (urea affected by diet, hydration, urea cycle activity)
- Serum creatinine levels only significantly rise when GFR has fallen ~50% → poor sensitivity for early disease; creatinine clearance is more sensitive
The Test
- Principle: Clearance = volume of plasma completely cleared of a substance by kidneys per unit time
- Formula:
Creatinine Clearance (Ccr) = (Ucr × V) / Pcr (mL/min)
- Ucr = urinary creatinine concentration (mg/dL or mmol/L)
- V = urine flow rate (mL/min) = 24h urine volume ÷ 1440 min
- Pcr = plasma (serum) creatinine concentration
- 24-hour urine collection required for accuracy (complete collection critical)
- Normal values: Males: 97-137 mL/min; Females: 88-128 mL/min (lower due to less muscle mass)
- Corrected to standard body surface area: 1.73 m² (for comparing across body sizes)
- Creatinine clearance ≈ GFR (slight overestimate due to tubular secretion of creatinine)
- For true GFR: Inulin clearance (gold standard - exogenous; freely filtered; not secreted or reabsorbed; but requires IV infusion - not practical clinically)
Interpretation
- Mild reduction (60-89 mL/min): Early CKD - increased creatinine secretion compensates; serum creatinine still near normal
- Moderate reduction (30-59 mL/min): CKD Stage 3; serum creatinine clearly elevated
- Severe reduction (<30 mL/min): CKD Stage 4-5; approaching renal replacement therapy threshold
- Estimated GFR (eGFR): Calculated from serum creatinine using MDRD formula or CKD-EPI equation (accounts for age, sex, race) → widely used in clinical practice instead of measured Ccr
13. UREA CLEARANCE TEST (5 Marks - 15 Points)
Background
- Urea is the end product of protein/amino acid catabolism; formed in liver urea cycle
- Urea is freely filtered at glomerulus; 40-50% passively reabsorbed in tubules (especially when urine flow is slow) → makes urea clearance an underestimate of GFR
- BUN (Blood Urea Nitrogen) normal: 8-20 mg/dL (or BUN/creatinine ratio ~10:1; elevated ratio suggests pre-renal azotemia)
- Urea clearance is affected by many non-renal factors: high-protein diet, dehydration, GI bleeding, catabolic states (all raise BUN without kidney disease = pre-renal)
The Test
- Procedure:
- Patient drinks 300-500 mL water (to ensure adequate urine flow)
- Urine collected at exactly 1-hour intervals (two consecutive 1-hour collections)
- Blood drawn at mid-point of collection
- Two types based on urine flow:
- If urine flow >2 mL/min: Use Maximum Urea Clearance (Cm) formula
- If urine flow <2 mL/min: Use Standard Urea Clearance (Cs) formula
- Maximum Clearance (Cm) formula:
Cm = (U × V) / B mL/min
- Normal: 64-100 mL/min (approx. 75% of inulin clearance)
- Standard Clearance (Cs) formula (for low urine flow):
Cs = (U × √V) / B mL/min
- The √V correction accounts for the fact that urea reabsorption is proportional to flow
- Normal: 40-65 mL/min
- Expressed as % of normal values: >80% = normal renal function
- Pre-renal azotemia: BUN elevated but creatinine less elevated → BUN/Cr ratio >20:1 (dehydration, heart failure, GI bleed)
- Renal azotemia: Both BUN and creatinine elevated proportionally → intrinsic renal disease
- Post-renal azotemia: Both elevated → obstruction of urinary tract
- Advantages of urea clearance: Simple, cheap, can be done with standard labs; no special substance required
- Disadvantages: Underestimates GFR (tubular reabsorption); affected by diet; flow-dependent; less accurate than creatinine clearance
- In clinical practice, creatinine clearance or eGFR have largely replaced urea clearance as the preferred GFR estimate, but urea clearance remains important in examining renal tubular reabsorption and in assessing dialysis adequacy (Kt/V)
14. TESTS FOR TUBULAR FUNCTION (5 Marks - 15 Points)
The renal tubule has two functions: Reabsorption and Secretion. Tests assess each.
A. TESTS OF TUBULAR REABSORPTION
1. Glucose Tolerance/Renal Threshold Test
- Glucose freely filtered; completely reabsorbed up to plasma glucose of ~180 mg/dL (Renal Threshold for Glucose, RTG = Tm for glucose / GFR)
- Beyond RTG → glucose appears in urine (glucosuria); used to detect diabetes, or tubular defect (Fanconi syndrome where RTG is abnormally low)
2. Phosphate Reabsorption
3. Tubular Maximum for Phosphate (TmP/GFR): Measures parathyroid hormone effect on tubular phosphate reabsorption
4. Low TmP/GFR = excess PTH or renal tubular defect
3. Amino Acid Absorption
5. Proximal tubule reabsorbs essentially all amino acids; amino acids in urine = tubular defect
6. Fanconi Syndrome: Generalized proximal tubule defect → glucosuria + aminoaciduria + phosphaturia + uricosuria + bicarbonaturia + low-molecular-weight proteinuria (all at normal blood levels)
B. TESTS OF TUBULAR SECRETION
4. Titratable Acidity and Ammonium Excretion
7. Distal tubule secretes H⁺ (tubular acidification); collect 24h urine and measure pH, titratable acid, ammonium
8. Urinary acidification test: Give NH₄Cl (acid load) → normal kidney acidifies urine to pH <5.3; failure = distal renal tubular acidosis (Type I RTA)
5. PAH (Para-Aminohippuric Acid) Clearance
9. PAH is both filtered AND secreted by proximal tubule → clearance ≈ Effective Renal Plasma Flow (ERPF) = 600 mL/min
10. PAH clearance tests tubular secretory capacity and renal plasma flow
6. Tubular Maximum (Tm) for Various Substances
11. Tm for glucose: ~375 mg/min in males; splay of glucose titration curve = heterogeneity of nephrons
12. Tm for PAH: ~80 mg/min; reduced in tubular disease
7. Concentration and Dilution Tests
13. Concentration test: Fluid deprive for 24h → measure urine specific gravity; normal: >1.025 (osmolality >800 mOsm/kg); failure = inability to concentrate = tubular/collecting duct dysfunction or ADH deficiency
14. Dilution test: Drink 20 mL/kg water in 30 min → normal: urine specific gravity falls to <1.002 within 2h; failure = inability to dilute = edema states or SIADH
15. Fishberg concentration test and Mosenthal test are classical concentration tests; urine specific gravity below 1.018 after overnight dehydration suggests tubular dysfunction
SECTION 5: NUTRITION
15. BMR - BASAL METABOLIC RATE (5 Marks - 15 Points)
- Definition: BMR is the minimum amount of energy required by the body to maintain basic life-sustaining functions at complete rest, in a thermoneutral environment, in the post-absorptive state (12-18h fasting)
- It represents energy for: breathing, circulation, brain activity, maintaining cell membrane gradients, body temperature
- Normal BMR: ~40 kcal/m²/hour (adult); ~1500-2000 kcal/day for average adult
- BMR accounts for ~60-70% of total daily energy expenditure (TDEE)
Methods of Measurement
- Direct Calorimetry: Measure actual heat produced by body in an insulated chamber; accurate but expensive and complex
- Indirect Calorimetry (standard clinical method): Measure O₂ consumed and CO₂ produced → calculate heat produced using Weir formula: BMR = 3.9(VO₂) + 1.1(VCO₂) kcal/min
- Harris-Benedict Equation (predictive):
- Males: BMR = 66 + (13.7 × weight in kg) + (5 × height in cm) - (6.8 × age)
- Females: BMR = 655 + (9.6 × weight) + (1.8 × height) - (4.7 × age)
Factors Affecting BMR
- Age: BMR highest in infancy/childhood; declines 2% per decade after age 30 (loss of lean body mass)
- Sex: Males have ~5-10% higher BMR than females (more lean muscle mass)
- Body surface area: BMR proportional to surface area (DuBois formula); surface area = 0.007184 × Ht⁰·⁷²⁵ × Wt⁰·⁴²⁵
- Thyroid hormones: T3/T4 most potent regulator; hyperthyroidism: BMR ↑ by 25-100%; hypothyroidism: BMR ↓ by 30-40%
- Temperature: Fever raises BMR ~13% per 1°C rise (Van't Hoff rule); cold environment also slightly raises BMR
- Nutritional state: Starvation lowers BMR (↓ T3 production; adaptive response)
- Exercise/muscle mass: More lean body mass = higher BMR; chronic exercise training increases BMR
- Drugs/hormones: Catecholamines (adrenaline) increase BMR; insulin decreases
16. SDA - SPECIFIC DYNAMIC ACTION (5 Marks - 15 Points)
- Definition: SDA (also called Thermic Effect of Food, TEF or Diet-Induced Thermogenesis, DIT) is the increase in metabolic rate (heat production) that occurs after ingestion of food, above the basal metabolic rate
- It represents the energy cost of digesting, absorbing, transporting, and metabolizing nutrients
- SDA accounts for ~10% of total daily energy expenditure
SDA Values for Different Nutrients
- Proteins: Have the highest SDA = 25-30% of energy ingested (high cost of deamination, urea cycle, protein synthesis)
- Carbohydrates: SDA = 5-10% of energy ingested (cost of glycolysis, glycogen synthesis, insulin signaling)
- Fats: Have the lowest SDA = 2-4% of energy ingested (FAs require minimal processing before storage or oxidation)
- Mixed diet: SDA ≈ 10% of total caloric intake
Mechanism
- Protein has highest SDA because: deamination of amino acids is energy-intensive; urea synthesis in liver requires ATP; induced protein synthesis is energy-costly
- Carbohydrates trigger insulin release → active glucose transport and glycogen synthesis → energy cost
- Fats are easily stored in adipose tissue without much metabolic processing → low energy cost
Duration and Significance
- SDA begins within 1 hour of eating and may last 6-8 hours after a mixed meal
- Peak SDA: Occurs within 2-3 hours post-meal
- Clinical relevance: In protein-energy malnutrition (PEM), SDA is reduced because metabolic machinery is compromised
- During fever: Already elevated metabolic rate → SDA effect less discernible
- Harris-Benedict principle: Total daily energy requirement = BMR + SDA (10%) + Activity component + Growth/Pregnancy/Lactation allowance
17. PEM / PCM (Protein-Energy / Protein-Calorie Malnutrition) (5 Marks - 15 Points)
- PEM (Protein-Energy Malnutrition) is the most common nutritional disorder worldwide; occurs when intake of both protein and calories is inadequate; predominantly affects children under 5
Two Classic Syndromes
-
MARASMUS:
- Primarily calorie (energy) deficiency with adequate proportional protein deficit
- Child looks like a "bag of bones"; wasted appearance
- Features: Severe wasting of muscle and fat; weight <60% of expected; no edema; alert but irritable; hair changes (sparse but retained)
- Metabolic: Low insulin + high glucagon + cortisol → fat mobilization + muscle wasting; body adapts (glucose homeostasis maintained by GNG from muscle)
- Kwashiorkor does NOT develop because protein:calorie ratio is preserved
-
KWASHIORKOR:
- Primarily protein deficiency with adequate caloric intake (carbohydrate-rich diet)
- Meaning of word: "the disease the child gets when displaced from breast by next sibling" (Ghanaian)
- Features: Edema (pitting; starts in feet; due to hypoalbuminemia → low oncotic pressure), pot belly (ascites), moon face, fatty liver (↓ VLDL secretion → TG accumulates), skin changes (flaky paint dermatitis), hair changes (flag sign = alternating light/dark bands of hair showing periods of malnutrition/adequate nutrition), apathy/irritability, anorexia
- Lab: Low serum albumin (<2.5 g/dL), low transferrin, low pre-albumin
-
MARASMIC KWASHIORKOR: Mixed form; most severe; both severe wasting AND edema
Biochemical Changes in PEM
- Serum albumin: Reduced in kwashiorkor (most important marker); relatively preserved in marasmus
- Serum transferrin: Short half-life (~8 days) → more sensitive marker of acute nutritional change than albumin (half-life 20 days)
- Pre-albumin/Transthyretin: Half-life ~2 days → most sensitive marker of recent nutritional change; falls first
- Total lymphocyte count: Reduced in PEM → impaired immune response
- Glucose: Low (hypoglycemia) due to reduced GNG precursors
Growth Faltering
- Stunting = chronic malnutrition → height-for-age <-2 SD (below 2 standard deviations)
- Wasting = acute malnutrition → weight-for-height <-2 SD
- Underweight = weight-for-age <-2 SD
- MUAC (Mid-Upper Arm Circumference): <115 mm in children = severe acute malnutrition; easy field screening tool
Management
- WHO F-75 and F-100 therapeutic feeds for severe acute malnutrition; avoid refeeding syndrome
- Refeeding syndrome: Rapid refeeding after starvation → hypophosphatemia (phosphate enters cells with glucose) + hypokalemia, hypomagnesemia → cardiac arrhythmias, respiratory failure, seizures; prevent by introducing feeds slowly
18. NITROGEN BALANCE (5 Marks - 15 Points)
- Definition: Nitrogen Balance = Nitrogen Intake (from protein) - Nitrogen Output (urine + feces + sweat)
- Protein contains ~16% nitrogen by weight → 6.25 g protein = 1 g nitrogen (factor 6.25)
- Nitrogen excreted mainly as urea (90% of urinary N), with smaller amounts as creatinine, uric acid, ammonia
Types of Nitrogen Balance
-
Positive Nitrogen Balance (N intake > N output):
- Occurs during: Growth, pregnancy, recovery from illness, anabolic steroid use, high-protein diet training
- Interpretation: Body is building new protein (anabolic state)
-
Negative Nitrogen Balance (N intake < N output):
- Occurs during: Starvation, protein-deficient diet, severe illness/surgery/burns/trauma, prolonged immobilization, Cushing syndrome, diabetes
- Interpretation: Body is breaking down more protein than it is synthesizing (catabolic state)
-
Zero (Equilibrium) Nitrogen Balance (N intake = N output):
- Healthy, well-nourished non-growing adults in steady state
- Protein intake matches protein turnover (normal adults ~50-70 g protein/day)
Measurement
- N intake: Weigh all food consumed → calculate protein content → divide by 6.25
- N output: 24-hour urine urea nitrogen (UUN) + correction for fecal (2g/day) + skin (0.5g/day) losses
- Formula: N Balance = (Protein intake / 6.25) - (UUN + 4) g/day [4 = fecal + insensible losses]
Clinical Applications
- Post-surgical patients: Negative N balance for 3-5 days even with adequate nutrition (catabolic stress response)
- Burns: Severe negative N balance (massive protein breakdown, wound exudate losses) → requires high-protein feeding (2-3 g/kg/day)
- Sepsis/Critical illness: IL-1, IL-6, TNF-α → ↑ protein catabolism → negative N balance
- Protein RDA: 0.8 g/kg/day for healthy adults; 1.0-1.5 g/kg/day for surgical patients; 1.5-2.0 g/kg/day for critical illness
- Albumin as marker: Serum albumin reflects long-term nitrogen balance (half-life 20 days)
- Biological Value (BV) and Protein Efficiency Ratio (PER) are related measures of protein quality that influence nitrogen balance
SECTION 6: SHORT ANSWER TOPICS (2 Marks - 8 Points Each)
19. BVP - BIOLOGICAL VALUE OF PROTEIN (2 Marks - 8 Points)
- Definition: BV = the proportion of absorbed nitrogen that is retained by the body for growth and maintenance → expressed as % of absorbed N utilized
- Formula: BV = [(N absorbed - N excreted) / N absorbed] × 100
- High BV foods (>70%): Egg white (100 - reference standard), human milk (95), cow's milk (84), meat/fish/poultry (75-80), egg yolk (80)
- Moderate BV (50-70%): Rice (59), corn (54), soybeans (73)
- Low BV (<50%): Wheat gluten (44), gelatin (0 - lacks Trp and is incomplete)
- Factors determining BV: Amino acid composition (complete vs. incomplete proteins); digestibility; presence of limiting amino acids
- Net Protein Utilization (NPU): NPU = BV × Digestibility; a better measure as it combines utilization and digestibility
- BV is higher for animal proteins (contain all essential amino acids in needed proportions); vegetable proteins have lower BV individually but can be improved by complementary proteins
20. RQ - RESPIRATORY QUOTIENT (2 Marks - 8 Points)
- Definition: RQ = Volume of CO₂ produced / Volume of O₂ consumed (measured at steady state)
- RQ values for different substrates:
- Carbohydrates: RQ = 1.0 (e.g., glucose: C₆H₁₂O₆ + 6O₂ → 6CO₂ + 6H₂O; 6CO₂/6O₂ = 1)
- Fats: RQ = 0.7 (fats are more reduced than carbs; need more O₂ per CO₂ produced; e.g., tripalmitin: RQ = 55/78 = 0.703)
- Proteins: RQ = 0.8 (intermediate; average for mixed amino acid oxidation)
- Mixed diet: RQ = 0.82-0.85 (normal fasting RQ)
- RQ >1.0: Indicates lipogenesis from carbohydrate (more CO₂ produced than O₂ consumed; seen after high-carb meal)
- RQ <0.7: Indicates use of ketone bodies, incomplete oxidation, or very high fat intake
- Clinical use: Indirect calorimetry uses RQ to determine substrate being metabolized; if RQ approaches 1.0 in ICU patient → carbohydrate overfeeding → may worsen respiratory failure by ↑ CO₂ production
- RQ vs Respiratory Exchange Ratio (RER): RQ measured at steady state reflects metabolic substrate; RER is affected by non-metabolic CO₂ (hyperventilation, exercise) and may not equal RQ
- Importance in nutrition support: Aim for RQ ~0.85 in ICU patients; RQ >1.0 means excess calories
- RQ for alcohol (ethanol): RQ = 0.67 (most reduced organic fuel); chronic alcoholics have lower RQ
21. LIMITING AMINO ACIDS (2 Marks - 8 Points)
- Definition: A limiting amino acid is the essential amino acid present in the lowest concentration relative to human requirement in a given food protein; it limits protein synthesis to the rate determined by its availability
- Essential amino acids (10): Phenylalanine, Valine, Threonine, Tryptophan, Isoleucine, Methionine, Histidine, Arginine (semi-essential), Leucine, Lysine → Mnemonic: PVT TIM HaLL
- First limiting amino acid = the EAA in shortest supply in a food; Second limiting AA = the next most deficient
- Lysine is the first limiting AA in: Wheat, rice, corn, most cereals (cereal proteins are lysine-deficient)
- Methionine (and cysteine) is the first limiting AA in: Legumes (beans, lentils, peas, soy)
- Tryptophan is the first limiting AA in: Corn/maize (also niacin-deficient in corn → pellagra when corn is the staple diet)
- Threonine is the first limiting AA in: Beans
- Significance of Limiting AA (Liebig's Law of the Minimum): Protein synthesis is limited by the scarcest essential AA; even if all other AAs are abundant, synthesis stops when the limiting AA runs out → excess AAs deaminated → urea → wasted
22. DIETARY IMPORTANCE OF LIPIDS (2 Marks - 8 Points)
- Energy: Most concentrated energy source → 9 kcal/g (2.25× more than carbs/protein); stored as TG in adipose tissue; major fuel for skeletal muscle and heart
- Essential Fatty Acids (EFA): Linoleic (ω-6) and α-linolenic (ω-3) cannot be synthesized → must be dietary; deficiency → scaly dermatitis, poor wound healing, growth retardation
- Fat-soluble vitamin absorption: Vitamins A, D, E, K are soluble only in fat → dietary fat is ESSENTIAL for their absorption via micelles and chylomicrons
- Precursors of eicosanoids: Arachidonic acid (from linoleic) → prostaglandins, thromboxanes, leukotrienes → regulate inflammation, platelet aggregation, vascular tone, immunity
- Structural role: Phospholipids form cell membranes (fluid mosaic model); cholesterol regulates membrane fluidity
- Insulation and protection: Subcutaneous fat insulates body (thermoregulation); visceral fat cushions organs
- Satiety: Dietary fat delays gastric emptying (via CCK) → prolongs satiety after meals
- Cholesterol is precursor of: steroid hormones (cortisol, sex hormones, aldosterone), bile acids, vitamin D → essential for endocrine function
23. DIETARY IMPORTANCE OF CARBOHYDRATES (2 Marks - 8 Points)
- Primary energy source: Preferred fuel for brain (uses 120 g glucose/day), RBCs, kidney medulla, rapidly dividing cells; provides 4 kcal/g
- Protein-sparing effect: Adequate carbohydrate intake prevents use of dietary/body protein for gluconeogenesis → preserves protein for tissue synthesis and repair
- Fat-sparing / Anti-ketogenic: Carbohydrates provide OAA to TCA cycle for acetyl-CoA condensation → without carbs: OAA falls → ketogenesis ↑; adequate carbs prevent ketoacidosis
- Dietary fiber: Non-digestible polysaccharides (cellulose, pectin, hemicellulose) → reduce constipation, reduce risk of colorectal cancer, lower LDL cholesterol (bile acid sequestration), control blood glucose (slow absorption), feed gut microbiome (prebiotic)
- Glycogen storage: Liver glycogen (~100g) maintains blood glucose between meals; muscle glycogen (~400g) provides immediate fuel for exercise
- Precursors for biosynthesis: Glucose → ribose (PPP) for nucleotide synthesis; glucose → glycerol for TG synthesis; glucose → UDP-glucuronate for detoxification; glucose → amino sugars for glycoproteins and glycolipids
- Lactose in milk is important for: infant brain development; source of galactose for cerebrosides and gangliosides (myelin)
- Minimum carbohydrate requirement: ~130 g/day for brain function (if <50 g/day → ketosis develops); dietary recommendation: 45-65% of total calories
24. DIETARY IMPORTANCE OF PROTEINS (2 Marks - 8 Points)
- Tissue growth and repair: Proteins are the primary structural material for muscle, skin, collagen, enzymes, hormones, antibodies, transport proteins; 0.8 g/kg/day minimum for adults
- Enzyme synthesis: All enzymes are proteins → metabolism, digestion, DNA replication, cell signaling all require dietary amino acids as precursors
- Hormone synthesis: Insulin, glucagon, growth hormone, ADH, PTH, thyroid hormone precursors → derived from amino acids
- Antibody/Immune function: Immunoglobulins, complement proteins, cytokines → all require protein; PEM → severe immune deficiency
- Transport proteins: Albumin, hemoglobin, transferrin, ceruloplasmin, lipoproteins → require amino acids
- Maintenance of osmotic pressure: Albumin (major) maintains plasma oncotic pressure; low albumin → edema
- Energy source: When carbohydrate/fat is insufficient, protein provides energy (4 kcal/g); amino acids enter as gluconeogenic precursors or directly into TCA cycle
- Nitrogen balance: Proteins are the only source of organic nitrogen → essential for nucleotide synthesis (purines, pyrimidines), heme, creatine, neurotransmitters (serotonin from Trp, dopamine from Phe/Tyr, GABA from Glu)
25. COMPLEMENTARY PROTEINS (2 Marks - 8 Points)
- Definition: Complementary proteins are two or more incomplete protein sources consumed together (or within the same day) that collectively provide all essential amino acids in adequate amounts - each protein compensates for the other's limiting amino acid(s)
- Principle: One protein's limiting AA is provided by the other protein; together they have BV approaching that of a complete protein
- Classic Example - Cereal + Legume:
- Cereals (wheat, rice): Rich in methionine; deficient in lysine and tryptophan
- Legumes (beans, lentils): Rich in lysine; deficient in methionine
- Together → complete amino acid profile → high quality protein meal
- Real-world examples:
- Dal + Rice (India): Lentils (lysine-rich) + Rice (methionine-rich) → complete protein
- Beans + Corn tortilla (Mexico): Legume + Cereal complementation
- Peanut butter + Wheat bread (USA): Legume + Cereal
- Hummus + Pita: Chickpeas (legume) + Wheat (cereal)
- Milk + Cereals: Milk protein (complete) compensates for all cereal deficiencies → very high BV combination
- Does NOT need to be eaten simultaneously: Within 24 hours is sufficient (body has free amino acid pool from prior meals that can complement)
- Importance in vegetarian/vegan diets: Vegans must pay attention to complementarity to meet all EAA requirements; the key pairs are: cereals + legumes; nuts/seeds + legumes
- Protein quality improvement: Mixing proteins increases Net Protein Utilization (NPU) significantly; e.g., wheat (NPU 40%) + soya (NPU 65%) mixed appropriately → NPU ~75%
Sources: Lippincott's Illustrated Biochemistry 8th Ed., Harper's Illustrated Biochemistry 32nd Ed., Basic Medical Biochemistry (Marks) 6th Ed., Harper's Biochemistry, Smith & Tanagho's General Urology 19th Ed., Harrison's Internal Medicine 22nd Ed.
Good luck with your exam! This covers all 25+ topics in the exact format requested. For visual diagrams in your exam answers, include the images shown above and draw pathway flowcharts for beta-oxidation (O-H-O-T), fatty acid synthesis cycles, ketogenesis steps, and the lipoprotein cascade.