
Hypomagnesemia
hypomagnesemia diagnosis management
hypomagnesemia causes clinical features ECG magnesium deficiency
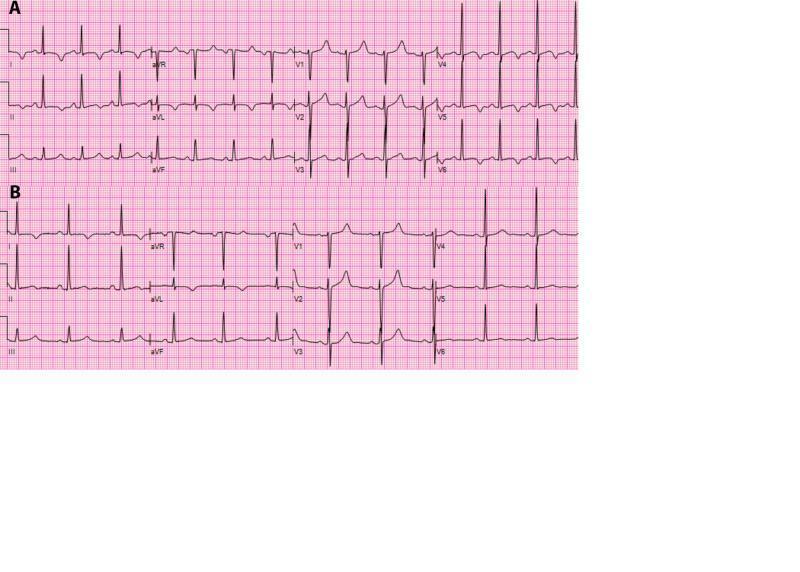
This comparative diagnostic image displays two 12-lead electrocardiogram (ECG) strips, labeled A and B, illustrating the cardiac manifestations of hypomagnesemia and its subsequent resolution. Panel A shows a baseline ECG characterized by a prolonged QT interval and significant T-wave inversions, most prominent in the lateral precordial leads (V5, V6) and lead II. These findings are classic markers of electrolyte-induced repolarization abnormalities. Panel B demonstrates the ECG following magnesium supplementation, showing a restoration of normal repolarization. Key changes include the shortening of the QT interval back toward a physiological range and the conversion of previously inverted T-waves to an upright, normal morphology in the lateral leads. The comparison highlights the critical role of magnesium in myocardial electrical stability and is a valuable educational tool for identifying reversible causes of QT prolongation and ST-T segment changes in clinical practice.
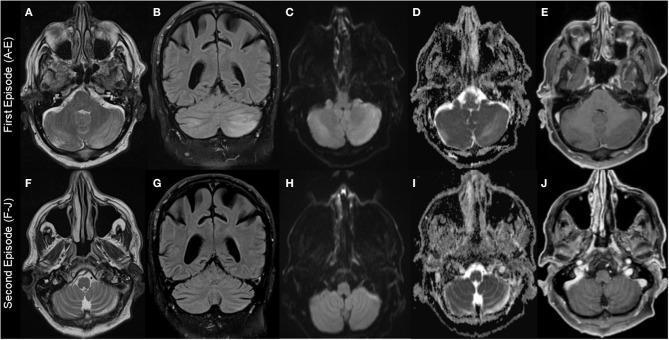
This Comparison Chart displays a panel of axial and coronal brain MRI scans from two distinct clinical episodes (First Episode A-E; Second Episode F-J) in a patient with Hypomagnesemia-induced Cerebellar Syndrome (HiCS). The first episode images demonstrate prominent, left-dominant hyperintense signals in the cerebellar hemispheres on T2-weighted (A), FLAIR (B), and DWI (C) sequences. The ADC map (D) also shows hyperintensity, suggesting vasogenic edema rather than cytotoxic edema. Corresponding T1-weighted images with gadolinium (E) show hypointense lesions without contrast enhancement. In the second episode, follow-up imaging (F-J) reveals a significant reduction in the size and signal intensity of the cerebellar abnormalities. While residual hyperintensity persists on T2W (F), FLAIR (G), and ADC (I), the DWI sequence (H) has normalized. These findings illustrate the characteristic reversible or partially reversible cerebellar edema associated with profound magnesium deficiency, which can mimic subacute stroke or cerebellitis but typically lacks contrast enhancement and restricted diffusion.
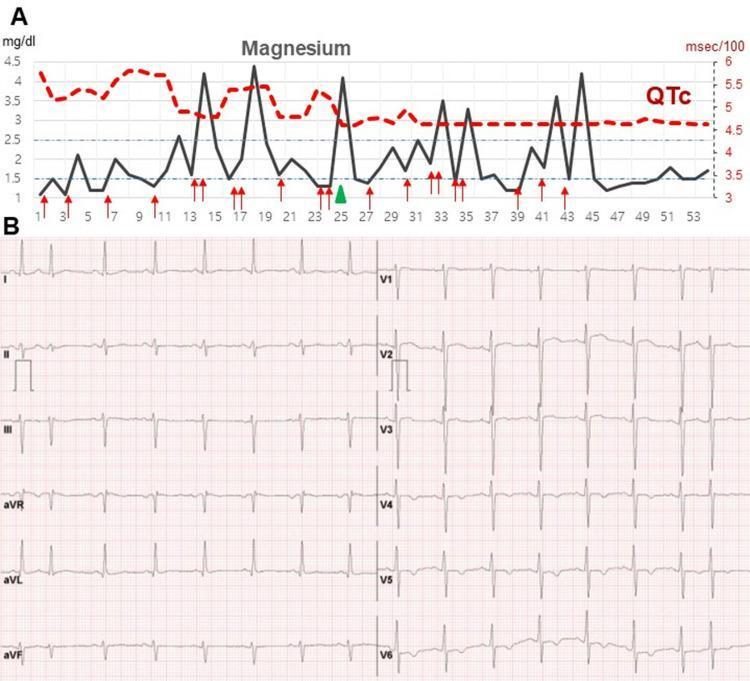
This composite educational graphic consists of two panels focusing on the clinical management of electrolyte imbalances and their cardiac manifestations. Panel A is a dual-axis timeline graph illustrating the longitudinal relationship between serum magnesium levels and the corrected QT interval (QTc). The x-axis tracks time in days (up to day 53). The left y-axis measures serum magnesium (mg/dL, black solid line), showing fluctuations often below the reference range (1.5-2.7 mg/dL). The right y-axis measures the QTc interval (msec/100, red dashed line). Red arrows indicate points of intravenous magnesium supplementation, and a green triangle marks the initiation of vitamin D supplementation, which correlates with the eventual stabilization of magnesium levels and normalization of the QTc interval. Panel B displays a standard 12-lead electrocardiogram (ECG) captured one month after discharge. It shows a normal sinus rhythm with regular P waves, QRS complexes, and T waves. The precordial leads (V1-V6) demonstrate appropriate R-wave progression. This figure illustrates the pathophysiology of secondary long QT syndrome due to refractory hypomagnesemia and the clinical impact of corrective biochemical interventions on cardiac repolarization.
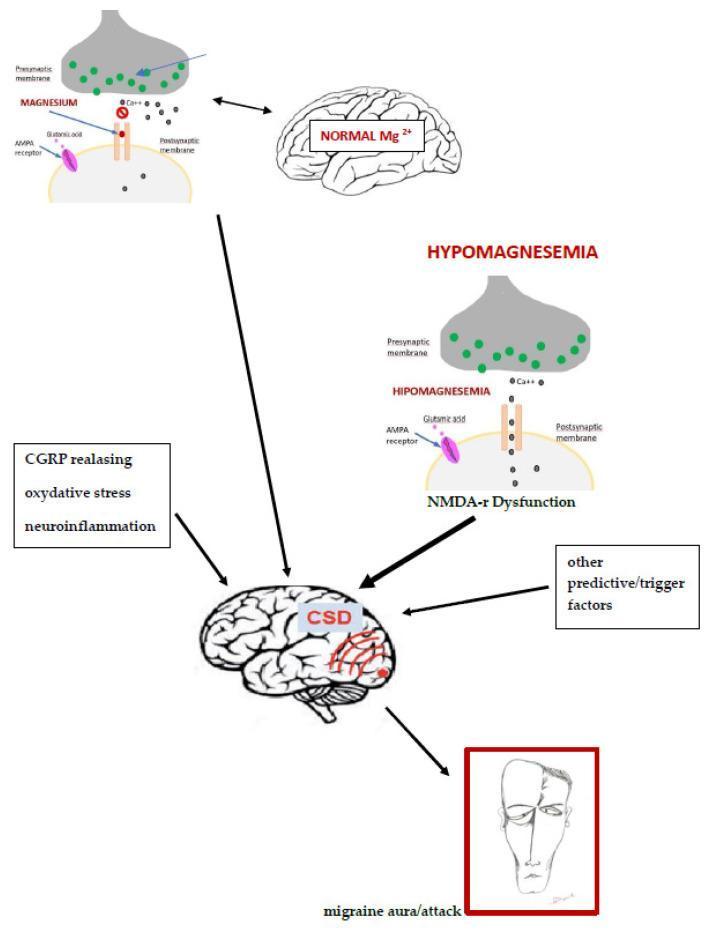
This pathophysiology diagram illustrates the role of magnesium in migraine pathogenesis and synaptic transmission. The top section compares a synapse under 'NORMAL Mg2+' conditions with one in 'HYPOMAGNESEMIA'. In the normal state, the NMDA receptor is shown with a magnesium block, regulating calcium (Ca++) entry. In the hypomagnesemia state, the block is absent, leading to 'NMDA-r Dysfunction' and increased ion flux. The diagram depicts key synaptic components including the presynaptic membrane with neurotransmitter vesicles, the postsynaptic membrane with AMPA and NMDA receptors, and glutamic acid signaling. The central flow shows how hypomagnesemia contributes to Cortical Spreading Depression (CSD), indicated on a brain illustration. Additional contributory factors shown include CGRP release, oxidative stress, neuroinflammation, and other trigger factors. The culmination of these processes is linked to 'migraine aura/attack,' represented by a facial illustration and a brain with focal excitatory waves. This diagram is designed for neurology and biochemistry education to explain the molecular mechanisms of magnesium deficiency in migraine development.
Hypomagnesemia
Definition
Magnesium Physiology (Brief)
- Total body magnesium: ~24 g; only ~60 mg in plasma
- Renal handling: 95-97% of filtered Mg is reabsorbed
- Proximal tubule: 5-15%
- Thick ascending limb (TAL): 50-70% (paracellular, passive)
- Early DCT: 5-10% (active, via TRPM6 channel - the fine-tuning segment)
- Urinary assessment: In hypomagnesemia, normal kidneys reduce FEMg to < 0.5%. In clinical practice:
- FEMg > 4% = renal wasting (pathological)
- FEMg > 2% in the presence of hypomagnesemia = renal wasting
FEMg = (U_Mg × P_Cr) / (P_Mg × 0.7 × U_Cr) × 100
Causes
1. Decreased Intake
- Prolonged fasting / protein-calorie malnutrition
- Chronic alcoholism (also increases urinary losses)
- Inadequate parenteral nutrition
2. Gastrointestinal Losses
- Chronic diarrhea (most common GI cause)
- Laxative abuse
- Malabsorption syndromes (Crohn's, celiac)
- Massive small intestine resection
- Vomiting (minor contribution)
- Acute pancreatitis (fatty acids chelate Mg²⁺)
3. Renal (Urinary) Losses
| Drug/Cause | Mechanism |
|---|---|
| Loop diuretics (furosemide) | Block NKCC2 in TAL, reduce paracellular Mg reabsorption |
| Thiazide diuretics | Block NCC in DCT |
| Aminoglycosides | Direct tubular toxicity |
| Cisplatin | Tubular damage, persistent renal Mg wasting |
| Amphotericin B | Renal tubular toxicity |
| Cyclosporine / Tacrolimus | Calcineurin inhibitors - impair TRPM6 |
| Proton pump inhibitors | Impair intestinal and renal Mg handling |
| Pentamidine | Tubular damage |
| Hypercalcemia | Ca²⁺ competes with Mg²⁺ in TAL |
| Osmotic diuresis (DKA, glycosuria) | Volume expansion reduces tubular reabsorption |
| Volume expansion | Increased tubular flow reduces Mg reabsorption |
4. Intravascular Chelation / Extravascular Deposition
- Hungry bone syndrome (post-parathyroidectomy)
- Citrate loading from blood product transfusions
- Acute pancreatitis (free fatty acids chelate Mg²⁺)
5. Genetic / Inherited Disorders
| Category | Examples |
|---|---|
| Hypercalciuric hypomagnesemias (TAL defects) | Familial hypomagnesemia with hypercalciuria and nephrocalcinosis (FHHNC) - mutations in CLDN16 or CLDN19 |
| Gitelman-like (DCT defects) | Gitelman syndrome (SLC12A3), Bartter syndrome (types 3 & 4), EAST syndrome (KCNJ10), HNF1B nephropathy |
| Mitochondrial | Mitochondrial metabolic syndromes, Kearns-Sayre syndrome |
| Other | Hypomagnesemia with secondary hypocalcemia (TRPM6 mutations), hypomagnesemia with seizures & mental retardation (CNNM2), hypomagnesemia with abnormal EGF signaling |
Associated Electrolyte Disorders
- Hypokalemia in 40% of cases (conversely, 60% of patients with hypokalemia have coexistent hypomagnesemia)
- Hypocalcemia in 20% of cases
- Hyponatremia and hypophosphatemia also common
Clinical Features
Neuromuscular
- Muscle cramps, weakness, fatigue (early/mild)
- Tremor, fasciculations
- Hyperreflexia
- Tetany (Trousseau's and Chvostek's signs - from concurrent hypocalcemia)
- Ataxia, nystagmus
- Confusion, seizures (severe)
Cardiovascular
- Prolonged PR interval, QRS widening, prolonged QT interval
- Wide range of arrhythmias
- Torsades de pointes (classic life-threatening arrhythmia)
- Increased digoxin toxicity risk (Mg²⁺ shares the Na⁺/K⁺-ATPase binding site with digoxin)
- In post-surgical patients, can be life-threatening
ECG in Hypomagnesemia:
Serum Mg - QTc relationship over time:
Diagnosis
- Serum Mg - first-line test; levels in the normal range do not rule out total body depletion
- Urine Mg (spot or 24h):
- 24h urine Mg > 24 mg in the presence of hypomagnesemia = renal wasting
- FEMg > 2% in hypomagnesemia = renal wasting
- High-risk groups to screen: malnutrition, chronic diarrhea, alcoholism, diuretic use, digoxin use, ICU patients
- Note: Mg is not included on routine metabolic panels - must be specifically ordered
| Renal Wasting | GI/Dietary | |
|---|---|---|
| FEMg | > 2-4% | < 2% |
| 24h urine Mg | > 24 mg | Low |
Treatment
Mild / Asymptomatic (Serum Mg 1.0-1.3 mg/dL)
- Oral magnesium replacement (magnesium oxide, magnesium chloride, or magnesium gluconate)
- Address underlying cause (stop offending drugs, treat diarrhea)
Moderate-to-Severe / Symptomatic
- IV magnesium sulfate (MgSO₄) - 1 g MgSO₄ = 0.1 g elemental Mg
- Consensus protocol: 8-12 g MgSO₄ in first 24 hours, then 4-6 g/day for 3-4 days
- Replete potassium only after magnesium is adequate
Torsades de Pointes
- 2 g MgSO₄ IV bolus over 5 minutes (ACC/AHA recommendation)
Acute MI with Hypomagnesemia (AHA)
- 2 g MgSO₄ over 15 minutes, followed by 18 g over 24 hours
Severe hypomagnesemia (< 1.0 mEq/L)
- Requires sustained therapy (slow equilibration between intracellular and extracellular compartments)
Special Considerations
- Renal insufficiency: Reduce dose by 50-75%; monitor closely
- Monitor: Deep tendon reflexes (loss = early sign of hypermagnesemia), serum Mg levels at regular intervals
- Potassium-sparing diuretics (amiloride, triamterene): Helpful in chronic renal Mg wasting by blocking the distal Na channel, reducing urinary Mg losses
- Potassium co-supplementation: Must be given alongside Mg in hypokalemia
Key Associations to Remember
| Feature | Detail |
|---|---|
| Most common drug cause | Loop diuretics |
| Classic arrhythmia | Torsades de pointes |
| Refractory hypokalemia | Think hypomagnesemia |
| Refractory hypocalcemia | Think hypomagnesemia (check Mg before treating Ca) |
| Alcoholism | Triple threat: poor intake + GI loss + renal loss |
| PPI long-term use | PPI-induced hypomagnesemia (often underdiagnosed) |
| Post-cardiac surgery ICU | High risk; treat empirically if < 1.2 mg/dL |
| Digoxin use | Hypomagnesemia dramatically increases digoxin toxicity |
- Brenner and Rector's The Kidney, 2-Volume Set, pp. 3158-3159
- National Kidney Foundation Primer on Kidney Diseases, 8e, pp. 144-145 (NKF Primer on Kidney Diseases)
- Sabiston Textbook of Surgery, The Biological Basis of Modern Surgical Practice, p. 606