Explain ten common heart diseases with Ecg changes and ecg images of those diseases
Reading File
Finding Sources
Searching Images
myocardial infarction STEMI ECG ST elevation
Searching Images
atrial fibrillation ECG electrocardiogram
Finding Sources
Searching Images
ventricular fibrillation ECG waveform
Searching Images
complete heart block third degree AV block ECG
Searching Images
left bundle branch block LBBB ECG 12 lead
Searching Images
Wolff-Parkinson-White WPW syndrome delta wave ECG
Searching Images
ventricular tachycardia VT ECG wide complex
Searching Images
hypertrophic cardiomyopathy ECG left ventricular hypertrophy
Searching Images
pericarditis ECG saddle shaped ST elevation diffuse
Searching Images
heart failure dilated cardiomyopathy ECG sinus tachycardia
Here is a comprehensive guide to 10 Common Heart Diseases with ECG Changes and Images:
10 Common Heart Diseases: ECG Changes & Images
1. 🫀 ST-Elevation Myocardial Infarction (STEMI)
Overview
STEMI occurs due to complete occlusion of a coronary artery (most commonly the LAD), causing transmural myocardial injury with a classic sequence of ECG changes.
ECG Changes
| Phase | ECG Finding |
|---|---|
| Hyperacute (minutes) | Tall, peaked "hyperacute" T waves |
| Acute (hours) | ST elevation ≥ 1 mm in ≥2 contiguous leads; convex/tombstone morphology |
| Evolving (hours–days) | T-wave inversion; Q wave formation |
| Old/Chronic | Pathological Q waves (>40ms, >25% of R height); T-wave inversion |
Localization by leads:
- Anterior (V1–V4): LAD occlusion
- Inferior (II, III, aVF): RCA or LCx occlusion
- Lateral (I, aVL, V5–V6): LCx occlusion
- Reciprocal depression in opposite leads confirms the diagnosis
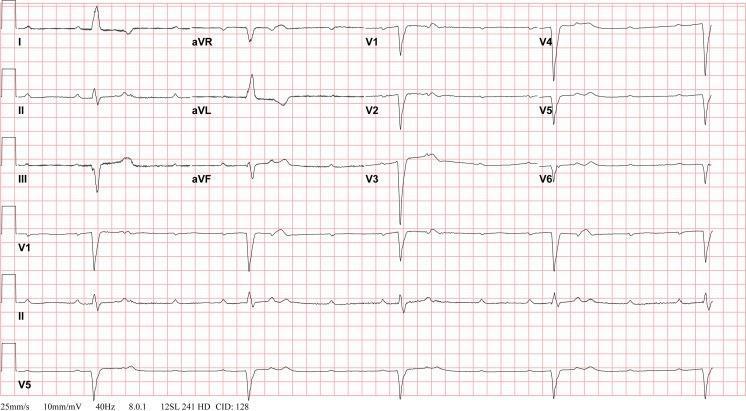
ECG Image — Anterior STEMI (LAD occlusion)
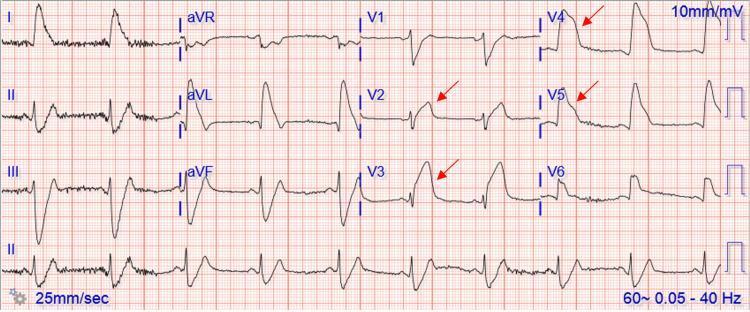
Prominent ST-segment elevation in V2–V5 with tombstone/coved morphology and reciprocal ST depression in II, III, aVF — classic proximal LAD occlusion.
ECG Image — Inferolateral STEMI
ST elevation in V4–V6 and inferior leads with reciprocal ST depression in aVL and lead I.
2. 🫀 Atrial Fibrillation (AF)
Overview
AF is the most common sustained arrhythmia, characterized by disorganized atrial electrical activity with loss of effective atrial contraction.
ECG Changes
- Absent P waves — replaced by fine fibrillatory (f) waves (best seen in V1, II)
- Irregularly irregular R-R intervals — no two R-R intervals are equal
- Narrow QRS complexes (unless aberrant conduction or pre-excitation)
- Rate may be rapid (uncontrolled AF ~100–160 bpm) or controlled (<100 bpm)
- AF with RVR: rate >100 bpm; AF with slow ventricular response: rate <60 bpm
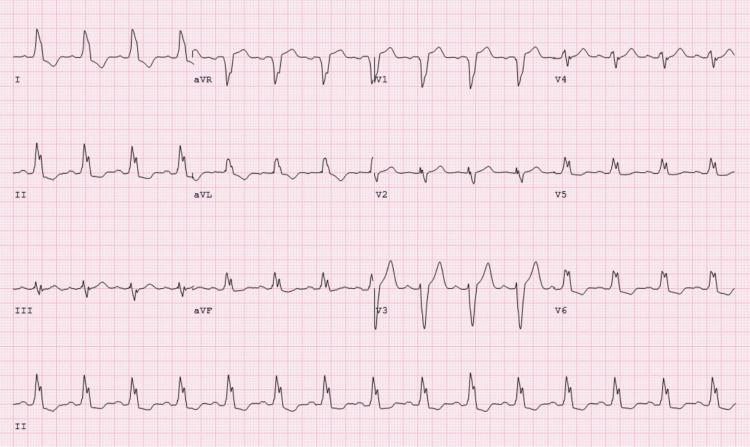
ECG Image — Atrial Fibrillation with Rapid Ventricular Response
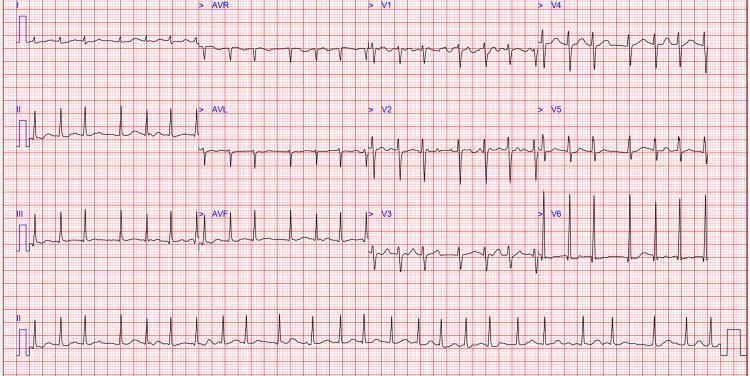
Classic irregularly irregular R-R intervals with fibrillatory baseline replacing P waves. Narrow QRS complexes with variable amplitude.
3. 🫀 Ventricular Fibrillation (VF)
Overview
VF is a life-threatening, disorganized ventricular arrhythmia causing immediate loss of cardiac output. It is a shockable cardiac arrest rhythm requiring immediate defibrillation.
ECG Changes
- Complete absence of identifiable P waves, QRS complexes, and T waves
- Chaotic, irregular, undulating waveform with variable amplitude and frequency
- Coarse VF: larger amplitude waves (more amenable to defibrillation)
- Fine VF: low amplitude, near-isoelectric (more ischemic myocardium, worse prognosis)
- No organized electrical activity whatsoever
ECG Image — Ventricular Fibrillation
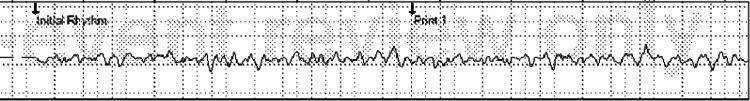
Rapid, chaotic, disorganized electrical activity with no identifiable P-QRS-T complexes — classic coarse VF pattern requiring immediate defibrillation.
4. 🫀 Third-Degree (Complete) AV Block
Overview
Complete AV block means total failure of conduction between the atria and ventricles. The atria and ventricles beat independently (AV dissociation), sustained by a ventricular or junctional escape pacemaker.
ECG Changes
- P waves and QRS complexes present but completely dissociated — no fixed PR interval
- Atrial rate > ventricular rate (e.g., atria at 80 bpm, ventricles at 35–50 bpm)
- Junctional escape rhythm: narrow QRS (~40–60 bpm) — block at AV node
- Ventricular escape rhythm: wide QRS >120ms (~20–40 bpm) — block below His bundle
- P waves "march through" QRS complexes and T waves
ECG Image — Complete (Third-Degree) AV Block
Complete AV dissociation: atrial P waves at faster rate with no relationship to the slow, wide ventricular escape rhythm.
5. 🫀 Left Bundle Branch Block (LBBB)
Overview
LBBB is a conduction delay in the left bundle branch causing abnormal, slow left ventricular depolarization. New LBBB in the context of chest pain is treated as a STEMI equivalent (Sgarbossa criteria apply).
ECG Changes
- Wide QRS ≥ 120 ms
- V1: deep broad S wave (QS or rS pattern) — negative deflection
- V5–V6, I, aVL: broad, monophasic R waves, often notched or "M-shaped"
- ST-T discordance: ST/T waves opposite to QRS direction (secondary repolarization changes)
- No septal Q waves in lateral leads (I, V5–V6)
- Left axis deviation common
ECG Image — Left Bundle Branch Block
Wide QRS with deep broad S waves in V1–V3 and broad monophasic R waves in lateral leads I, aVL, V5–V6. Discordant ST-T changes are secondary repolarization abnormalities.
6. 🫀 Wolff-Parkinson-White (WPW) Syndrome
Overview
WPW involves an accessory conduction pathway (bundle of Kent) that bypasses the AV node, causing ventricular pre-excitation. It can lead to dangerous tachyarrhythmias including AVRT and — critically — AF with rapid ventricular conduction.
ECG Changes (Classic Triad)
| Feature | Finding |
|---|---|
| Short PR interval | < 120 ms (bypass of AV node delay) |
| Delta wave | Slurred upstroke at onset of QRS |
| Wide QRS | > 120 ms (due to pre-excitation) |
- Secondary ST-T wave changes (discordant to delta wave direction)
- Pseudo-infarct Q waves (negative delta waves in some leads)
- WPW type A (positive delta in V1): left-sided pathway
- WPW type B (negative delta in V1): right-sided pathway
ECG Image — WPW with Classic Delta Wave
Short PR interval (<120ms), slurred delta wave upstroke at QRS onset in II, III, aVF, and V2–V6 — classic WPW pre-excitation pattern.
7. 🫀 Ventricular Tachycardia (VT)
Overview
VT is a life-threatening arrhythmia defined as ≥3 consecutive ventricular beats at ≥100 bpm, originating below the bundle of His. Sustained VT (>30 s) requires urgent treatment.
ECG Changes
- Wide complex tachycardia: QRS ≥ 120 ms, rate 100–250 bpm
- AV dissociation: P waves independent of QRS (pathognomonic of VT)
- Fusion beats and capture beats (Dressler beats) — confirms VT
- Concordance in precordial leads (all positive = positive concordance; all negative = negative concordance)
- Northwest axis (extreme right axis deviation) — highly suggestive of VT
- Regular rhythm (monomorphic VT) or irregular (polymorphic VT/torsades)
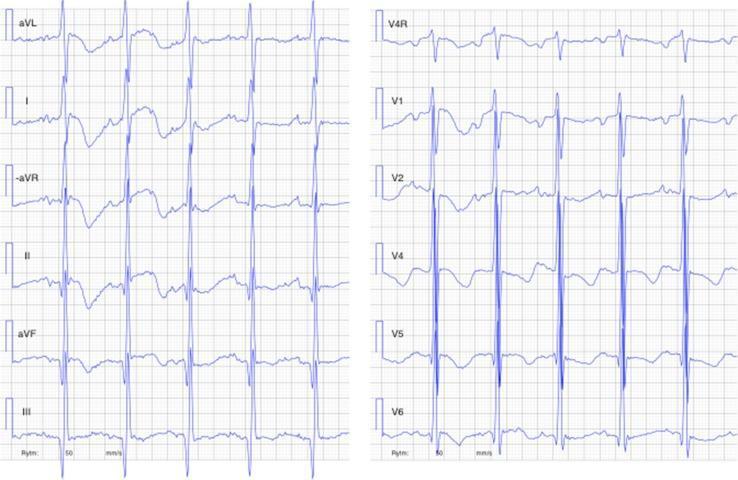
ECG Image — Monomorphic Ventricular Tachycardia
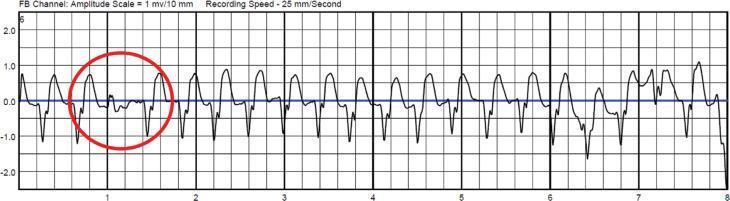
Wide-complex tachycardia at ~150 bpm. A capture beat (red circle) demonstrates transient sinus node control amidst AV dissociation — pathognomonic for VT.
8. 🫀 Hypertrophic Cardiomyopathy (HCM)
Overview
HCM is a genetic sarcomeric protein disorder causing asymmetric septal (or apical) hypertrophy. It is a leading cause of sudden cardiac death in young athletes. The ECG is rarely normal — it is abnormal in ~75–95% of patients.
ECG Changes
- Left ventricular hypertrophy (LVH): high-voltage QRS (Sokolow-Lyon: S in V1 + R in V5/V6 ≥35 mm)
- Giant T-wave inversions in V2–V5 (especially apical HCM — Yamaguchi syndrome)
- ST-segment depression and deep T-wave inversions in lateral leads
- "Strain pattern": ST depression + T-wave inversion in lateral leads (I, aVL, V5–V6)
- Absence of septal Q waves in lateral leads (due to abnormal septal depolarization)
- Possible left axis deviation, atrial fibrillation, or LBBB
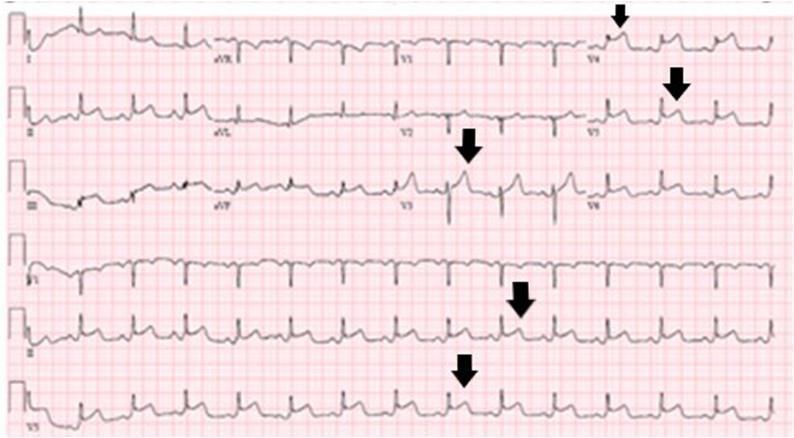
ECG Image — Hypertrophic Cardiomyopathy (Apical Variant)
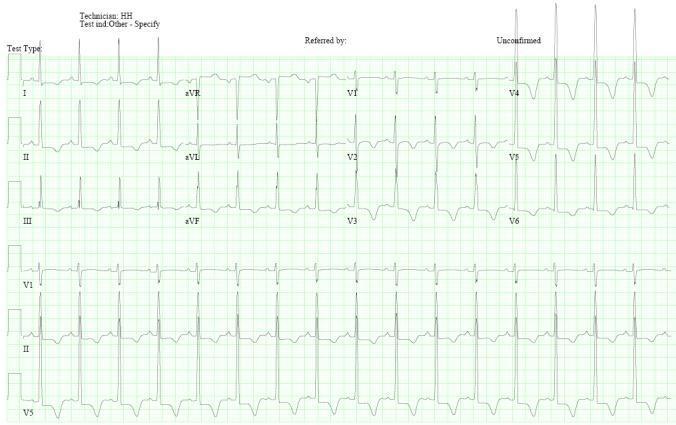
High-voltage R waves (LVH criteria) with characteristic giant T-wave inversions in V2–V5 — hallmark of apical HCM (Yamaguchi syndrome).
ECG Image — HCM Comparison (Concentric vs. Septal vs. Apical)
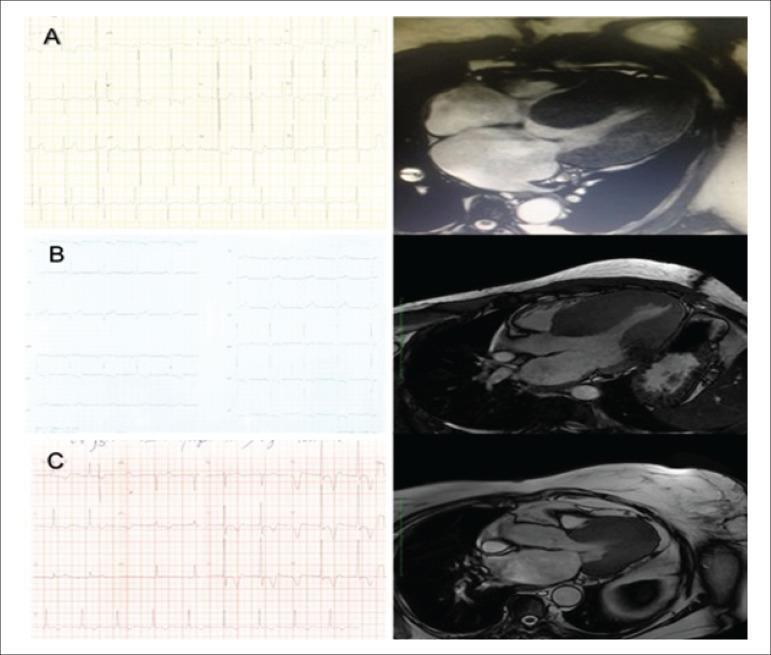
Three morphological patterns of HCM: (A) concentric hypertrophy — high-amplitude R waves with strain; (B) septal hypertrophy — moderate voltage changes; (C) apical — giant T-wave inversions.
9. 🫀 Acute Pericarditis
Overview
Pericarditis is inflammation of the pericardial sac, most commonly viral. The hallmark ECG changes reflect epicardial injury and are diffuse (not in a single coronary territory), distinguishing it from STEMI.
ECG Changes (4 Classic Stages)
| Stage | ECG Finding | Timing |
|---|---|---|
| Stage 1 | Diffuse concave ("saddle-shaped") ST elevation + PR depression | Days 1–2 |
| Stage 2 | ST normalizes; PR depression persists | Days 3–7 |
| Stage 3 | T-wave inversions | Weeks 1–3 |
| Stage 4 | Normalization | Weeks–months |
Key distinguishing features from STEMI:
- ST elevation is concave (not convex/tombstone)
- PR depression in most leads (aVR shows PR elevation) — pathognomonic
- Spodick's sign: downsloping TP segment
- No reciprocal ST depression (except aVR and V1)
- Diffuse distribution (not limited to one coronary territory)
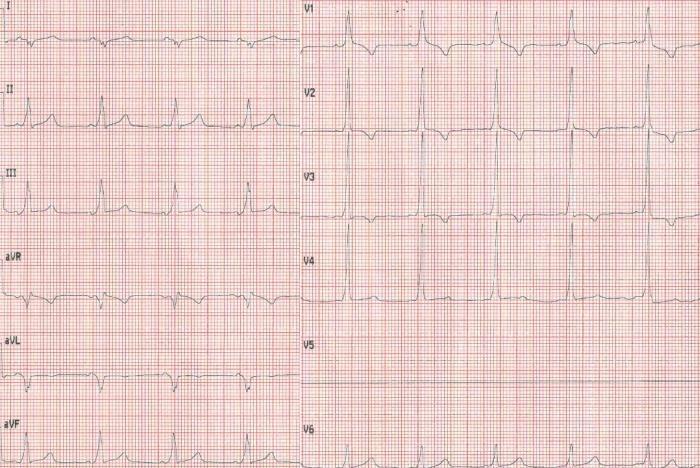
ECG Image — Acute Pericarditis

Diffuse concave saddle-shaped ST elevation across I, II, aVF, V2–V6 with PR-segment depression in lead II and reciprocal PR elevation in aVR — classic acute pericarditis.
10. 🫀 Heart Failure / Dilated Cardiomyopathy (DCM)
Overview
Heart failure and DCM produce a range of ECG abnormalities reflecting structural remodeling (ventricular dilation, wall stress, fibrosis) and hemodynamic compensation. No single ECG pattern is pathognomonic, but the combination of findings raises clinical suspicion.
ECG Changes
- Sinus tachycardia: compensatory, especially in decompensated HF
- Left bundle branch block (LBBB): ~25–30% of DCM patients; associated with cardiac dyssynchrony
- Left ventricular hypertrophy (voltage criteria): from pressure/volume overload
- Left atrial enlargement: broad notched P waves in II, deep negative P in V1 (P-mitrale)
- Non-specific ST-T changes: ST depression and T-wave flattening/inversion
- Pathological Q waves: may reflect myocardial fibrosis (non-ischemic cardiomyopathy)
- Atrial fibrillation: common complication of heart failure
- Prolonged QTc: due to electrolyte disturbances, medications, or myocardial remodeling
- Low QRS voltage: if pericardial effusion coexists
ECG Image — Dilated Cardiomyopathy / Heart Failure
Sinus tachycardia with high-voltage QRS (LVH criteria), widespread ST-segment depression with T-wave inversion (ventricular strain pattern), and enlarged P waves (atrial overload) in dilated cardiomyopathy.
Quick Reference Summary Table
| # | Disease | Key ECG Features |
|---|---|---|
| 1 | STEMI | ST elevation ≥1mm in ≥2 leads, Q waves, T-wave inversion |
| 2 | Atrial Fibrillation | Absent P waves, irregularly irregular R-R |
| 3 | Ventricular Fibrillation | Chaotic waveform, no P-QRS-T |
| 4 | Complete AV Block | AV dissociation, bradycardia, wide escape QRS |
| 5 | LBBB | Wide QRS, deep S in V1, broad R in V5-V6, discordant ST-T |
| 6 | WPW Syndrome | Short PR, delta wave, wide QRS |
| 7 | Ventricular Tachycardia | Wide complex tachycardia, AV dissociation, capture beats |
| 8 | Hypertrophic Cardiomyopathy | LVH, giant T inversions, strain pattern |
| 9 | Acute Pericarditis | Diffuse saddle-shaped ST elevation, PR depression |
| 10 | Heart Failure/DCM | Sinus tachycardia, LBBB, LVH, ST-T changes, AF |
Clinical Note: ECG interpretation must always be correlated with clinical history, symptoms, and additional investigations (troponins, echocardiography, imaging). ECG changes can overlap between conditions — for example, new LBBB can mask STEMI, and HCM can mimic ischemia. Any ECG suggesting an acute coronary syndrome or malignant arrhythmia warrants immediate clinical evaluation.
This is a shared conversation. Sign in to Orris to start your own chat.